User:Pm1912
EX3 Section
Job files and Summary tables
Geometry Information
| BH3 | BBr3 | GaBr3 | |
|---|---|---|---|
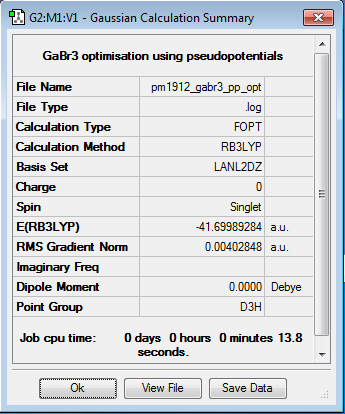
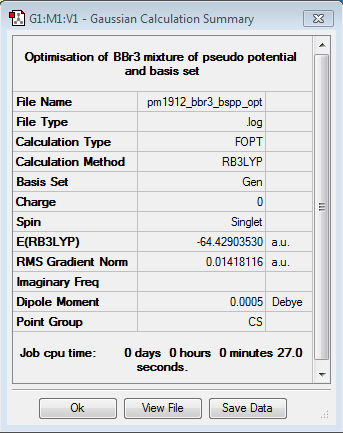
| r(E-X) Å | 1.19 | 2.02 | 2.39 |
| θ(X-E-X) degrees(º) | 120.0 | 120.0 | 120.0 |
Borane
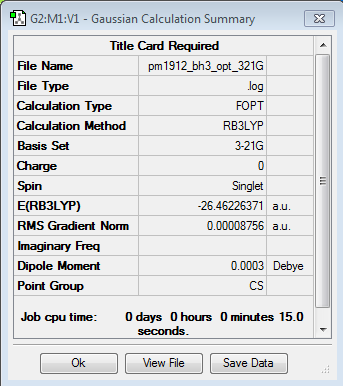
B3LYP/3-21G level
Optimisation log file here
| Summary Data | Convergence | Jmol | |||
|---|---|---|---|---|---|
 |
 |
|
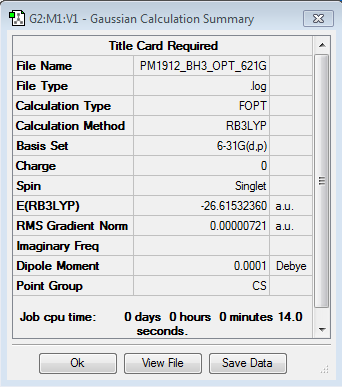
B3LYP/6-21G level
Optimisation log file here
| Summary Data | Convergence | Jmol | |||
|---|---|---|---|---|---|
 |
 |
|
Gallium Bromide
B3LYP/LANL2DZ
Optimisation log file DOI:10042/87407
| Summary Data | Convergence | Jmol | |||
|---|---|---|---|---|---|
 |
 |
|
Boron Tribromide
B3LYP/6-31G(d,p)LANL2DZ
Optimisation log file DOI:10042/87532
| Summary Data | Convergence | Jmol | |||
|---|---|---|---|---|---|
 |
 |
|
Analysis
An increase in size of the ligand, in this case from hydrogen to bromine, increases the bond length. This is because of orbital enlargement, the increased size means more space is taken up between the atoms and they are pushed further apart. The equilibrium energy of the bond is at a greater bond length for heavier atoms. It makes sense then, that the molecule composed of the heaviest molecules (GaBr3) has the greatest bond length.
Bromine is a much heavier element than hydrogen being in group 7 rather than in group 1. Being a halogen and therefore an electron acceptor it can react with hydrogen which is an electron donor. Bromine is also in period 4 so has a far greater number of electron shells making it larger in size.
Changing the central atom from boron to gallium increases bond length slightly, though not on the same scale as the ligand difference. This is again due to orbital expansion as larger orbitals will use more pace and therefore make the bond longer. Gallium will use its 4p orbital while boron only has a 2s orbital, which is significantly smaller, decreasing the atomic radius.
Boron and gallium are in the same group and both have 3 electron in their outmost shell, each with one electron in the valence p orbital. However, boron is in the 2nd period while gallium is in the 4th period, making it much larger due to having more electron shells and therefore its valence orbitals are also larger.
Smaller atoms can get closer to each other and therefore have greater overlap, better overlap is also achieved when atoms involved in bonds are of similar size so their orbitals are also of similar size enabling better overlap and therefore bonding. This latter point is true for both BH3¬ and GaBr3 but for BBr3 the orbital overlap will not be as good and this corresponds to the larger bond length. The more electronegative an atom is the more it pull electrons towards it and the stronger the bond length ergo a shorter bond. Bromine is quite electronegative so this strengthens the bonds but not enough in either GaBr3 or BBr3 to make the bonds as strong as in BH3.
Some Background Information
A bond is an interaction between orbitals of two different atoms. The orbitals overlap and this cause a molecular orbital to form from the two atomic orbitals. The orbitals interact because of the donation and acceptance of electrons between them. The exchange is what causes the electrostatic attraction between the molecules and forms the bond.
An example of a strong bond would be the nitrogen – nitrogen triple bond which has a mean bond energy of 946 KJmol-1. This bond has so much energy because three pairs of oribitals are involved in the bond. Not just the σ molecular orbitals but two π molecular orbitals are also adding to the bond strength. A medium bond would be like the oxygen double bond O=O, which has a mean bond enthalpy of 497 KJmol-1 which is less than half than the previous example. On top of the σ orbital interaction there is also one π orbital interaction making the bond stronger. An example of a weak bond would be the iodine – iodine (I-I) bond. This only has a mean bond enthalpy of 151 KJmol-1 because there is only one σ molecular orbital, and the molecule does not suffice the octet rule well. Even weaker than any of these intramolecular bonds are intermolecular bonds such as instantaneous dipole – induced dipole bonds, or hydrogen bonds. These are purely electrostatic interactions dependent on the charge or dipoles of molecules and are on the scale of 21 KJmol-1.[1]
Gaussview draws bond based on the distance between the two atoms and whether this distance is within the criteria for it to draw a bond. Therefore is there are no bonds shown the bond length is greater than some pre-defined value, but there is still a bond there.
Borane
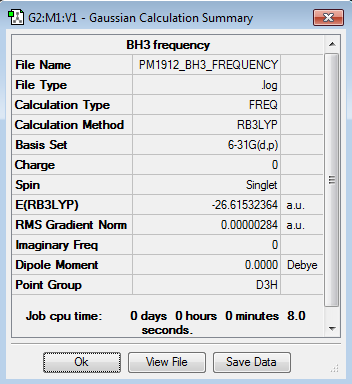
B3LYP/6-31G level
Frequency file here
| Summary Data | Low Modes |
|---|---|
 |

|
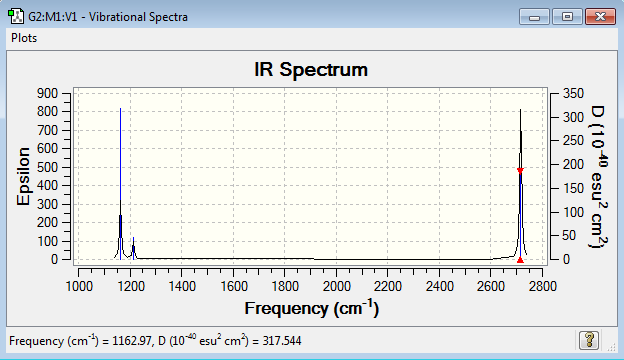
Vibrational spectrum for BH3
| Wavenumber (cm-1) | Intensity | IR Active? | Type |
|---|---|---|---|
| 1163 | 93 | yes | bend |
| 1213 | 14 | very slight | bend |
| 1213 | 14 | very slight | bend |
| 2583 | 0 | no | stretch |
| 2716 | 126 | yes | stretch |
| 2716 | 126 | yes | stretch |
Judging by the 3N-6 rule there should be 6 modes of vibration for BH3 and there are. But only three peaks are present on the IR spectrum. One of the vibrations (2583 cm-1) has an intensity of 0, this is because it is not IR active. The vibration is a totally symmetric stretch so there is no dipole movement in the molecule and therefore it is not detected by IR spectroscopy. There are also two pairs of vibrations (1213 and 2716 cm-1) that are degenerate. This means that they have the same energy and therefore the same wavenumber. So they both appear as the same peak on the same spectrum.
Gallium Bromide
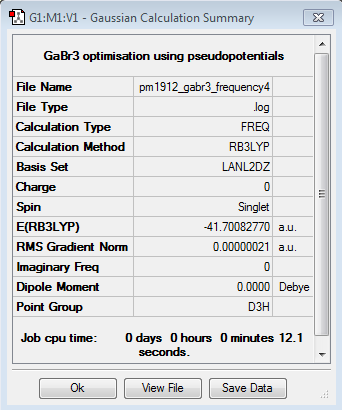
B3LYP/LANL2DZ
Frequency file DOI:10042/90460
| Summary Data | Low Modes |
|---|---|
 |

|
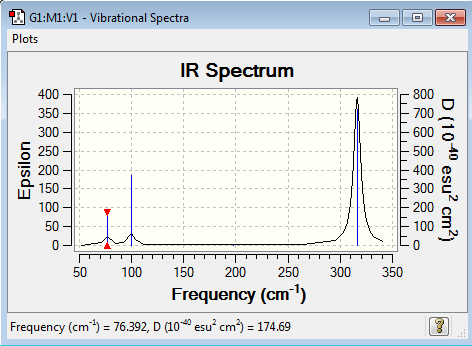
Vibrational spectrum for GaBr3
| Wavenumber (cm-1) | Intensity | IR Active? | Type |
|---|---|---|---|
| 76 | 3 | very slight | bend |
| 76 | 3 | very slight | bend |
| 100 | 9 | very slight | bend |
| 197 | 0 | no | stretch |
| 316 | 57 | yes | stretch |
| 316 | 57 | yes | stretch |
Analysis
The vibrational frequencies of BH3 are much larger than that of GaBr3 and its IR spectrum is focused around wavenumbers in the 1000 – 3000 cm-1 while that of GaBr3 is below 350 cm-1. This large difference indicates that the bonds in BH3 have a much higher energy than the GaBr3 bonds so are therefore stronger. This analysis is backed up by the previous optimisations where the bond lengths in BH3 are shown to be less than in GaBr3 as shorter bond lengths correspond to stronger bonds. Also heavier atoms vibrate less frequently than lighter atoms, this is why GaBr3 vibrates at such a lower frequency compared to BH3.
The A2’’ motion in BH3 is a peak at 1163 cm-1 while in GaBr3 it is a peak at 100 cm-1 and now has a higher wavenumber and therefore energy of the two E’ degenerate bend vibrations. From BH3 to GaBr3 the frequency has decreased from 1163 cm-1 to 100 cm-1, while the intensity has decreased from 93 to 9. This has not decreased as much as the degenerate E’ orbitals so the modes have been reordered. In BH3 the boron atom moves a lot less than the hydrogen atoms along the z axis in terms of displacement while in GaBr3 gallium moves mores along the z axis than the bromine atoms. GaBr3 has a larger displacement vector than BH3, this is because it is composed of much heavier atoms, so the bonds between the atoms are weaker and they are able to move more freely and further away from each other. Bromine is in group 7, so due to its busy valence shell its displacement vector is reduced and therefore gallium moves further in GaBr3.
Some Background on Frequency Calculations
When optimising the molecule the method and basis set used depends on the elements in the molecule and how heavy they are, as heavier molecules require longer calculations. This does not change for frequency calculations as the element in the molecule have not changed and still require that particular method and basis set.
A frequency analysis allows the vibrational movements of molecules to be studied. The products of a calculation show all the different modes of vibration, their energies and intensities. From this data degenerate modes can be found and IR active and IR inactive modes distinguished. An IR spectrum can be plotted with all the vibrational peaks. This can be used to compare with IR from experiments to see if a particular molecule is present.
The low frequencies represent the motions of the centre of mass of the molecule and are taken off from the modes of vibration by the 3N-6 equation.
MO diagram for Borane
B3LYP/6-21G level
Population file DOI:10042/93155
Analysis
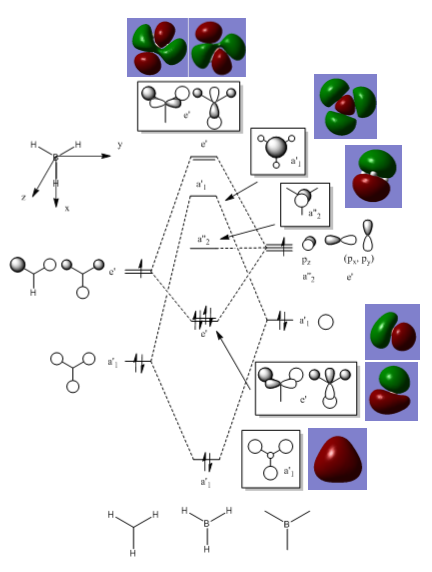
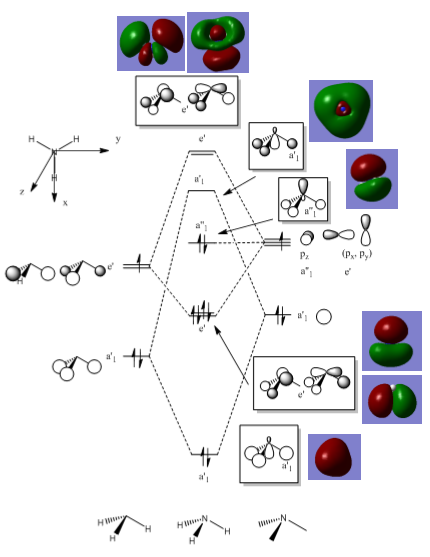
The qualitative model is a good approximation of the MO are it estimates correctly where the orbitals will be and what phase they are in. The main difference in the real MOs is that the orbitals are more diffuse so appear as one large orbital for each phase. Also in the real MOs the orbitals are not always of equal size as seen in the degenerate e’ orbitals where one phase appears larger than the other. This is not predicted in the qualitative model. For example the LCAO MO for the bonding a’1 symmetry shows contributions from each of the s orbitals from each of the atoms. Whereas in the real MO the different atomic contributions cannot be distinguished, the MO instead appears as one large orbital encompassing the molecule. This overlap of orbitals is seen in all the real MOs where bonding orbitals and anti-bonding orbitals merge respectively into one large orbital creating a very different picture form the LCAO MOs.
However, there is still a strong relation between the two as qualitative MO theory can show where bonding/anti-bonding orbitals will be in relation to each other, what it lacks it the ability to produce an accurate representation of the real MO. In terms of calculations this makes the qualitative theory not useful but it is still a useful tool in predicting MOs when programs such as Gaussian are not available.
Ammonia
B3LYP/6-21G level
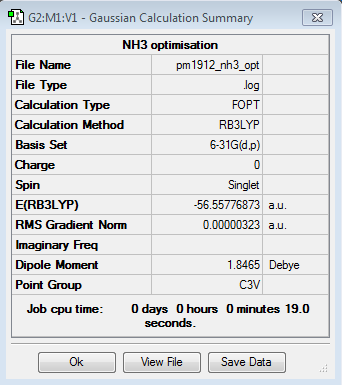
Optimisation log file here
| Summary Data | Convergence | Jmol | |||
|---|---|---|---|---|---|
 |
 |
|
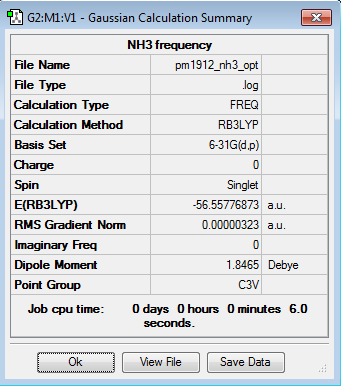
Frequency file here
| Summary Data | Low Modes |
|---|---|
 |

|
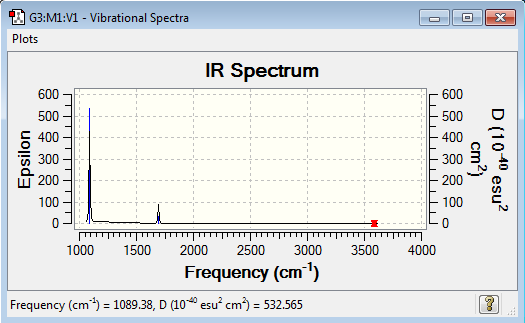
Vibrational spectrum for NH3
| Wavenumber (cm-1) | Intensity | IR Active? | Type |
|---|---|---|---|
| 1089 | 145 | yes | bend |
| 1693 | 14 | very slight | bend |
| 1693 | 14 | very slight | bend |
| 3461 | 1 | no | stretch |
| 3590 | 0 | no | stretch |
| 3590 | 0 | no | stretch |
Population file DOI:10042/93158
MO diagram
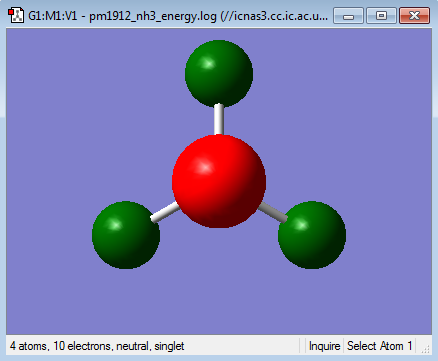
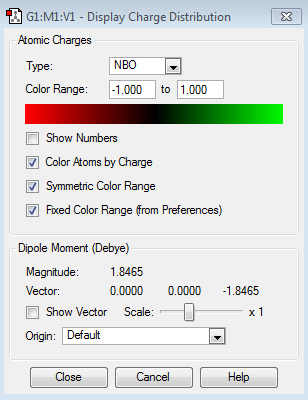
NBO Analysis
| Charge Distribution | Charge Range |
|---|---|
 |
|
| Atom | Charge |
|---|---|
| Nitrogen | -1.125 |
| Hydrogen | 0.375 |
Ammonia Borane
B3LYP/6-21G level
Optimisation log file here
| Summary Data | Convergence | Jmol | |||
|---|---|---|---|---|---|
 |
 |
|
Frequency file here
| Summary Data | Low Modes |
|---|---|
 |

|
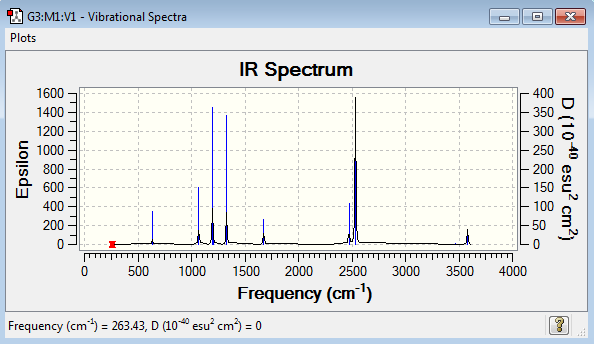
Vibrational spectrum for NH3BH3
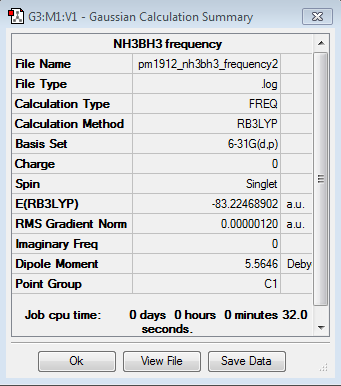
| Wavenumber (cm-1) | Intensity | IR Active? | Type |
|---|---|---|---|
| 263 | 0 | no | bend |
| 633 | 14 | very slight | stretch |
| 638 | 4 | very slight | bend |
| 638 | 4 | very slight | bend |
| 1069 | 41 | yes | bend |
| 1069 | 41 | yes | bend |
| 1196 | 109 | yes | bend |
| 1204 | 3 | very slight | bend |
| 1204 | 3 | very slight | bend |
| 1329 | 114 | yes | bend |
| 1676 | 28 | slight | bend |
| 1676 | 28 | slight | bend |
| 2472 | 67 | yes | stretch |
| 2532 | 231 | yes | stretch |
| 2532 | 231 | yes | stretch |
| 3464 | 3 | very slight | stretch |
| 3581 | 28 | slight | stretch |
| 3581 | 28 | slight | stretch |
Molecule Energies
| Molecule | Energy (AU) |
|---|---|
| NH3 | -56.5577687 |
| BH3 | -26.6153236 |
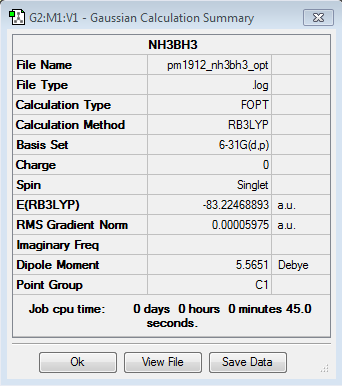
| NH3BH3 | -83.2246889 |
Dissociation Energy (AU) = ΔE=E(NH3BH3)-[E(NH3)+E(BH3)]
ΔE = -83.2246889 -[-56.5577687 + -26.6153236] = -0.0515966 AU
Dissociation Energy (KJmol-1) = ΔE(AU)x2625.50
ΔE = -0.04 x 2625.50 = -135.47 KJmol-1
| Atomic Units | 0.0515966 |
| KJmol-1 | 135.47 |
The strength of this bond (135.47 KJmol-1) is around the same level a the iodine example (151 KJmol-1) mentioned earlier. This indicates that the association of the NH3 and BH3 molecules has a weak covalent bond strength similar to that of I2. This means the N-B bond is fairly weak on the intramolecular bonding level, but it is a lot stronger than any intermolecular bonds.
Project Section
Benzene
B3LYP/6-21G level
Optimisation log file here
| Summary Data | Convergence | Jmol | |||
|---|---|---|---|---|---|
 |
 |
|
Frequency file here
| Summary Data | Low Modes |
|---|---|
 |

|
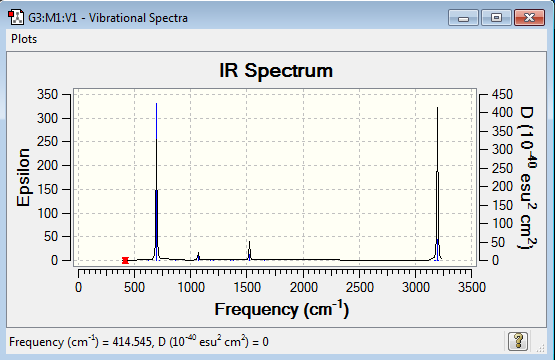
Vibrational spectrum for Benzene
| Wavenumber (cm-1) | Intensity | IR Active? | Type |
|---|---|---|---|
| 415 | 0 | no | bend |
| 415 | 0 | no | bend |
| 621 | 0 | no | bend |
| 621 | 0 | no | bend |
| 695 | 74 | yes | bend |
| 718 | 0 | no | bend |
| 865 | 0 | no | bend |
| 865 | 0 | no | bend |
| 975 | 0 | no | bend |
| 975 | 0 | no | bend |
| 1013 | 0 | no | bend |
| 1018 | 0 | no | bend |
| 1020 | 0 | no | stretch |
| 1066 | 3 | very slight | bend |
| 1066 | 3 | very slight | bend |
| 1180 | 0 | no | bend |
| 1203 | 0 | no | bend |
| 1203 | 0 | no | bend |
| 1355 | 0 | no | stretch |
| 1381 | 0 | no | bend |
| 1524 | 7 | very slight | stretch |
| 1524 | 7 | very slight | stretch |
| 1653 | 0 | no | stretch |
| 1653 | 0 | no | stretch |
| 3172 | 0 | no | stretch |
| 3181 | 0 | no | stretch |
| 3181 | 0 | no | stretch |
| 3197 | 47 | yes | stretch |
| 3197 | 47 | yes | stretch |
| 3208 | 0 | no | stretch |
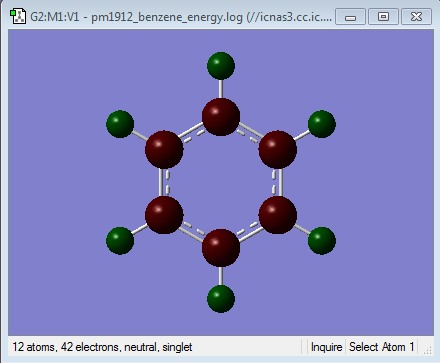
NBO Analysis
Population file DOI:10042/98246
| Charge Distribution | Charge Range | Charge Values |
|---|---|---|
 |
 |
|
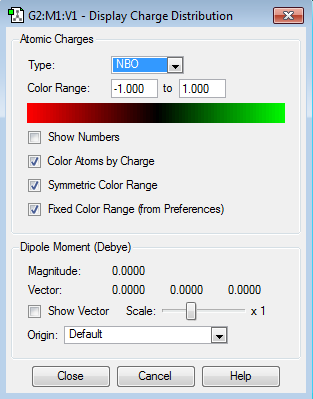
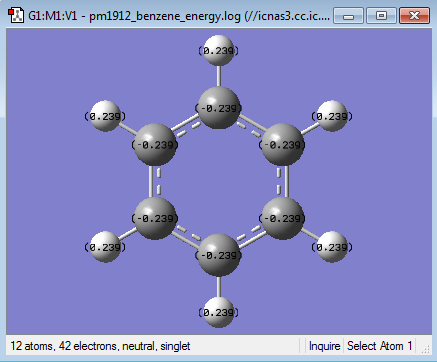
| Atom | Charge |
|---|---|
| Carbon | -0.239 |
| Hydrogen | 0.239 |
MO diagram
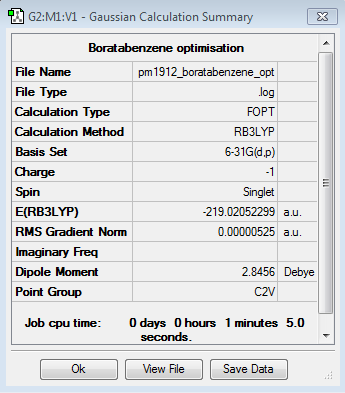
Boratabenzene
B3LYP/6-21G level
Optimisation log file here
| Summary Data | Convergence | Jmol | |||
|---|---|---|---|---|---|
 |
 |
|
Frequency file here
| Summary Data | Low Modes |
|---|---|
 |

|
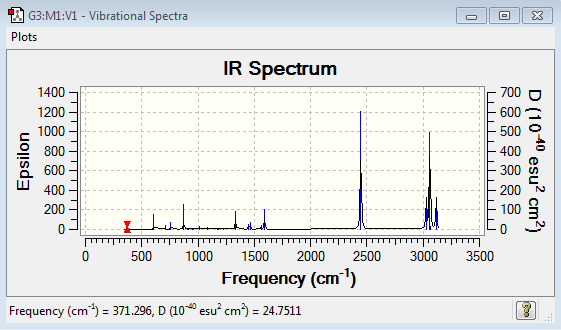
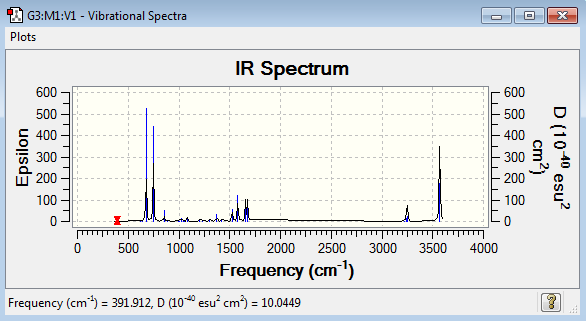
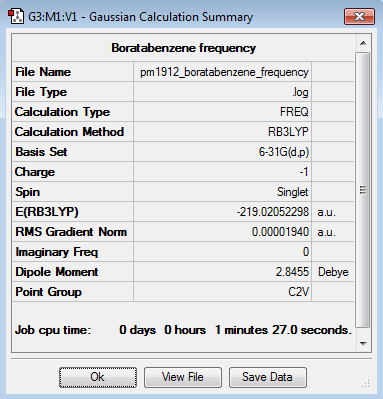
Vibrational spectrum for Boratabenzene
| Wavenumber (cm-1) | Intensity | IR Active? | Type |
|---|---|---|---|
| 371 | 2 | very slight | bend |
| 404 | 0 | no | bend |
| 565 | 0 | no | bend |
| 568 | 0 | no | bend |
| 608 | 11 | slight | bend |
| 711 | 3 | very slight | bend |
| 756 | 7 | very slight | bend |
| 815 | 0 | no | bend |
| 874 | 28 | yes | bend |
| 906 | 0 | no | stretch |
| 917 | 1 | no | bend |
| 951 | 0 | no | bend |
| 951 | 0 | no | bend |
| 961 | 2 | very slight | bend |
| 1012 | 4 | very slight | stretch |
| 1085 | 3 | very slight | bend |
| 1175 | 1 | no | bend |
| 1180 | 1 | no | bend |
| 1228 | 1 | no | stretch |
| 1333 | 31 | yes | stretch |
| 1449 | 9 | very slight | bend |
| 1463 | 14 | slight | bend |
| 1565 | 7 | very slight | stretch |
| 1592 | 40 | yes | stretch |
| 2447 | 368 | yes | stretch |
| 3027 | 108 | yes | stretch |
| 3029 | 0 | no | stretch |
| 3060 | 380 | yes | stretch |
| 3061 | 11 | slight | stretch |
| 3116 | 112 | yes | stretch |
NBO Analysis
Population file DOI:10042/98367
| Charge Distribution | Charge Range | Charge Values |
|---|---|---|
 |
 |

|
Pyridinium
B3LYP/6-21G level
Optimisation log file here
| Summary Data | Convergence | Jmol | |||
|---|---|---|---|---|---|
 |
 |
|
Frequency file here
| Summary Data | Low Modes |
|---|---|
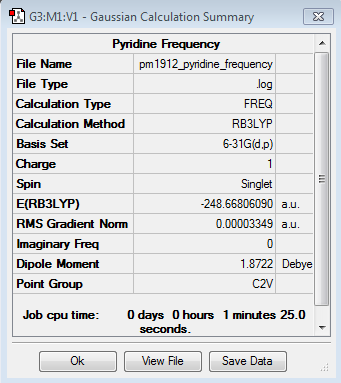 |

|
Vibrational spectrum for Pyridinium
| Wavenumber (cm-1) | Intensity | IR Active? | Type |
|---|---|---|---|
| 392 | 1 | no | bend |
| 404 | 0 | no | bend |
| 620 | 0 | no | bend |
| 645 | 0 | no | bend |
| 677 | 90 | yes | bend |
| 748 | 82 | yes | bend |
| 845 | 11 | slight | bend |
| 883 | 0 | no | bend |
| 992 | 2 | very slight | bend |
| 1006 | 0 | no | bend |
| 1022 | 4 | very slight | stretch |
| 1048 | 0 | no | bend |
| 1052 | 0 | no | bend |
| 1082 | 3 | very slight | bend |
| 1087 | 4 | very slight | bend |
| 1200 | 3 | very slight | bend |
| 1229 | 2 | very slight | bend |
| 1300 | 3 | very slight | bend |
| 1374 | 11 | slight | stretch |
| 1416 | 3 | very slight | bend |
| 1524 | 21 | yes | stretch |
| 1580 | 48 | yes | stretch |
| 1657 | 32 | yes | stretch |
| 1677 | 34 | yes | stretch |
| 3224 | 0 | no | stretch |
| 3240 | 1 | no | stretch |
| 3242 | 11 | slight | stretch |
| 3252 | 20 | yes | stretch |
| 3254 | 0 | no | stretch |
| 3570 | 158 | yes | stretch |
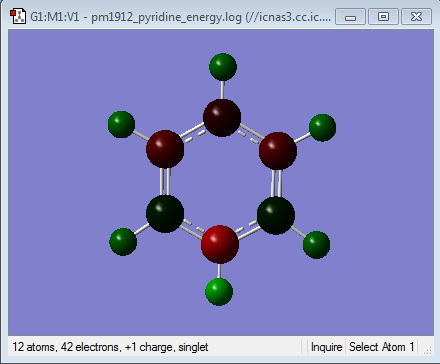
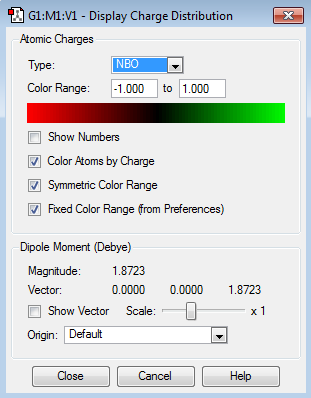
NBO Analysis
Population file DOI:10042/98705
| Charge Distribution | Charge Range | Charge Values |
|---|---|---|
 |
 |

|
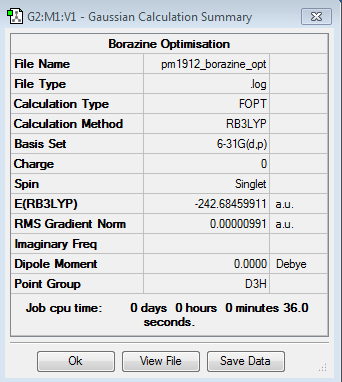
Borazine
B3LYP/6-21G level
Optimisation log file here
| Summary Data | Convergence | Jmol | |||
|---|---|---|---|---|---|
 |
 |
|
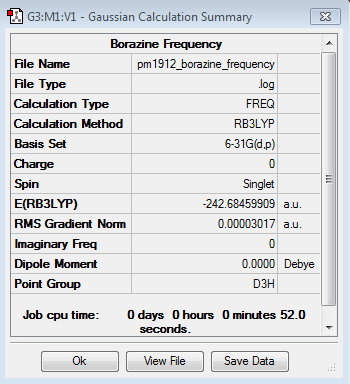
Frequency file here
| Summary Data | Low Modes |
|---|---|
 |

|
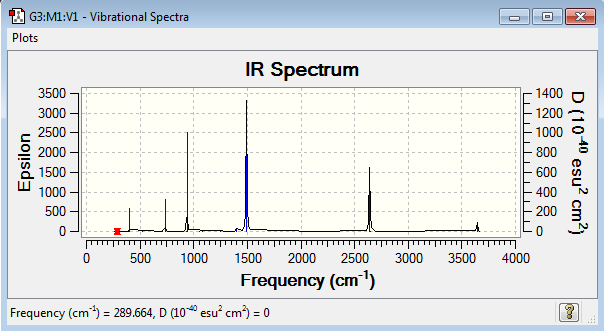
Vibrational spectrum for Borazine
| Wavenumber (cm-1) | Intensity | IR Active? | Type |
|---|---|---|---|
| 290 | 0 | no | bend |
| 290 | 0 | no | bend |
| 404 | 24 | yes | bend |
| 525 | 1 | no | bend |
| 525 | 1 | no | bend |
| 710 | 0 | no | bend |
| 710 | 0 | no | bend |
| 732 | 60 | yes | bend |
| 865 | 0 | no | bend |
| 928 | 0 | no | bend |
| 928 | 0 | no | bend |
| 937 | 236 | yes | bend |
| 945 | 0 | no | bend |
| 945 | 0 | no | bend |
| 945 | 0 | no | bend |
| 1052 | 0 | no | bend |
| 1081 | 0 | no | bend |
| 1081 | 0 | no | bend |
| 1246 | 0 | no | stretch |
| 1314 | 0 | no | stretch |
| 1400 | 11 | slight | bend |
| 1400 | 11 | slight | bend |
| 1493 | 494 | yes | bend |
| 1493 | 494 | yes | bend |
| 2641 | 284 | yes | stretch |
| 2641 | 284 | yes | stretch |
| 2650 | 0 | no | stretch |
| 3642 | 0 | no | stretch |
| 3644 | 40 | yes | stretch |
| 3644 | 40 | yes | stretch |
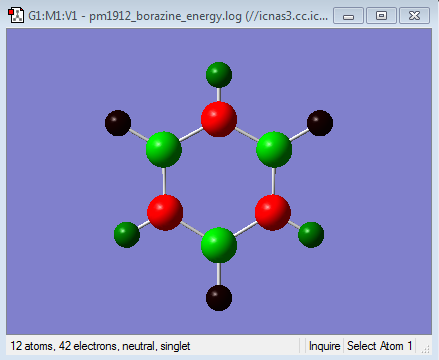
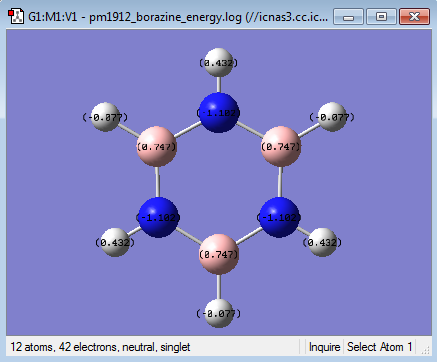
NBO Analysis
Population file DOI:10042/98926
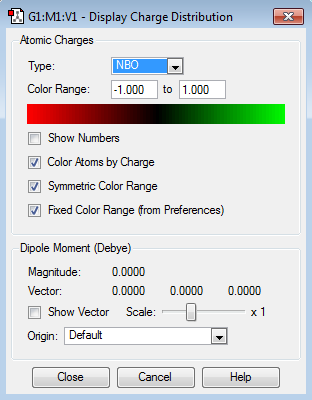
| Charge Distribution | Charge Range | Charge Values |
|---|---|---|
 |
 |
|

