User:Ns3012
EX3 Section
OPTIMISATIONS
Borane
B3LYP/3-21G Level
Optimisation file can be found here
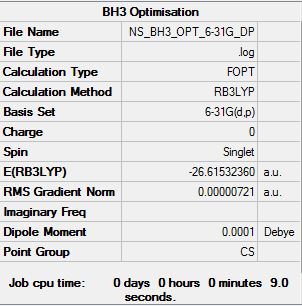
B3LYP/6-31G (d,p) Level
Optimisation file can be found here
| Summary Data | Convergence | Snapshot | Jmol | |||
|---|---|---|---|---|---|---|
|
Item Value Threshold Converged? Maximum Force 0.000012 0.000450 YES RMS Force 0.000008 0.000300 YES Maximum Displacement 0.000064 0.001800 YES RMS Displacement 0.000039 0.001200 YES |
|
|
Gallium Tribromide
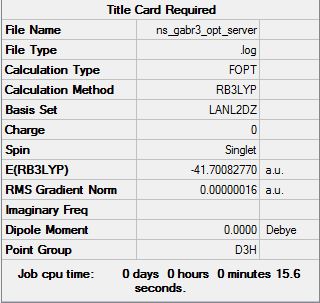
B3LYP/LANL2DZ Level
Optimisation file can be found here: DOI:10042/31123
| Summary Data | Convergence | Snapshot | Jmol | |||
|---|---|---|---|---|---|---|
|
Item Value Threshold Converged? Maximum Force 0.000000 0.000450 YES RMS Force 0.000000 0.000300 YES Maximum Displacement 0.000003 0.001800 YES RMS Displacement 0.000002 0.001200 YES |
|
|
Boron Tribromide
Optimisation file can be found here: DOI:10042/31124
| Summary Data | Convergence | Snapshot | Jmol | |||
|---|---|---|---|---|---|---|

|
Item Value Threshold Converged? Maximum Force 0.000013 0.000450 YES RMS Force 0.000008 0.000300 YES Maximum Displacement 0.000061 0.001800 YES RMS Displacement 0.000036 0.001200 YES |
|
|
Is the symmetry correct for this molecule? No. It is expected that the molecule should have D3h symmetry but due to changes in the coordinate axes, the symmetry is lowered to Cs. The calculation is redone with the symmetry constrained to D3h.
Optimisation file can be found here: DOI:10042/31157
| Summary Data | Convergence | Snapshot | Jmol | |||
|---|---|---|---|---|---|---|

|
Item Value Threshold Converged? Maximum Force 0.000008 0.000450 YES RMS Force 0.000005 0.000300 YES Maximum Displacement 0.000035 0.001800 YES RMS Displacement 0.000023 0.001200 YES |
|
|
Geometry Data
| Parameter | BH3 | BBr3 | GaBr3 |
|---|---|---|---|
| r(E-X)/Å | 1.19 | 1.93 | 2.35 |
| θ(X-E-X)/º | 120.0 | 120.0 | 120.0 |
Analysis
Compare and contrast the data you have obtained. Your analysis should be 2-3 paragraphs long. Some leading questions you should consider are:
   What difference does changing the ligand have?
   How are H and Br similar, how are they different?
   What difference does changing the central element make?
   How are B and Ga similar, how are they different?
From the optimisations, the bond lengths and bond angles obtained can be used to infer the effects of changing the central atom or ligands. For the three molecules, the bond angle remains at 120° implying that neither changing the ligand or central atom has much effect on bond angle. However, notable changes in bond length suggests that as larger atoms are introduced there is an increase in bond length. Comparing covalent radii of the atoms, we see that bromine(114pm) is two times larger than hydrogen (37pm)and a 62% increase in bond length between BH3 and BBr3 is observed. (Reference: http://periodictable.com/Properties/A/CovalentRadius.an.html) While the B-Br bond length is visibly larger, it is not as large as expected because electronegativity differences between the atoms means that greater force of attraction is exerted between boron and bromine, which shortens the bond. Comparing electronegativities, we see no significant difference between boron(2.0) and hydrogen (2.1) and hence there is not much ionic contribution to the B-X bond as there is in the BBr3 molecule. Bromine(2.8) is more electronegative than boron(2.0) which suggests that it would hold on to its electrons more rather than donate them to the electron deficient boron atom.(Reference: http://www.thecatalyst.org/electabl.html). In fact, the bromine atoms would seek to pull electrons towards themselves and polarise the sigma bond between the boron and bromine. However since the valence shell electrons of bromine are further away from and shielded from the nucleus by core electrons, the valence electrons are more polarisable and each bromine atom is able to partially donate electrons from its p orbitals into the empty p orbital(which has the same symmetry as the Br p orbitals) of the sp2 hybridised boron to quench the electron deficiency. This pi stabilisation and electronegativity difference accounts for a substantial ionic contribution to the B-Br bond which would shorten the bond from what would be expected if only covalent model contributed to the bonding.
A similar effect on bond angle and length is seen by substitution of the central atom. The bond angles remain the same at 120° but the covalent radius of gallium (126pm) is 53% larger than boron (82pm). A 22% increase in bond length is observed, which again is less than the expected increase based on purely covalent modelling. Comparing electronegativities, gallium(1.6) is more electropositive than boron (2.0); the greater difference in electronegativity between the central atom and the bromine leads to a greater ionic contribution as the soft bromide relieves the electron deficiency of the gallium centre. Additionally, both gallium and bromine are in the same period (Period 4) and the valence orbitals would be of similar size which leads to greater overlap and stronger(shorter) bonds. Boron which belongs to period 2 would have more contracted orbitals, which would not overlap as efficiently as the gallium's more diffuse orbitals. Gallium is already smaller than expected because of the d block contraction, which means that valence electrons will still experience a significant pull from the nucleus and so gallium is electron deficient like boron and will readily accept the contributions of electron density from the bromines. However pi stabilisation will decrease as bond length increases.
In addition answer the following in your questions on your wiki (your reply should be 2-3 paragraphs in length)
   What is a bond?
   How much energy is there in a strong, medium and weak bond? Give examples of each type of bond (strong, medium and weak)
   In some structures gaussview does not draw in the bonds where we expect, why does this NOT mean there is no bond?
A covalent bond is most commonly denoted by the use of a line between two atoms, but what exactly does this line represent? It is a model to indicate what we think is occuring at the atomic level and what our experimental(principally spectroscopic) techniques have shown us are the interactions between atoms. Most definitely there aren't little lines floating around connecting atoms at the microscopic level! Simplistically, a bond represents an electronic (charge) connection between atoms that are energetically inclined to share electrons in order to achieve a stable electronic configuration (stability of a configuration depends on which section of the periodic table that the atoms constituting a bond belong to). More than this, since atoms are not stationary, a bond represents the system in dynamic equilibrium of charge that mobile subatomic particles will preferentially exist in. That is to say, the kinetic motion of protons, neutrons and electrons is taken into account and electrons are permitted to move in certain regions around a pair of bonded atoms in such a way that there is a compromise among the forces between the bonded atoms: the attractive force of both nuclei to the electrons, the repulsive force between both nuclei and the repulsive force between electrons. The regions of high probability around a pair of bonded atoms in which electrons are said to inhabit are called orbitals. The electrons generally inhabit orbitals (both bonding and antibonding) that have the overall net effect of holding the two bonded atoms together, due to the inherent favorability of the bonding process which is exothermic (hence energetically favourable as molecules move to lower energy states).
Bond strength is dependent on how much energy is required to put into a bond to cause dissociation, leading to classification of bonds as weak or strong. Bond strength is directly related to bond order, bond energy and bond length. Bond order typically has a value between 1 and 3 whereas bond lengths and bond energies have a wide spectrum of values. Also, intermolecular bonding interactions such as hydrogen bonding and dispersion forces are weaker than intramolecular bonding interactions (electrovalent, covalent or metallic); they are usually not more than 20kJ/mol and hence are weak bonds whereas intramolecular bonds are strong because they are upwards of 100kJ/mol, up to as far as 4000kJ/mol . Discrete molecules have weaker bond energies than structures with giant molecular structures or crystal lattices. We can compare the values for certain molecules to get an idea of their strength. The weakest covalent bond is the O-O single bond (145kJ/mol) and the strongest bond is the N-N triple bond (945kJ/mol). An average covalent bond would have a bond energy of around 350 to 450 kJ/mol such as a C-H single bond (414kJ/mol) or Si-Cl single bond (376kJ/mol).
Structural optimisations run on computational chemistry programmes give the equilibrium structure of a molecule. A number of approximations are used in order to circumvent a number of calculational impasses of quantum mechanics(e.g. Born-Oppenheimer approximation etc.) and so the accuracy of the model generated depends on the basis sets used (e.g. 3.21G vs 6.31G), whether a pseudopotential is used to reduce the size of the basis set by replacing non-valence electrons and nuclear charge with an effective core potential and on the computational method (e.g. DFT vs. Hartree-Fok) used . The use of all these approximations determines the limits of the programme in recognising the presence of a bond between atoms. Thus, the non-indication of a bond between atoms in Gaussview does not necessarily mean that bonding interactions (or even a bond) is not present. Bonds will not be shown if the predetermined distance between atoms is exceeded such as in cases where there are very weak bonds or ad hoc additions to bonding theory such as three centre - two electron bonds.
FREQUENCY CALCULATIONS
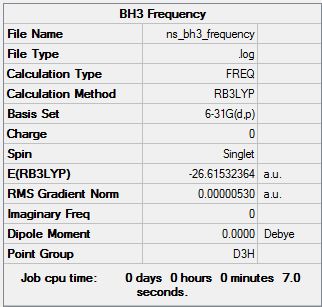
Borane Frequency Analysis at the B3LYP/6-31G(d,p) Level
Frequency calculation file can be found here
| Summary Data | Convergence |
|---|---|
|
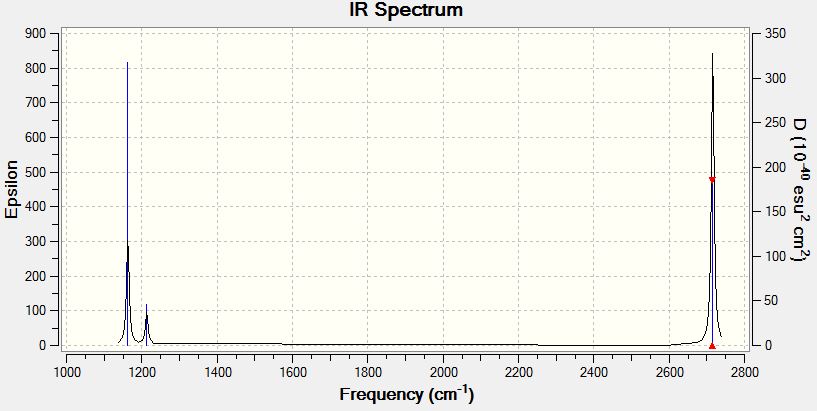
Low frequencies --- -14.5183 -14.5142 -10.8197 -0.0005 0.0169 0.3454 Low frequencies --- 1162.9508 1213.1230 1213.1232 |
Vibrational Spectrum of Borane
| Wavenumber | Intensity | IR active? | Type |
| 1163 | 93 | yes | bend |
| 1213 | 14 | slight | bend |
| 1213 | 14 | slight | bend |
| 2583 | 0 | no | stretch (symm) |
| 2716 | 126 | yes | stretch (asymm) |
| 2716 | 126 | yes | stretch |
Explain why are there less than six peaks in the spectrum, when there are obviously six vibrations.
Although there are six modes of vibration available to the borane molecule, not all of these modes will produce a peak on the vibrational spectrum of borane. As infrared radiation is of the right energy to induce vibrations in the molecule, vibrational spectroscopy is only able to recognise those that undergo a change in dipole moment upon being irradiated. The symmetric stretching mode of BH3 does not produce a change in dipole moment and therefore is not seen in the spectrum. Another reason for the reduction in the number of peaks in a spectrum that is seen in this case is that where more than one vibrational mode have degenerate energies, their peaks will coincide. The two asymmetric bending modes at 1213 coincide with each other and the two asymmetric stretches at 2716 coincide with each other. Thus from 5 potentially visible peaks, we are now only able to resolve them into 3 peaks.
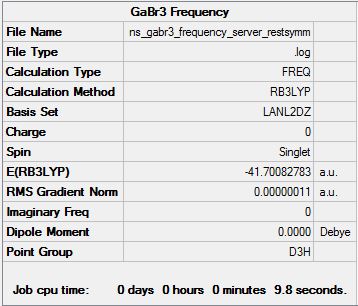
Gallium Tribromide Frequency Analysis at the B3LYP/LANL2DZ Level
Frequency calculation file can be found here
| Summary Data | Convergence |
|---|---|
|
Low frequencies --- -0.5252 -0.5247 -0.0024 -0.0010 0.0235 1.2011 Low frequencies --- 76.3744 76.3753 99.6982 |
Vibrational Spectrum of Gallium Tribromide
| Wavenumber | Intensity | IR active? | Type |
| 76 | 3 | very slight | bend |
| 76 | 3 | very slight | bend |
| 100 | 9 | very slight | bend |
| 197 | 0 | no | stretch (symm) |
| 316 | 57 | yes | stretch (asymm) |
| 316 | 57 | yes | stretch |
Analysis
Now compare and contrast the vibrational spectra for BH3, and GaBr3. (This analysis should be 2-3 paragraphs long.) Some leading questions you should consider are:
   What does the large difference in the value of the frequencies for BH3 compared to GaBr3 indicate?
   There has been a reordering of modes! This can be seen particularly in relation to the A2" umbrella motion.
   Compare the relative frequency and intensity of the umbrella motion for the two molecules.
   Looking at the displacement vectors how has the nature of the vibration changed? Why?
The same vibrational modes that are available for borane will be the same ones that are available for the gallium tribromide as they share the same trigonal planar geometry, even though neither molecule shares atoms of the same type. The principal difference will be the value of the frequencies, which is an indication of the bond energy. A similarity is noted between both spectra that although there are six available vibrational modes, only three peaks are observed in the spectrum of gallium tribromide, for the same reasons as mentioned before with borane. The vibration of a molecule is modelled after a harmonic oscillator using a quantity known as reduced mass of the molecule to transform the calculations into a single-body problem rather than a two-body problem. The following equation is used to determine frequencies ν=(1/2π)sqrt(k/µ) where ν is the vibrational frequency, µ is the reduced mass of the molecule and k is a proportionality constant known as the force constant; k is a measure of bond strength. Since frequency is directly proportional to energy (according to the equation E=hν), higher frequencies indicate stronger bonds. The reported frequencies for BH3 are within the range 1163 to 2716, whereas the gallium tribromide frequencies are within the range 76 to 316, an entire order of magnitude in difference! Looking at the frequency equation, a large frequency can be obtained by having a large value for k and a low value for µ. The reduced mass associated with a B-H stretch is 1.53 × 10⁻²⁶ kg whereas the reduced mass associated with a Ga-Br stretch is 6.18 × 10⁻²⁵ kg; there is an order of magnitude in difference. Additionally boron and hydrogen are small atoms with contracted orbitals giving short bond distances and relatively good overlap, whereas gallium and bromine are larger atoms and hence require longer bond distances and overlap will also correspondingly be less, giving lower force constants. Both these factors point to gallium bromide having weaker bonds than borane and consequently lower vibrational frequencies.
This particular vibrational mode of A2" umbrella motion has a frequency of 100 and a low intensity of 9 for gallium tribromide whereas for borane it has a much higher frequency of 1162 with a high intensity of 93. If the hard sphere model is considerd, the gallium tribromide molecule should be more flexible in space than the borane molecule due to the size of the atoms which increasing the bond length compared to borane. It should take less energy to induce bending in the gallium tribromide and hence it requires lower frequencies to excite this bending mode. Borane on the other hand is a small compact molecule with good overlap of small contracted 1s, 2s and 2p orbitals, making the bonds strong (they will have a high force constant). This means that more energy will be required to induce the bending mode. Comparing the order of this bending mode relative to the other bending modes available to these molecules, the A2" umbrella motion is the higher energy bending mode for the gallium tribromide compared to the other two degenerate bending modes whereas for the borane it is the lower energy bending mode compared to its other two degenerate bending modes. Therefore there has been a reordering of bending modes between these two molecules.
Considering the displacement vectors for borane, the hydrogens are seen to move but not the boron. For gallium tribromide, both the central gallium atom and the bromines are shown to move in opposite directions. It is possible that this difference in nature of producing the umbrella motion occurs because hydrogens are close in mass to the reduced mass of the molecule and will bear the majority of motion within the molecule. In the case of the gallium tribromide, the central atom is closer in mass to the reduced mass of the molecule and so it will bear most of the the motion within the molecule. The difference in intensities of the vibrational modes can also be explained by the nature of the motion. Since the central atom of borane is not moving, there is a large change in dipole moment. For the gallium tribromide, the central atom is moving in the opposite direction relative to the bromines and this counters the change in dipole moment produced by the movement of the bromines in one direction. Hence the intensity of the gallium tribromide motion is significantly less than the intensity of the corresponding motion in the borane.
Answer ALL of the following questions in your wiki
   Why must you use the same method and basis set for both the optimisation and frequency analysis calculations?
   What is the purpose of carrying out a frequency analysis?
   What do the "Low frequencies" represent?
Frequency calculations are carried out on the optimised structure in order to find the derivative of the structure. Incidentally this calculation is also the second derivative of the potential energy surface (PES), since the optimised structure is found by obtaining the minimum energy across the PES for the system of atoms. Frequency analysis is therefore a check to ensure that the minimum energy stationary point on the PES is obtained. Positive values for the second differential of the PES indicate a minimum, while maxima will give negative values. If maxima are obtained, then the optimisation has not produced the lowest energy conformation of the system which corresponds to a transition state. Therefore the frequency calculation has to be redone after the optimisation is repeated and completed.
In order to have comparable data for a molecular system, the same method and basis set must be used in both the structural optimisation and the frequency calculations. Failure to adhere to the same conditions for both calculations leads to differences in accuracy which render the values incompatible or incomparable with each other. In other words the same linear combination of atomic orbitals must be used and the same functions used to model the electrons must be used in order for an optimised structure to be assessed by frequency calculations.
The low frequencies data are presented in two lines. The upper line represents the values of the second derivatives of small displacements from the optimised structure on either side of the stationary point. The lower line gives the resultant calculated frequencies in wavenumbers of the actual modes that are available.
MOLECULAR ORBITALS POPULATION ANALYSIS
Borane
Answer the following questions:
   Are there any significant differences between the real and LCAO MOs?
   What does this say about the accuracy and usefulness of qualitative MO theory?
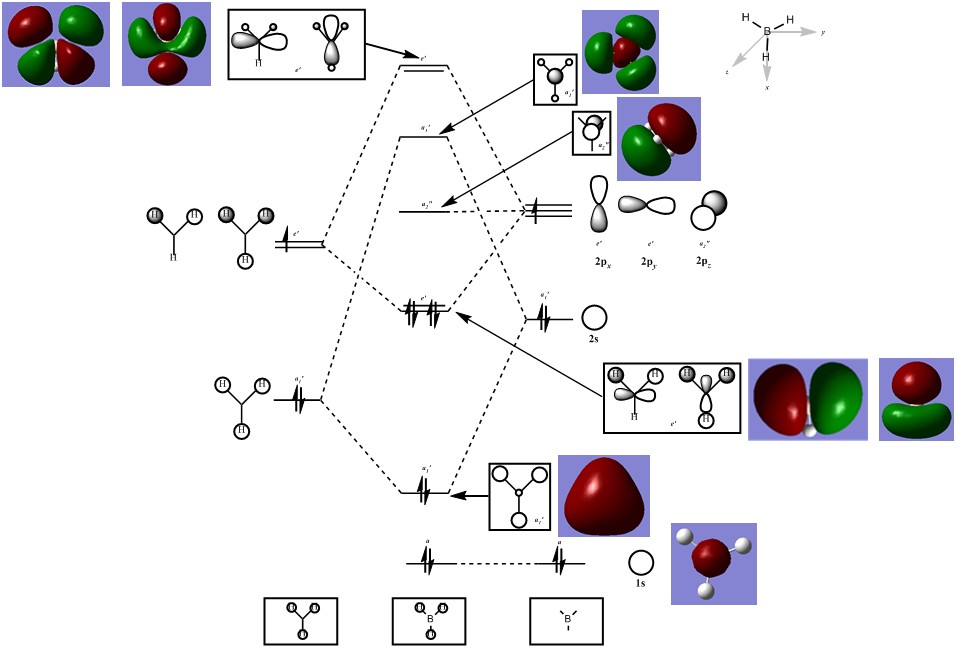
The MO diagram above takes into consideration the small difference in electronegativity between boron and hydrogen. The core MO produced from the 1s orbital of the boron is too low in energy to mix with any of the other orbitals. Mixing can begin with the 2s boron orbital and the H3 fragment orbitals which are closer in energy and of appropriate symmetries. The bonding orbitals have a greater contribution from the H3 fragment orbitals, whereas the antibonding orbitals have greater contribution from the boron atom. This difference in contribution is illustrated by the relative sizes of the constituent AOs in the resulting MO. The single non-bonding orbital results from the 2p orbital on boron that is not in the correct planar orientation for interaction with the planar H3 fragment.
LCAO orbitals, although qualititive predictions, are able to predict the shape of molecular orbitals with fair accuracy. The core orbitals of the borane molecule which are closer in shape to the contributing atomic orbitals allow the LCAO predicted orbitals to replicate the actual generated orbital shape most accurately. However as more orbitals become involved, the generated molecular orbitals combine regions of same phase that are in close proximity to each other to form a continuous surface, while the LCAO model appears to illustrate more discrete contributions from atoms or atomic fragments. When orbitals that are not occupied are generated, they are purely hypothetical surfaces and may not actually replicate reality (since they don't take form until occupied by an electron, it's slightly nonsensical to generate a shape for a "nothing particle" to inhabit)and so the accuracy of the LCAO orbitals may actually be greater for understanding and qualitatively predicting the shapes of orbitals above the HOMO. In this case, there is a significant visual correlation between the LCAO and generated orbitals both above and below the LUMO.
NATURAL BOND ORBITALS POPULATION ANALYSIS
Ammonia
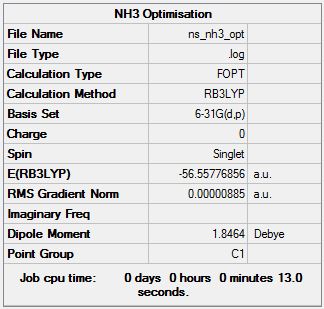
Optimisation at B3LYP/6-31G (d,p) Level
Optimisation file can be found here
| Summary Data | Convergence | Snapshot | Jmol | |||
|---|---|---|---|---|---|---|
|
Item Value Threshold Converged? Maximum Force 0.000024 0.000450 YES RMS Force 0.000012 0.000300 YES Maximum Displacement 0.000079 0.001800 YES RMS Displacement 0.000053 0.001200 YES |
|
|
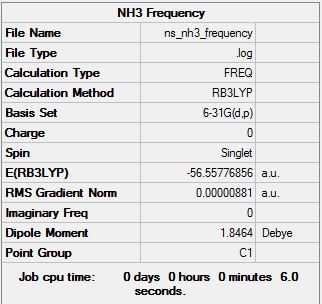
Frequency Analysis at the B3LYP/6-31G(d,p) Level
Frequency calculation file can be found here
| Summary Data | Convergence |
|---|---|
|
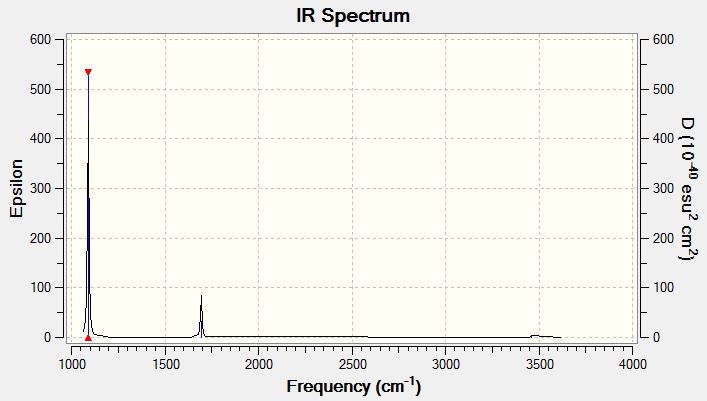
Low frequencies --- -30.7295 0.0020 0.0021 0.0021 20.1705 28.2664 Low frequencies --- 1089.5535 1694.1244 1694.1856 |
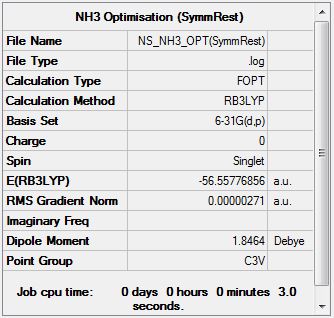
Optimisation at the B3LYP/6-31G(d,p) Level on Restricted Symmetry Molecule
Optimisation file can be found here
| Summary Data | Convergence | Snapshot | Jmol | |||
|---|---|---|---|---|---|---|
|
         Item               Value     Threshold  Converged?
 Maximum Force            0.000004     0.000450     YES
 RMS     Force            0.000002     0.000300     YES
 Maximum Displacement     0.000014     0.001800     YES
 RMS     Displacement     0.000010     0.001200     YES
|
|
|
Frequency Analysis at the B3LYP/6-31G(d,p) Level on Restricted Symmetry Molecule
Frequency calculation file can be found here
| Summary Data | Convergence |
|---|---|

|
Low frequencies --- -6.9474 -5.5357 -5.5349 0.0020 0.0046 0.0145 Low frequencies --- 1089.3522 1693.9258 1693.9258 |
Vibrational Spectrum of Ammonia
| Wavenumber | Intensity | IR active? | Type |
| 1089 | 145 | yes | bend |
| 1693 | 14 | slight | bend |
| 1694 | 14 | slight | bend |
| 3461 | 1 | no | stretch (symm) |
| 3590 | 0 | no | stretch (asymm) |
| 3590 | 0 | no | stretch |
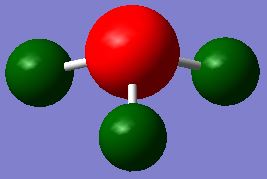
Charge Distribution of Ammonia
ASSOCIATION ENERGIES OF BORANE AND AMMONIA
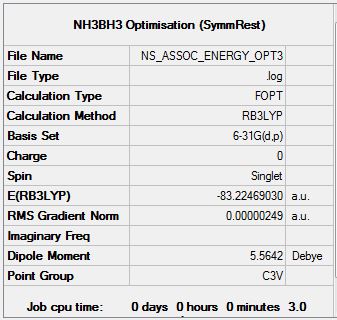
Optimisation of Ammonia-Borane Complex at 6.31G (d,p) Level
Optimisation file can be found here
| Summary Data | Convergence | Snapshot | Jmol | |||
|---|---|---|---|---|---|---|
|
Item Value Threshold Converged? Maximum Force 0.000005 0.000015 YES RMS Force 0.000002 0.000010 YES Maximum Displacement 0.000031 0.000060 YES RMS Displacement 0.000011 0.000040 YES |
|
|
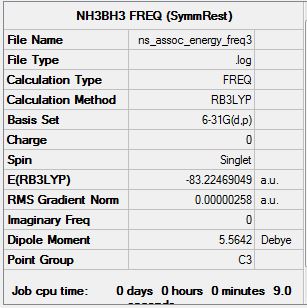
Frequency Analysis of Ammonia-Borane Complex at 6.31G (d,p) Level
Frequency calculation file can be found here
| Summary Data | Convergence |
|---|---|
|
Low frequencies --- -0.1359 -0.0800 -0.0074 13.4739 13.4904 14.7867 Low frequencies --- 263.4457 632.9395 639.1762 |
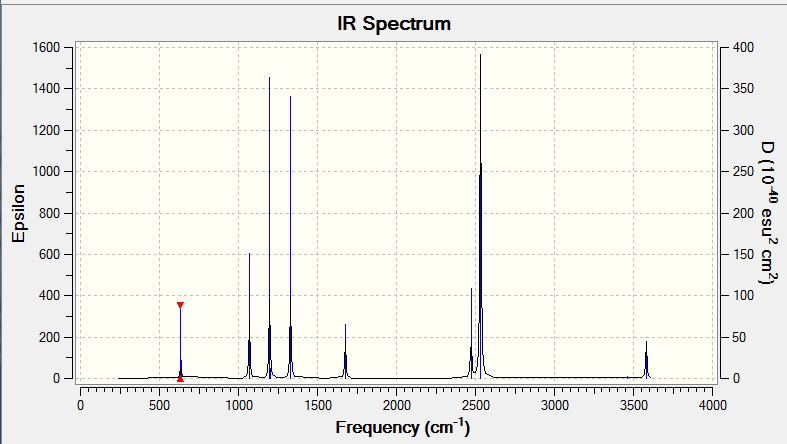
Vibrational Spectrum of Ammonia-Borane Complex
| Wavenumber | Intensity | IR active? | Type |
| 263 | 0 | no | bend |
| 633 | 14 | slight | stretch |
| 639 | 4 | very slight | bend |
| 639 | 4 | very slight | bend |
| 1069 | 41 | yes | bend |
| 1069 | 41 | yes | bend |
| 1196 | 109 | yes | bend |
| 1203 | 3 | very slight | bend |
| 1203 | 3 | very slight | bend |
| 1329 | 114 | yes | bend |
| 1676 | 28 | yes | bend |
| 1676 | 28 | yes | bend |
| 2472 | 67 | yes | stretch |
| 2532 | 231 | yes | stretch |
| 2532 | 231 | yes | stretch |
| 3464 | 3 | very slight | stretch |
| 3581 | 28 | yes | stretch |
| 3581 | 28 | yes | stretch |
Energy Data
| Molecule | Energy/a.u. |
|---|---|
| NH3 | -56.558 |
| BH3 | -26.615 |
| NH3BH3 | -83.225 |
Dissociation energy of the ammonia-borane complex into its fragments is given by:
ΔE = E(NH3BH3) - [ E(NH3)+ E(BH3) ]
ΔE = -83.225 -[ -56.558 + -26.615] = -0.052 a.u.
Since 1a.u. = 2625.50 kJ/mol, the dissociation energy is -136.526 kJ/mol.
Analysis
With reference to your earlier discussion on the strength of bonds (weak, medium or strong) is the association of NH3 and BH3 to form a B-N bond within NH3BH3 weak, medium or strong?
Many people new to calculations can make an error at this stage. It is very important in quantum chemistry to keep asking yourself if your result is sensible. Rubbish in is rubbish out, and you may have inadvertently made a mistake somewhere. So look at your number, is it a sensible value? How do you know what a sensible value is? (Hint: this is a bond energy, so what "ballpark" value should it have?)
The B-N bond is a weak bond in the context of the previous comparisons of bond strength for covalent species. The dative bond requires two electrons to be donated from the nitrogen to the boron compared to the usual mutual contribution from both atoms in the conventional covalent bond. The electronegativity of nitrogen is 3.0 compared to the electronegativity of boron 2.0 and hence the it will tend to have a stronger hold on the electrons that it donates to the dative bond. The nitrogen will also be more reluctant to part with two of its own electrons to only form a single bond. Boron in order to relieve its electron deficiency encourages the donation from the nitrogen atom, which does the boron a favour and partially quenches its electron deficiency. The resulting dative covalent bond has roughly the same strength as the weak O-O single covalent bond (which is relatively strong for an intermolecular bond). This means that the complex can be readily dissociative/reactive and can release the stable borane and ammonia in a reaction without too much energy input.
Project Section
Group 3 halides contain an electron deficient central atom and electron rich 'ligands'. This polar distribution of charge in the molecule makes intermolecular interactions highly favorable. Indeed these molecules tend to dimerise by forming bridging halide bonds, with the exception of boron halides. A halide atom of one monomer datively coordinates to the electron deficient group 3 centre on another molecule forming one bridge and a halide atom of the second molecule also donates into the group 3 centre of the first molecule forming a second bridge. Since both bridging interactions are dative coordinations, they are still two centre - two electron bonds that have been discussed before. Boron being so small in size is able to have its electron deficiency quenched by pi stabilisation from its halide 'ligands', an option viable enough for the small boron due to its short bond lengths and compact orbitals overlapping well enough with the halides valence orbitals. Thus, boron halides are likely to remain monomers. The distance dependent pi stabilisation is not a viable option to quench the electron deficiency of the larger members of Group 3 and hence they must dimerise. A computational investigation will be done on the possible isomers of Al2Cl4Br2 in order to determine the favorability of dimerisation into particular isomers.
Optimisation of Isomers of Al2Cl4Br2
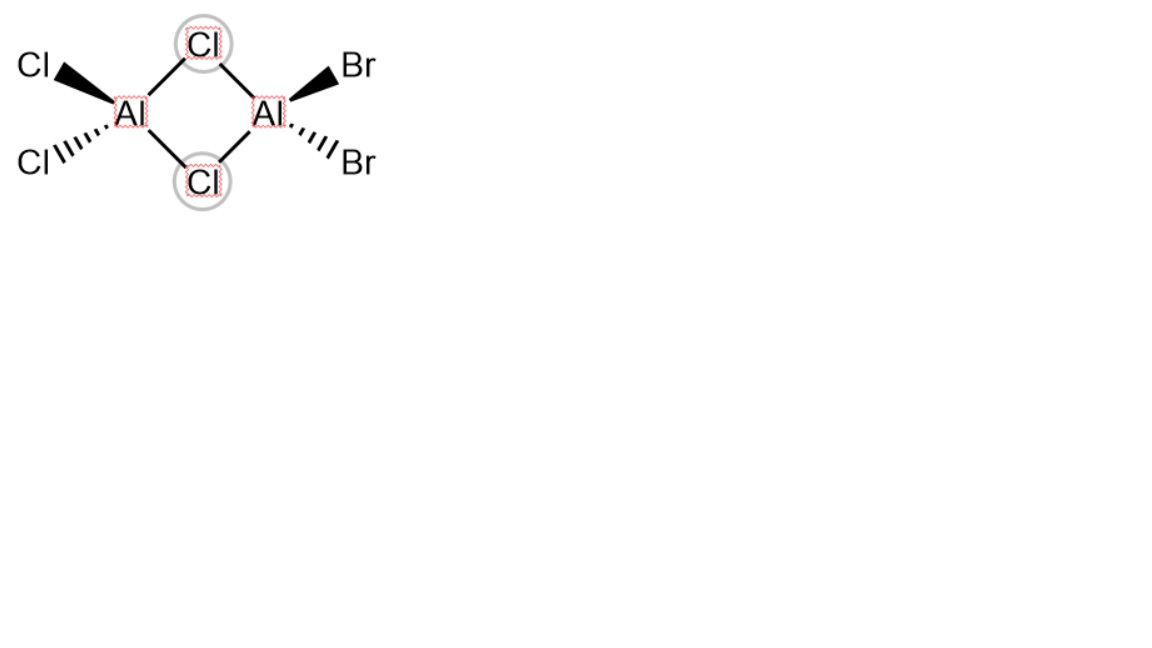
Firstly, all possible isomers are worked out and structural optimisation is carried out on each one. For the sake of this discussion, cis is taken to mean that atoms of the same type are on the same side of a plane perpendicular to them which runs through the aluminium centres and their bridges, trans is taken to mean that atoms of the same type are on opposite sides of this plane and geminal is taken to mean that atoms of the same type are connected to the same aluminium centre.
Four isomers can be formed by direct coordination and a fifth can result from a dynamic equilibrium process of a previously dimerised species allowing the bromine atoms to be geminal. The symmetry of each isomer was determined and imposed before the optimisation of each isomer.
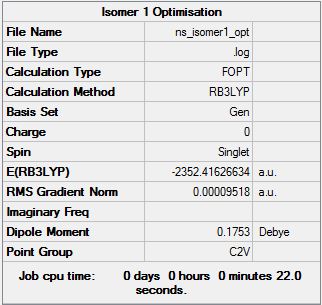
Isomer 1
Optimisation file can be found here
| Summary Data | Convergence | Snapshot | Jmol | |||
|---|---|---|---|---|---|---|
|
Item Value Threshold Converged? Maximum Force 0.000161 0.000450 YES RMS Force 0.000061 0.000300 YES Maximum Displacement 0.001433 0.001800 YES RMS Displacement 0.000442 0.001200 YES |
|
|
Isomer 2
Optimisation file can be found here
| Summary Data | Convergence | Snapshot | Jmol | |||
|---|---|---|---|---|---|---|

|
Item Value Threshold Converged? Maximum Force 0.000159 0.000450 YES RMS Force 0.000060 0.000300 YES Maximum Displacement 0.001424 0.001800 YES RMS Displacement 0.000433 0.001200 YES |
|
|
Isomer 3
Optimisation file can be found here
| Summary Data | Convergence | Snapshot | Jmol | |||
|---|---|---|---|---|---|---|

|
Item Value Threshold Converged? Maximum Force 0.000188 0.000450 YES RMS Force 0.000069 0.000300 YES Maximum Displacement 0.001515 0.001800 YES RMS Displacement 0.000536 0.001200 YES |
|
|
Isomer 4
Optimisation file can be found here
| Summary Data | Convergence | Snapshot | Jmol | |||
|---|---|---|---|---|---|---|

|
Item Value Threshold Converged? Maximum Force 0.000139 0.000450 YES RMS Force 0.000045 0.000300 YES Maximum Displacement 0.001308 0.001800 YES RMS Displacement 0.000483 0.001200 YES |
|
|
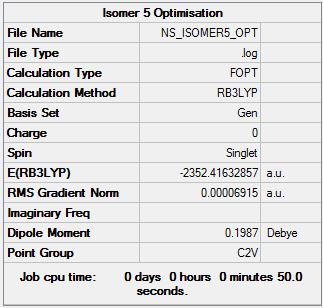
Isomer 5
Optimisation file can be found here
| Summary Data | Convergence | Snapshot | Jmol | |||
|---|---|---|---|---|---|---|
|
Item Value Threshold Converged? Maximum Force 0.000150 0.000450 YES RMS Force 0.000054 0.000300 YES Maximum Displacement 0.001116 0.001800 YES RMS Displacement 0.000314 0.001200 YES |
|
|
Energy Data
| Isomer | Point Group | Energy/a.u. | Relative Energy/kJ/mol. |
|---|---|---|---|
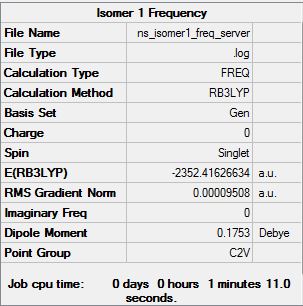
| 1 | C2v | -2352.416266 | 0.17 |
| 2 | C2h | -2352.416316 | 0.03 |
| 3 | D2h | -2352.406307 | 26.31 |
| 4 | C1 | -2352.411099 | 13.73 |
| 5 | C2v | -2352.416329 | Lowest energy |
Discuss the position of the Br atoms with respect to the stability of the different conformers.
The calculations have indicated the following order of increasing isomer energy: Isomer 5 < Isomer 2 < Isomer 1 < Isomer 4 < Isomer 3. It appears that the position of the bromine atoms affects the stability of the isomers. The geminal bromine isomer is the lowest energy isomer, followed by the trans bromine isomer, then the cis bromine isomer. These three isomers are within such close range of each other in terms of energy that when the errors of the computational method are considered, they can effectively be treated as energetically degenerate isomers. A significant jump in energy (at least on the order of conformational differences) is observed when moving from terminal bromine atoms to bridging bromine atoms. The single-bromine-bridged isomer jumps from the degenerate terminal-bromine isomers by 13kJ/mol and this jump is doubled when moving to the double-bromine-bridged isomer showing a proportional increase in relative energy to the number of bridging bromines. This indicates that chlorine bridges are more likely to form as chlorine is better at holding the dimer together. This is likely to be due to chlorine's smaller size which keeps the monomers closer together in a stable dimer(shorter bond lengths means stronger bridging bonds which means more stable isomer). Even though bromine is larger and hence its valence orbitals more diffuse, the expected stability due to ease of donation of a lone pair to the group 3 centre on the other monomer is countered by the bond length and lesser orbital overlap when compared with Al-Cl(which are both Period 3 atoms). Indeed all Al-Cl bonds are shorter than all Al-Br bonds in the isomers making isomers 2 and 3 the most highly symmetric isomers with respect to bond lengths.
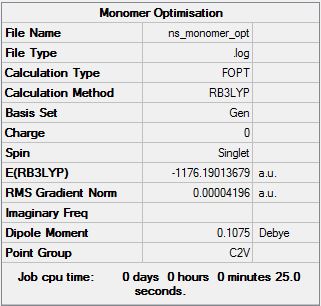
AlCl2Br Monomer
Optimisation file can be found here
| Summary Data | Convergence | Snapshot | Jmol | |||
|---|---|---|---|---|---|---|
|
Item Value Threshold Converged? Maximum Force 0.000136 0.000450 YES RMS Force 0.000073 0.000300 YES Maximum Displacement 0.000760 0.001800 YES RMS Displacement 0.000497 0.001200 YES |
|
|
Dimer to Monomer Dissociation Energy
Dissociation energy of the lowest energy conformer into the monomer is given by:
ΔE = E(Isomer 5)- 2[E(Monomer)]
ΔE = -2352.416329 - 2[-1176.190137] = -0.036 a.u.
Since 1a.u. = 2625.50 kJ/mol, the dissociation energy is -94.662kJ/mol.
Is the product more or less stable than the isolated monomers?
Bond formation is exothermic and this release of energy allows a system to move to an energetically more stable state. Therefore, since energy is released upon formation of the dimer, the dimer is stabler than the isolated monomers. As stated before Isomer 5 can be considered to be degenerate in terms of energy with Isomers 1 and 2 since their energies are so similar and the accuracy of the computations is not high enough to resolve energy differences reliably enough within 5kJ/mol.Therefore, isomers 1 and 2 can both be cleaved into identical Al2Cl4Br2 monomers. The dynamic equilibrium product can be dissociated into identical monomers or dissimilar fragments. For the purposes of comparison of identical monomers, the dissimilar fragmentation option of Isomer 5 will be ignored.
Frequency Analysis of Isomers of Al2Cl4Br2
Following optimisation of structures for the isomers, it is necessary to ensure that no transition structures are obtained from the optimisations. This is done as before with frequency calculations ensuring that the low frequencies are within ± 15.
Isomer 1
| Summary Data | Convergence |
|---|---|
|
Low frequencies --- -5.4666 -3.3461 -0.9690 0.0034 0.0044 0.0046 Low frequencies --- 16.9922 50.8211 78.4866 |
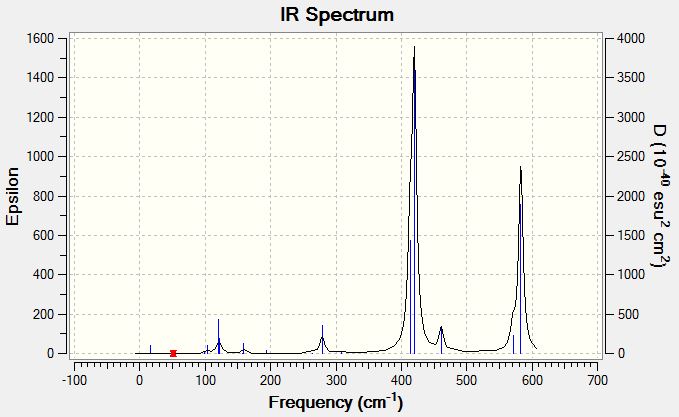
Vibrational Spectrum of Isomer 1
| Wavenumber | Intensity | IR active? | Type |
| 17 | 0 | no | bend |
| 51 | 0 | no | bend |
| 78 | 0 | no | bend |
| 99 | 0 | no | bend |
| 103 | 3 | very slight | bend |
| 120 | 13 | yes | bend |
| 123 | 6 | slight | bend |
| 157 | 0 | no | bend |
| 158 | 5 | slight | bend |
| 194 | 2 | very slight | stretch |
| 264 | 0 | no | stretch |
| 279 | 25 | yes | stretch |
| 309 | 2 | very slight | bend |
| 413 | 149 | yes | stretch |
| 420 | 411 | yes | stretch |
| 461 | 35 | yes | stretch |
| 571 | 33 | yes | stretch |
| 583 | 277 | yes | stretch |
Isomer 2
| Summary Data | Convergence |
|---|---|

|
Low frequencies --- -3.1381 -0.0041 -0.0037 -0.0020 1.2415 3.1616 Low frequencies --- 17.9393 49.0698 72.9178 |
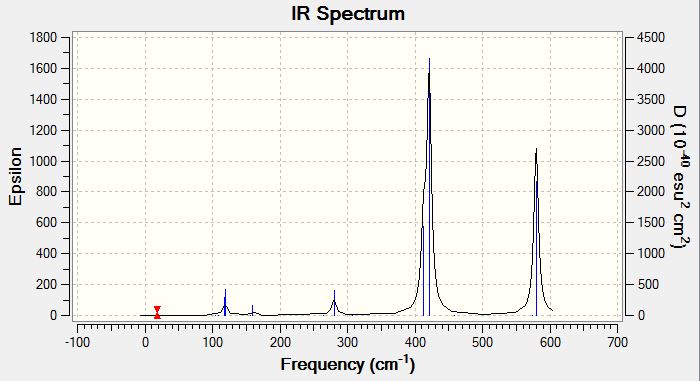
Vibrational Spectrum of Isomer 2
| Wavenumber | Intensity | IR active? | Type |
| 18 | 0 | no | bend |
| 49 | 0 | no | bend |
| 73 | 0 | no | bend |
| 105 | 0 | no | bend |
| 109 | 0 | no | bend |
| 117 | 9 | yes | bend |
| 120 | 13 | yes | bend |
| 157 | 0 | no | bend |
| 160 | 6 | slight | bend |
| 192 | 0 | no | stretch |
| 264 | 0 | no | stretch |
| 280 | 29 | yes | stretch |
| 308 | 0 | no | bend |
| 413 | 149 | yes | stretch |
| 421 | 439 | yes | stretch |
| 459 | 0 | no | stretch |
| 575 | 0 | no | stretch |
| 580 | 316 | yes | stretch |
Isomer 3
| Summary Data | Convergence |
|---|---|
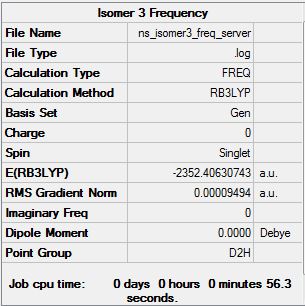
|
Low frequencies --- -6.5060 -6.4303 -3.9905 -0.0032 -0.0032 -0.0021 Low frequencies --- 13.9918 63.0861 86.0741 |
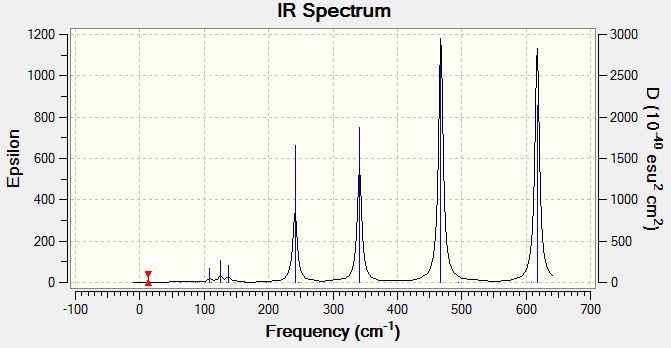
Vibrational Spectrum of Isomer 3
| Wavenumber | Intensity | IR active? | Type |
| 14 | 0 | no | bend |
| 63 | 0 | no | bend |
| 86 | 0 | no | bend |
| 87 | 0 | no | bend |
| 107 | 5 | slight | bend |
| 111 | 0 | no | bend |
| 126 | 8 | yes | bend |
| 135 | 0 | no | bend |
| 138 | 7 | yes | bend |
| 163 | 0 | no | bend |
| 197 | 0 | no | stretch |
| 241 | 100 | yes | stretch |
| 247 | 0 | no | stretch |
| 341 | 161 | yes | stretch |
| 468 | 346 | yes | stretch |
| 494 | 0 | no | stretch |
| 609 | 0 | no | stretch |
| 617 | 332 | yes | stretch |
Isomer 4
| Summary Data | Convergence |
|---|---|

|
Low frequencies --- -3.5206 -1.7953 -0.0037 -0.0036 -0.0034 2.1256 Low frequencies --- 16.7649 55.8507 80.0278 |
Vibrational Spectrum of Isomer 4
| Wavenumber | Intensity | IR active? | Type |
| 17 | 0 | no | bend |
| 56 | 0 | no | bend |
| 80 | 0 | no | bend |
| 92 | 1 | no | bend |
| 107 | 0 | no | bend |
| 110 | 5 | slight | bend |
| 121 | 8 | slight | bend |
| 149 | 5 | slight | bend |
| 154 | 6 | slight | bend |
| 186 | 1 | no | bend |
| 211 | 21 | yes | stretch |
| 257 | 10 | yes | stretch |
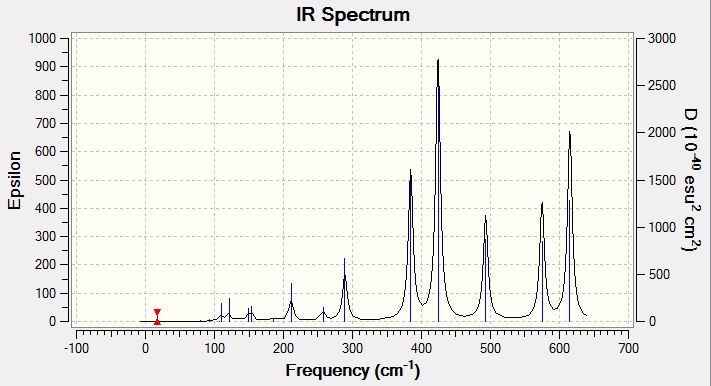
| 289 | 48 | yes | stretch |
| 384 | 154 | yes | stretch |
| 424 | 274 | yes | stretch |
| 493 | 107 | yes | stretch |
| 575 | 122 | yes | stretch |
| 615 | 197 | yes | stretch |
Isomer 5
| Summary Data | Convergence |
|---|---|

|
Low frequencies --- -5.1709 -3.5979 -2.1401 -0.0033 -0.0030 -0.0027 Low frequencies --- 17.4126 50.7812 72.1964 |
Vibrational Spectrum of Isomer 5
| Wavenumber | Intensity | IR active? | Type |
| 17 | 0 | no | bend |
| 51 | 0 | no | bend |
| 72 | 1 | no | bend |
| 98 | 0 | no | bend |
| 112 | 0 | no | bend |
| 112 | 8 | slight | bend |
| 120 | 11 | yes | bend |
| 160 | 1 | very slight | bend |
| 166 | 7 | slight | bend |
| 187 | 2 | very slight | bend |
| 264 | 0 | no | stretch |
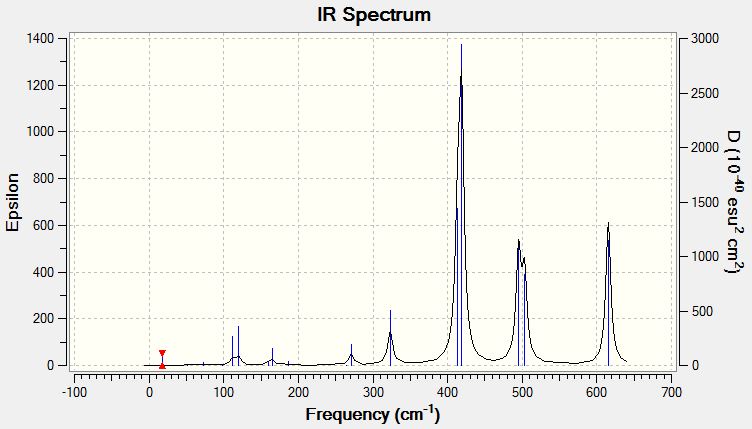
| 271 | 13 | yes | stretch |
| 323 | 41 | yes | stretch |
| 414 | 149 | yes | stretch |
| 419 | 310 | yes | stretch |
| 495 | 134 | yes | stretch |
| 503 | 105 | yes | stretch |
| 615 | 177 | yes | stretch |
Analysis of Data from Vibrational Spectra
Discuss the IR spectra with respect to the symmetry of each conformer, why do some spectra have more bands than others?
An advantage of computational chemistry is that you can calculate the position of bands that are not experimentally active, what is the requirement for an IR band to be active?
Discuss the position and nature of Al-Br stretching vibrations with respect to the terminal or bridging position of the Br atom. Placing images of the spectra side by side is not sufficient, tabulate the key vibrational frequencies (remember that they can reorder, so be sure you are comparing similar modes). The key word here is "discuss" just presenting images and tables is not sufficient, you must interpret your results.
As the symmetry of the isomers increases, the vibrational spectra become simpler. This is due to vibrational modes becoming degenerate and peaks coinciding on the spectrum. Comparative vibrational modes can also switch from IR active to inactive among isomers if the motion does not induce a change in dipole moment in the molecule and vice versa for modes switching from IR inactive to active.
When inspecting the vibrational spectra of the various isomers, the following observations are noted. Isomer 1 - 2 large peaks, 3 small peaks, 2 very small peaks (total 7 peaks) Isomer 2 - 2 large peaks, 1 small peak, 2 very small peaks (total 5 peaks) Isomer 3 - 4 large peaks, 0 small peaks, 3 very small peaks (total 7 peaks) Isomer 4 - 6 large peaks, 1 medium peak, 1 small peaks, 4 very small peaks (total 12 peaks) Isomer 5 - 3 large peaks, 1 medium peak, 3 small peaks (total 7 peaks)
The highest symmetry is possessed by isomer 3 belongs to the D2h point group (5 symmetry operations) and its spectrum has 7 peaks. Isomers 1 and 5 belong to the C2v point group (4 symmetry operations) and they also have 7 peaks in their spectra. Isomer 2 which belongs to the C2h point group (4 symmetry operations) has the fewest peaks possibly due to the degeneration of energy levels of vibrational modes or the change of a vibrational mode from IR active to inactive. The isomer with the least symmetry and belonging to point group C1 (1 symmetry operation) has the most complex spectrum among the isomers.
The selection rule for infrared spectroscopy for a vibrational mode to be IR active is as mentioned before, that the vibrational mode must induce a change in dipole moment of the molecule. Raman spectroscopy is able to visualise peaks that are experimentally IR inactive.
The vibrational mode of all the isomers which cause a stretch of the bridging atoms was compared by their frequencies. Isomers 1,2 and 5 have two bridging chlorine atoms, Isomer 4 has one bridging chlorine and one bridging bromine atom and Isomer 3 has two bridging bromine atoms. Isomer 3 has the smallest frequency since the 2 Al-Br bridging bonds are expected to be the weakest. Isomer 4 has a higher frequency than Isomer 3 as the number of bridging bromines decreases; however it is anomalously higher which may result from a change in the nature of the motion of the vibrational mode for this isomer. The isomers with no bridging bromides have the highest frequencies; the cis isomer is the lowest followed by the trans isomer and the geminal isomer has a notably higher frequency than the other two double-chlorine-bridging isomers. Since it is the most stable isomer, it is expected to have the strongest bridging bonds. The vibrational mode of all the isomers which cause a stretch of the terminal halide atoms was compared by their frequencies. In order to compare, the types of terminal atom connected to a single Al centre is taken into consideration. Isomer 3 has no terminal bromines, Isomer 1 and 2 have one chlorine and one bromine attached to each Al, Isomer 4 has a two terminal chlorines on one Al and on the other it has one chlorine and one bromine. Isomer 5 has two bromines attached to the Al. The frequencies are notably larger than for the bridging stretches. The weakest stretches are observed with the bromine bonds in terminal positions, the lowest produced by the geminal bromines (isomer 5) followed by isomer 4, which has a chlorine and bromine geminal. The cis and trans isomers (1 and 2) have relatively the same frequency of stretch. All isomers with geminal chlorines (isomers 3, 4 and 5) gave relatively the same stretching frequencies for stretching of the chlorines; these frequencies were the highest. This again reinforces the concept of the strength of the Al-Cl bond whether in bridging or terminal positions.
Molecular Orbital Visualisations
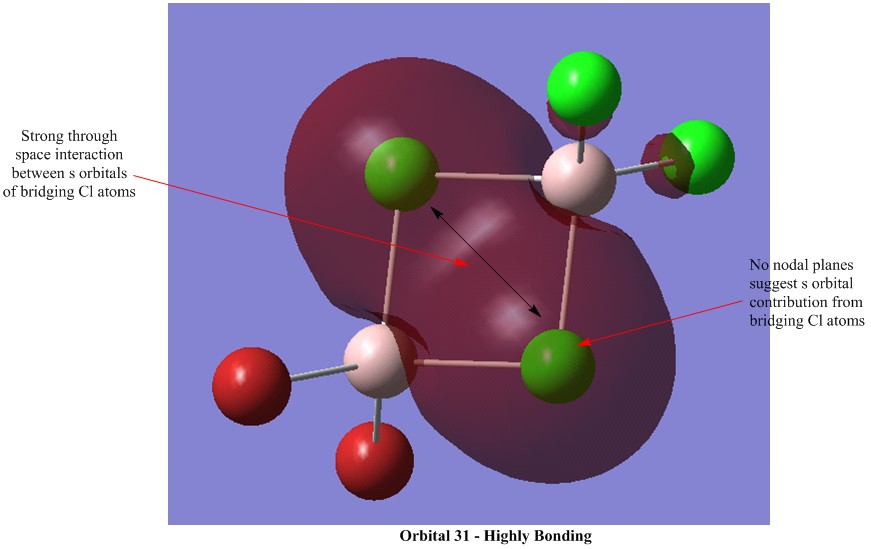
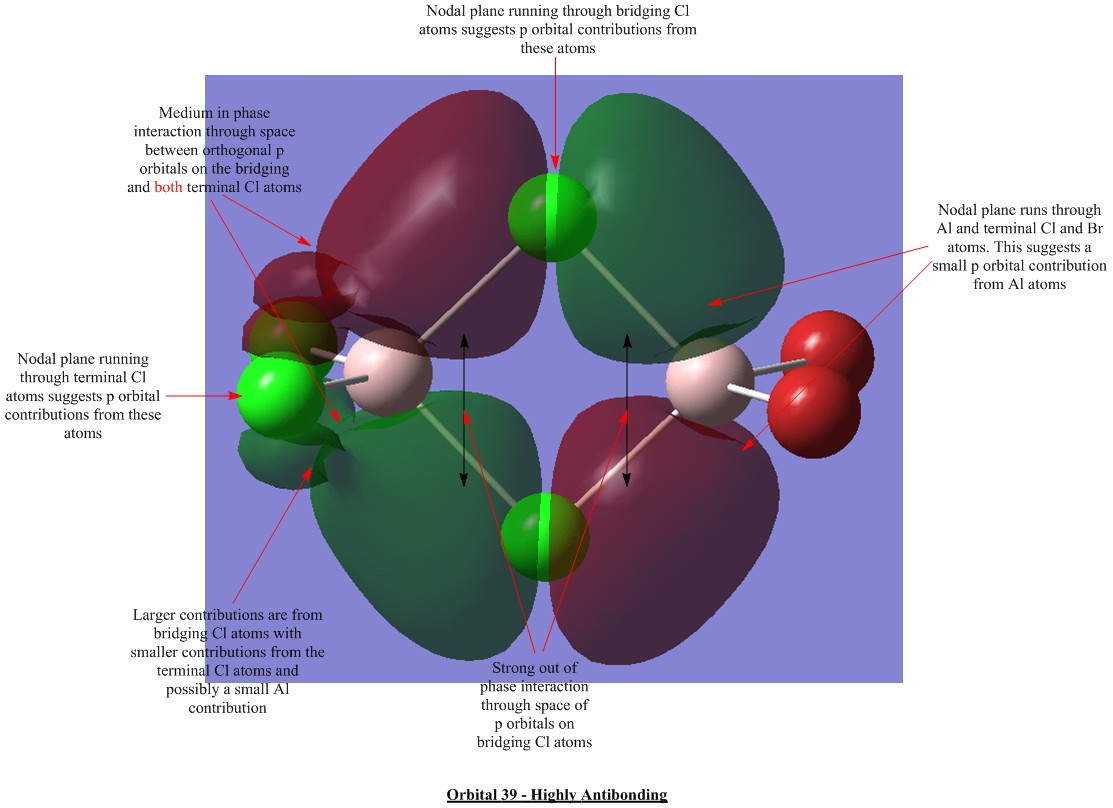
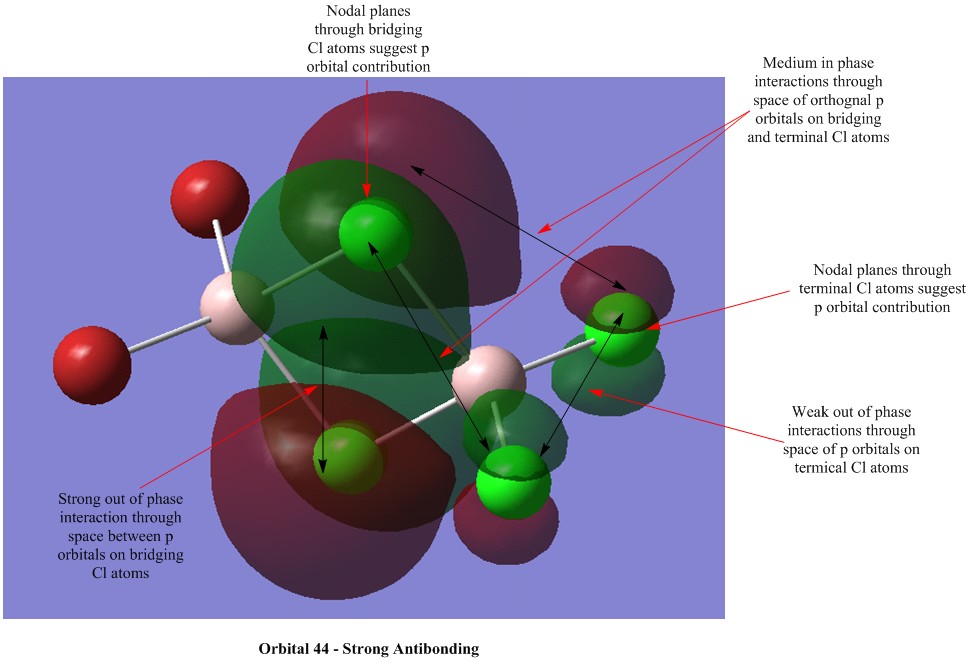
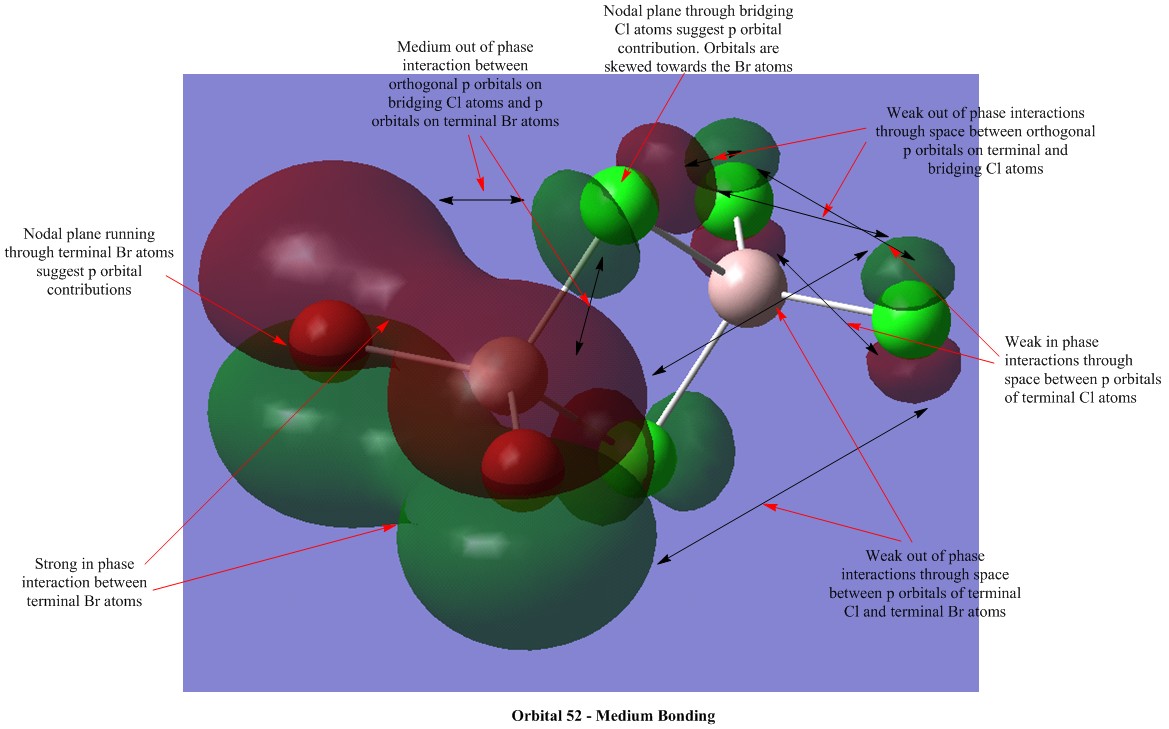
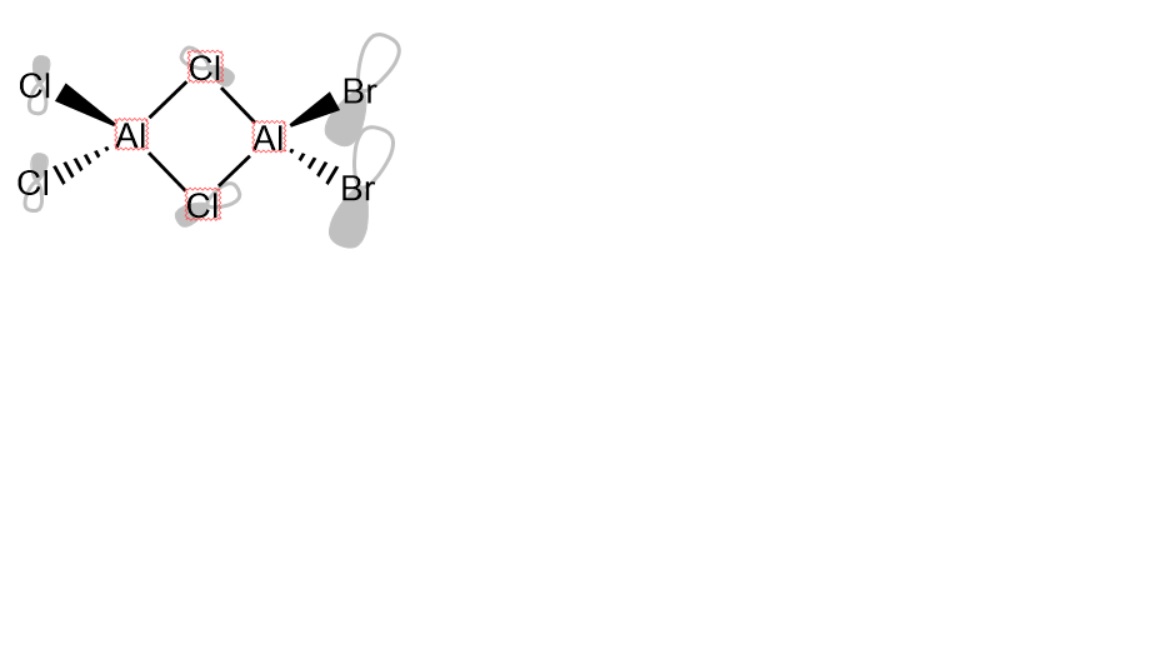
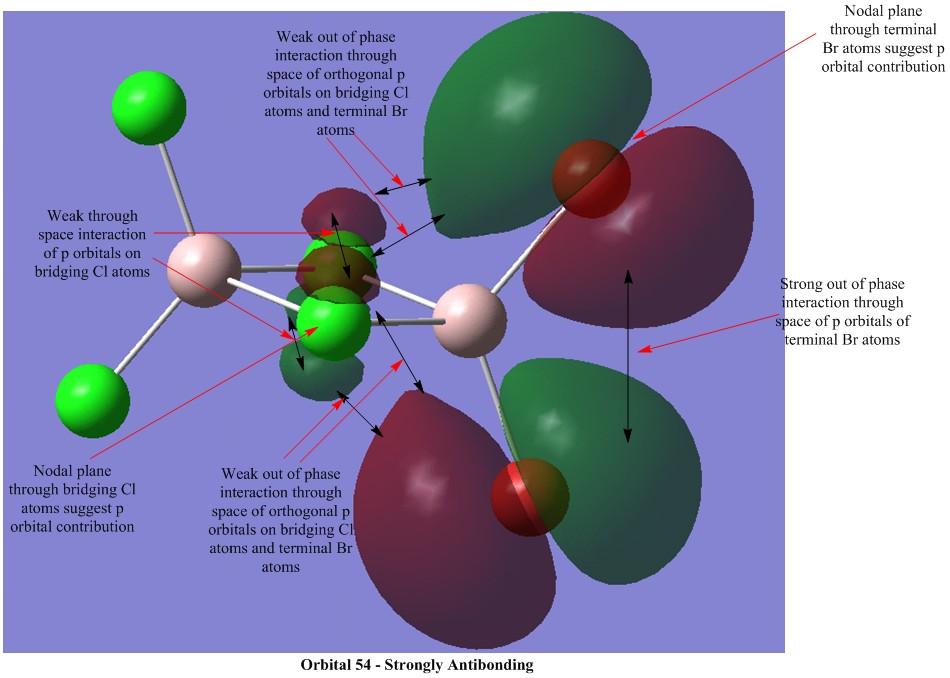
Molecular orbital calculations were carried out on the lowest energy conformer of Al2Cl4Br2 (isomer 5 with geminal bromine atoms). Five orbitals were selected to illustrate a range of bonding and antibonding interactions. Each generated orbital is annotated with interpretations of the interactions. LCAO orbitals were also suggested based on observation of the generated orbitals.


