User:Np1612
Experiment 1C - Advanced Molecular Modelling and Assigning the Absolute Configuration of an Epoxide
Conformational Analysis using Molecular Mechanics
It is well known that chemistry is predominantly an experimental science where models are used to explain experimental findings. Chemists have developed mathematical tools to help in understanding physical and chemical properties of molecules such as molecular structure and reactivity. In this experiment the mathematical model used is molecular mechanics, the so-called "ball-and-spring" model. Molecular mechanics describes the potential energy of a molecule in terms of bond stretches, bond angles, torsional strain and Van der Waals and electrostatic interactions present in the molecule. However for this model to be realistic certain force constants must be chosen hence force fields exist[1]. In this section all molecules were drawn on ChemBio3D and the optimum molecular energies were computed using molecular mechanics, MMFF94s force field and conjugate gradient minimization technique on Avogadro3D unless stated otherwise.
The Hydrogenation of Cyclopentadiene Dimer
The dimerisation of cyclopentadiene is a classical example of a Diels-Alder cycloaddition. This reaction has been extensively studied due to its exceptional stereoselection that leads to the exclusive formation of the endo- dimer[2]. However, in theory it is possible to form both the endo- and exo- products. The energies for the optimised geometries of both the dimerisation products are calculated and compared (Table 1).
| Cyclopentadiene Exo Dimer 1 | Cyclopentadiene Endo Dimer 2 | |||||
|---|---|---|---|---|---|---|
| Optimised Structure | ||||||
| Total Bond Stretching energy (kcalmol-1) | 3.543 | 3.464 | ||||
| Total Angle Bending Energy (kcalmol-1) | 30.773 | 33.226 | ||||
| Total Torsional Energy (kcalmol-1) | -2.731 | -2.953 | ||||
| Total Van der Waals Energy (kcalmol-1) | 12.801 | 12.332 | ||||
| Total Electrostatic Energy (kcalmol-1) | 13.014 | 14.182 | ||||
| Total Energy (kcalmol-1) | 55.373 | 58.190 |
Thermodynamically speaking, it would be expected that the most stable, lowest energy, product would be formed. From the calculations carried out the exo- product is more thermodynamically stable compared to the endo- product. This suggests that the reaction is kinetically controlled because, as stated above, this dimerisation involves the formation of the endo- product only. In other words, the kinetic product (endo-) has a lower transition state energy but a higher overall energy. In contrast, the thermodynamic product (exo-) has a lower total energy but a higher transition state energy. This is reflected in the calculated energies for the optimized exo- product and endo- product geometries which show that they have an energy of 55.373 kcalmol-1 and 58.190 kcalmol-1 respectively. Further analysis of the energies of the different parameters measured indicates that the angle bending energy and the electrostatic energy are the main factors dictating the overall stability of the molecules. It must be considered, however, that these measurements have no real thermodynamic meaning as they are not related to a specific thermodynamic quantity but merely allow the comparison to be made between isomers. Furthermore, the results obtained are in agreement with values reported in the literature[2] that states the exclusive formation of the endo- product.
According to the literature the stability of the endo- product is because of the secondary orbital interactions[2] that occur when the cyclopentadiene molecules react in a certain geometry, i.e. endo-, as shown in Figure 1.
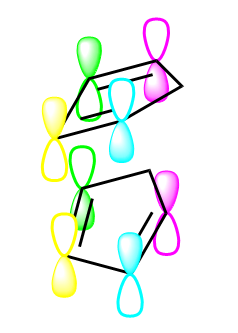
The endo- product can be hydrogenated to give a dihydro derivative. In similar fashion to the dimerisation of cyclopentadiene, two dihydro derivatives are theoretically possible.
| Dihydro Derivative 3 | Dihydro Derivative 4 | |||||
|---|---|---|---|---|---|---|
| Optimised Structure | ||||||
| Total Bond Stretching energy (kcalmol-1) | 3.312 | 2.823 | ||||
| Total Angle Bending Energy (kcalmol-1) | 31.953 | 24.686 | ||||
| Total Torsional Energy (kcalmol-1) | -1.487 | -0.378 | ||||
| Total Van der Waals Energy (kcalmol-1) | 13.639 | 10.637 | ||||
| Total Electrostatic Energy (kcalmol-1) | 5.119 | 5.147 | ||||
| Total Energy (kcalmol-1) | 50.446 | 41.258 |
By comparing the total energies of the two dihydro- derivatives 3 and 4 shown in Table 2 it can be seen that derivative 4 has a lower total energy, hence it is the more thermodynamically stable isomer. In addition it can be deduced that the olefinic bond position is responsible for the change in energy and relative stability between the two isomers. Although all the factors presented in Table 2 contribute to the overall energy of derivatives 3 and 4, only those that vary significantly and are related to the differing position of the alkene bond will be analysed and discussed below.
The Total Angle Bending Energy for dihydro-derivative 3 is 7.267 kcalmol-1 higher than that for derivative 4. The angle bending energy term describes the flexibility of molecules, therefore this suggests that derivative 3 experiences a higher ring strain as it is more rigid compared to derivative 4. To further confirm this, the olefinic angles of both isomer 3 and 4 were calculated and found to be 107° and 112° respectively. It is well known that the preferred angle of an sp2 hybridised carbon, like that present in an alkene bond, is 120°. For this reason, isomer 3 has a larger angle strain which is reflected in the higher Total Angle Bending Energy. Next, the Total Van Der Waals Energy will be examined. The Total Van der Waals Energies of both dihydro- derivatives differ by 3.002 kcal/mol. Molecule 3 has a larger Total Van der Waals Energy which suggests that there is a higher degree of repulsive Van der Waals interactions present in it. It is probable that these interactions occur upon hydrogenation of the molecule as this type of interaction occurs when two atoms are at a distance smaller than the sum of their individual Van der Waals radii. This increase in Total van der Waals Energy only occurs when dihydro- derivative 3 is hydrogenated. In the future, to determine the exact cause of these interactions an NCI and QTAIM analysis could be carried out on both dimers and the results compared.
Moreover, this analysis agrees with what A. Behr et al.[3] reported on the selective mono-hydrogenation of dicyclopentadiene. Usually the formation of dihydro- derivative 4 is expected as the "ring tension of the norborene double bond is more energy-rich."[3]
Atropisomerism in an Intermediate of the Synthesis of Taxol
Molecules 9 and 10 (Figure 2) are key intermediates in the synthesis of Taxol; an important drug for the treatment of ovarian cancer, suggested by Paquette[4]. This reaction exhibits stereoselection as only one isomer is initially formed: carbonyl up (molecule 9) or carbonyl down (molecule 10)[4] [5]. However, when left to stand, the compound will isomerise very slowly to the most thermodynamically stable isomer - an example of atropisomerism[4]. The energy barrier between the two atropisomers is very high[5] due to the sterically hindered rotation about the single bonds when going from carbonyl up to carbonyl down. The objective of this section is to determine which of the two atropisomers is more thermodynamically stable.

In order to investigate the energies of atropisomers 9 and 10, the total energies of their different molecular conformations were calculated as stability depends highly upon the geometry of the molecules. Nevertheless, due to their large size and complexity many conformational possibilities and energetic minima exist, thus, not all the possible conformations were analysed.
Two conformations for molecules 9 and 10 were chosen for the analysis which only differentiate in the conformations of the cyclohexane ring. This is because the six membered ring is the most flexible part in both molecules hence will have a greater effect on their stability. The four possible conformations and energies for cyclohexane are illustrated in Figure 3 below.

From Figure 3 it can be seen that the ground state energy (global minimum) conformation of the cyclohexane ring is the "chair" structure. This is a fully staggered structure which experiences no torsional strain at all. The next most stable structure(local minimum) is the "twist-boat" structure which is somewhat more strained as some of the carbons are eclipsed. The "chair" and "twist-boat" conformations were chosen to compare the relative stabilities of Taxol intermediates 9 and 10 displayed in Table 3 below.
| Taxol Intermediate 9 | Taxol Intermediate 10 | |||||||||||
|---|---|---|---|---|---|---|---|---|---|---|---|---|
| Optimised Structure | ||||||||||||
| Cyclohexane Ring Conformation | Chair | Twist Boat | Chair | Twist Boat | ||||||||
| Total Energy (kJmol-1) | 309.352 | 326.182 | 255.54 | 288.404 | ||||||||
The data shows that the most thermodynamically stable atropisomer is Taxol intermediate 10. The largest difference between these two molecules is the orientation of the carbonyl group - the more stable conformer has the carbonyl group pointing down. In addition, the data confirms that the cyclohexane conformation and the overall conformation of the molecule has an important effect on its stability as discussed above. The lowest energy conformation found had a Total Energy of 255 kJmol-1 where the cyclohexane ring was in the "chair" conformation. However, it must be noted that according to colleagues that also carried out this investigation there are a further two conformations for molecule 9 and 10; one each for cyclohexane "chair" and "twist boat" conformation that differ in their relative orientation to the eight membered ring.
A hypothesis to explain the greater stability of molecule 10 could be the antiperiplanar orientation of the C=O bond with the neighbouring C-H bond. This causes an interaction between the anti-bonding σ*C-O orbital(acceptor) and the bonding σC-H orbital(donor)[8]. Electron density from the occupied σC-H orbital (donor) is donated into the empty σ*C-O orbital (acceptor) which results in an overall stabilising energy[8]. This stabilising energy depends on the energy gap between the donor and acceptor orbitals, and the physical overlap between the two orbitals. In molecule 10 these requirements are met due to the electron withdrawing abilities of the electronegative oxygen present making it a good acceptor and the antiperiplanar orientation of the C-H and C=O bonds allowing a large orbital overlap[8]. Therefore the stabilising effect is larger in molecule 10 compared to molecule 9 where the C=O bond is pointing upwards and a stabilising antiperiplanar interaction is not present causing its conformers to be higher in energy.
Another particular feature about Taxol intermediates 9 and 10 is the stability of the alkene bond - upon functionalisation it reacts abnormally slowly. This is as a result of the alkene bond being positioned near the bridgehead making it very unreactive due to its "cage-like" structure[9]. These olefins are called "hyperstable olefins" and are more thermodynamically stable than their parent hydrocarbons[9]. An index called "olefinic strain," which measures the extra strain related to the double bond, is used to quantify olefin stability[9].
Moreover, to test this theorem the most thermodynamically stable Taxol intermediate conformer (Taxol 10 "chair") was hydrogenated, then optimised and its total energy was computed. The hydrogenated version was compared to molecule Taxol 10 "chair" as presented in Table 4 below.
| Hydrogenated Taxol 10 Chair | Taxol 10 Chair | |||||
|---|---|---|---|---|---|---|
| Optimised Structure | ||||||
| Total Energy (kJmol-1) | 422.324 | 255.54 |
It was found that the experimental results strongly agree with the theorem on "hyperstable olefins" (above). The Total Energy of the parent hydrocarbon of Taxol intermediate 10 "chair" is almost twice its energy.
Spectroscopic Simulation using Quantum Mechanics
In this section of the experiment quantum mechanics was used to simulate the 1H and 13C NMR spectra of another intermediate in the synthesis of Taxol: molecule 18 (Figure 4. below).

Molecule 18 was drawn on ChemBio3D and then exported to Avogadro (Figure 5.) where it was optimised using MMFF94s force field and conjugate gradient minimisation technique. The lowest energy conformation found was that where the cyclohexane ring had a "chair" conformation for the reasons discussed above. The Total Energy calculated was of 420.546 kJmol-1.
Figure 5. Molecule 18 Optimised |
The geometry at the density functional level (DFT) of optimised molecule 18 was calculated using Gaussian. The following parameters were set:
# B3LYP/6-31G(d,p) Opt SCRF(CPCM,Solvent=benzene) Freq NMR EmpiricalDispersion=GD3
This file was submitted to the HPC using the 'Gaussian8px' cluster. This job was successfully completed and the output files to this calculation can be found here DOI:10042/195178 .
It was later noticed that in order to get the exact nucleus and TMS reference value when analysing the NMR spectra different parameters should be set for the DFT calculation. The calculation was repeated (via the HPC) using the following altered parameters:
# B3LYP/6-311+G(2d,p) Opt SCRF(CPCM,Solvent=benzene) Freq NMR EmpiricalDispersion=GD3
However, all attempts for this job were unsuccessful. The most likely reason for this is that the molecule chosen for the job was not an energy global minimum. Even though the cyclohexane "chair" conformation is the lowest conformation for a six membered ring, as mentioned above, its relative position to the plane of the eight membered ring changes the overall energy of the molecule. The Total Energy results of the optimised molecule 18 conformation was compared with colleagues and it was found that the lowest energy optimised molecule 18 conformation had a Total Energy of 402 kJmol-1.
The free energy between the Taxol intermediate 18 cyclohexane "chair" conformation and the "twist-boat" conformation were compared and it was found that the energy difference is extremely small, i.e. 0.0015 kJmol-1.
Results for the successful spectroscopic simulation are presented below. The 1H and 13C NMR spectra are analysed and discussed separately. The atoms have been numbered as shown in Figure 6 to aid the understanding of the NMR analysis.
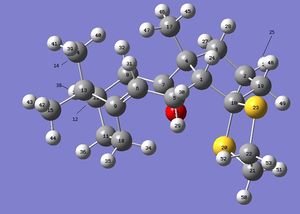
1H NMR Spectrum of a Taxol Intermediate 18
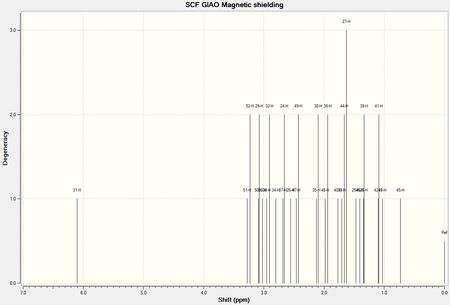
In Table 5 below the hydrogen environments have been identified and labelled with letters, and the calculated shifts have been named "Mean Shift." This is due to the fact that the raw data from the spectroscopic simulation did not show the correct chemical environments. That is to say, that usually where a methyl group is present in a sample that has been analysed through 1H NMR, it is expected that the methyl protons have the same chemical shift. This is due to the free rotation about the C-C bond which causes the protons to experience the same chemical environment. On the contrary, the raw data from the quantum mechanical calculation showed hydrogens from the same methyl group to have exceptionally different chemical shifts (differences of <1.75 ppm) and hence, to be in different environments. Consequently, to correct error due to the predetermined spectroscopic simulation settings, the chemical shifts for protons from the same methyl or methylene group were averaged to give a single shift for that environment. This was done to allow the comparison to be made between the shifts obtained from the quantum mechanical spectroscopic simulation and literature values. However, the chemical shift values reported in the literature[4] are not assigned to each hydrogen in each multiplet, therefore literature values were also averaged to obtain a mean shift for each multiplet.
| Environment | Atom Number | Mean Shift (ppm) | Reference Mean Shift (ppm)[4] | Deviation (ppm) |
|---|---|---|---|---|
| A | 45,46,47 | 1.53 | 1.35 | 0.18 |
| B | 27 | 1.67 | 1.58 | 0.09 |
| C | 28 | 1.34 | 1.03 | 0.31 |
| D | 26 | 2.56 | 2.53 | 0.03 |
| E | 25 | 1.47 | 1.03 | 0.44 |
| F | 48 | 1.96 | 1.95 | 0.01 |
| G | 49 | 2.45 | 1.95 | 0.50 |
| H | 50,51 | 3.17 | 2.85 | 0.32 |
| I | 52,53 | 3.14 | 2.85 | 0.29 |
| J | 24 | 2.67 | 2.53 | 0.15 |
| K | 29 | 3.08 | 2.85 | 0.23 |
| L | 30 | 2.93 | 1.03 | 1.90 |
| M | 31 | 6.11 | 5.21 | 0.90 |
| N | 34 | 2.80 | 2.53 | 0.28 |
| O | 35 | 2.11 | 1.95 | 0.16 |
| P | 36 | 1.96 | 1.95 | 0.01 |
| Q | 37 | 2.67 | 2.53 | 0.15 |
| R | 42,43,44 | 1.26 | 1.07 | 0.19 |
| S | 39,40,41 | 1.40 | 1.10 | 0.30 |
| T | 38 | 2.11 | 1.95 | 0.16 |
| U | 32 | 2.93 | 2.85 | 0.08 |
| V | 33 | 1.67 | 1.95 | -0.28 |
It can be seen from Table 5 and Figure 7 that the agreement between literature values and the quantum mechanical spectroscopic simulation is not very good. Figure 7 shows the deviation in ppm between the mean calculated shift and the mean reference shift (mean deviation is 0.29 ppm). The reason for this large discrepancy between values is that the chemical shifts reported in literature were obtained experimentally. Hence, they reflect a time-weighted average of all the possible conformations of Taxol intermediate 18 yet, only one conformer was used to generate the 1H NMR quantum mechanically. The big size and complexity of molecule 18 means that there are many potential conformations available. During the optimisation of the molecule only the cyclohexane ring conformation was altered to obtain the most stable conformer however there are many rings present in Taxol 18 each having a preferred conformation. In addition, further error will have been caused when averaging the calculated and literature shifts, and when assigning the literature shifts. To illustrate, when assigning the chemical shifts of the protons closest in proximity to the 1,3-dithiolane ring (atoms number 29 and 30) it was unclear as to whether the two proton environments were identical or not and therefore should have been averaged. The through space interaction between the sulphur atoms on the thiolane ring and the adjacent protons cause the latter to be more deshielded and therefore would have a larger chemical shift.
Finally, it can be deduced that the calculated data is of a low level of accuracy as it does not reflect experimental data. However, in the future comparison should be made with assigned literature values which would immediately minimise a large source of error. Furthermore, if this simulation were to be repeated the spin-spin couplings of the molecule would be calculated in order to correctly identify chemical environments and assign chemical shifts. Moreover, spectroscopic simulations would be computed for various conformations and averaged according to Boltzmann's distribution in order to mimic what would be expected from experiment.

Figure 7 (above) further illustrates the disagreement between literature values and computed ones. The largest disagreement is in environment L (atom number 30), which has been discussed above, due to its chemical environment ambiguity.
The 1H NMR spectrum from the output file of the quantum mechanical spectroscopic simulation of Taxol intermediate 18 is presented below (Figure 8).
13C NMR Spectrum of a Taxol Intermediate 18
In the analysis of the 13C NMR spectrum below (Table 6) the atom numbers correspond to the different chemical shifts. In this case, letters have not been used to differentiate the chemical environments as each environment only contains one carbon atom. Consequently, it has not been necessary to average calculated or literature chemical shifts values which has removed a considerable source of error compared to the 1H NMR spectrum of Taxol intermediate 18.
| Atom Number | Shift (ppm) | Reference Shift (ppm)[4] | Deviation (ppm) |
|---|---|---|---|
| 1 | 56.34 | 60.53 | 4.19 |
| 2 | 14.41 | 21.39 | 6.98 |
| 3 | 31.87 | 36.78 | 4.91 |
| 4 | 45.16 | 50.94 | 5.78 |
| 5 | 22.87 | 30.00 | 7.13 |
| 6 | 110.53 | 120.90 | 10.37 |
| 7 | 202.32 | 211.49 | 9.17 |
| 8 | 28.91 | 35.47 | 6.56 |
| 9 | 138.27 | 148.72 | 10.45 |
| 10 | 18.76 | 25.56 | 6.80 |
| 11 | 14.85 | 22.21 | 7.36 |
| 12 | 45.33 | 51.30 | 5.97 |
| 13 | 39.93 | 45.53 | 5.60 |
| 14 | 12.98 | 19.83 | 6.85 |
| 15 | 16.90 | 25.35 | 8.45 |
| 17 | 24.09 | 30.84 | 6.75 |
| 18 | 83.24 | 74.61 | -8.63 |
| 19 | 38.44 | 43.28 | 4.84 |
| 21 | 36.05 | 40.82 | 4.77 |
| 22 | 34.41 | 38.73 | 4.32 |
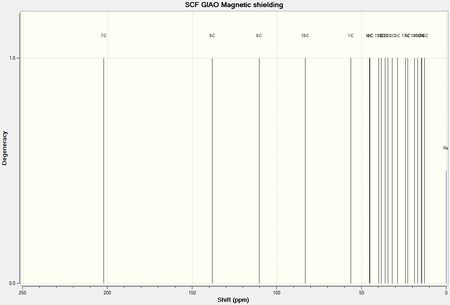
Similarly to the 1H NMR spectrum analysis above, Table 6 and Figure 9 illustrate the disagreement between computed 13C NMR shifts and those reported in the literature. However, in comparison, there is a better accord in this case between literature and calculation even though the mean deviation was found to be 5.93 ppm. It must be noted that the 13C chemical shifts are much larger than the 1H NMR ones hence, despite the fact that numerically the mean deviation for 13C NMR values is much larger than for 1H NMR, it is proportionally a much smaller difference.
Braddock and Rzepa[10] have reported that the calculated 13C NMR shifts for carbons attached to "heavy elements" such as halides appear to be too high. This is due to a spin-orbit coupling effect and hence a correction must be made to simulated spectroscopic NMR results[10]. Indeed, this correction should have been applied to the 13C NMR analysis of Taxol intermediate 18 as it contains a 1,3-dithiane ring which contains two "heavy" sulfur atoms. Interestingly, this correction factor would explain why atom 18 is the only one to have a negative deviation (Table 6 and Figure 9) as it is attached to two "heavy elements."
In the future, it would be pertinent to apply this correction factor to the 13C NMR analysis for Taxol intermediate 18 and compare the results with literature to see if a smaller mean deviation is achieved. Nevertheless, the discussion above further confirms that there is a better agreement between reported and computed 13C NMR chemical shifts compared to 1H NMR (above).

Figure 9 (above) is an additional illustration of the discussion above.
The 13C NMR spectrum from the output file of the quantum mechanical spectroscopic simulation of Taxol intermediate 18 is presented below (Figure 10).
In conclusion, it can be said that 13C NMR data computed aligns much better with literature values reported compared to 1H NMR data for Taxol intermediate 18. Therefore, the quantum mechanical spectroscopic simulation of 1H NMR Spectrum for Taxol intermediate 18 is an relatively inaccurate and unreliable method for the prediction of hydrogen chemical shifts and in turn determining its structure. On the other hand, 13C NMR data has proved to be considerably more accurate and reproducible when using the same method.
Analysis of the Properties of the Synthesised Alkene Epoxides
Two epoxides were chosen for this part of the investigation; styrene oxide and trans-β-methyl styrene oxide (TBMSO). They were drawn on ChemBio3D, then exported to Avogadro and energetically minimised using MMFF94s force field and conjugate gradient minimisation technique.
The Crystal Structures of the two Epoxidation Catalysts
The epoxidation catalysts analysed below are the Shi fructose-derived chiral catalyst and the Jacobsen salen-derived chiral catalyst due to their enantioselectivity during the asymmetric epoxidation reactions of alkenes.
Shi Fructose-derived Chiral Catalyst
The crystal structure of this molecule was found on PubChem and is shown below (Figure 11).
Figure 11. Shi Fructose-derived Chiral Catalyst. |
The Shi catalyst contains an anomeric centre which is the feature that gives it its remarkable enantioselectivity. The anomeric centre allows it to control the direction of the alkene it is reacting with during the epoxidation reaction favouring the formation of one enantiomer or diastereomer. This will be discussed in more detail below.

| Atom Number | Actual Bond Length (Å) | Optimal Bond Length (Å) |
|---|---|---|
| O(2)-C(8) | 1.424 | 1.393 |
| O(1)-C(12) | 1.437 | 1.384 |
| O(4)-C(8) | 1.427 | 1.393 |
| O(3)-C(12) | 1.435 | 1.384 |
The anomeric effect is the donation of electron density, usually a lone pair of electrons from for example oxygen, into to an acceptor, for example an empty antibonding σ*C-O orbital[11]. The orientation of the donor and acceptor are crucial as this effect will only occur if they are aligned antiperiplanar to each other[11]. When this occurs, the C-O accepting bond (the one corresponding to σ*C-O) to which the electron density has been donated into to will lengthen to a maximum[11]. The Shi catalyst meets the criteria for this effect to occur, i.e. O(4)-C(8)-O(2) in Figure 12 are in the correct orientation. This is also reflected in the "Optimal Bond Lengths" presented in Table 7 for O(2)-C(8) and O(4)-C(8). It would be expected for the C-O bonds not bonded to the anomeric centre (O(1)-C(12) and O(3)-C(12)) to be longer. In fact, the bonds around the anomeric centre are 0.009 Å shorter compared to those bonded to the anomeric centre which reflects the "bond legnthening" effect of the anomeric centre.
It can be seen in Table 7 that two sets of bond lengths are found. The most likely reason for this is that the molecule obtained from PubChem was not an optimised minimum energy structure. Therefore when it was imported into ChemBio3D to find the bond lengths the program automatically found the optimum bond lengths, in other words, the ones that would be expected in a crystal structure. For this reason in the discussion above only the "Optimal Bond Lengths" have been considered.
As mentioned above the anomeric centre is key for the enantioselectivity of the catalyst. This is due to the fact that not only does it have a "bond lengthening" effect but it makes the five membered ring more rigid due to the preferred orientation of the bonds. This increases steric hindrance when it reacts with cis- alkenes compared to trans- alkenes.
The Jacobsen Salen-derived Chiral Catalyst
The crystal structure of this molecule was found on CCDC and is displayed below.
Figure 13. Jacobsen Salen-derived Chiral Catalyst. |

The Jacobsen catalyst has closely approaching hydrogen atoms on two adjacent t-butyl groups in order to aid enantioselectivity. The small distance between t-butyl groups causes steric hindrance and controls the face at which the alkene approaches the catalyst during epoxidation reactions favouring the formation of one product. Figure 14 below illustrates these distances.
The close proximity of the hydrogen atoms suggests there are through space interactions present, for example Van der Waals interactions. This type of interaction is extremely weak, however, it reaches a maximum when the two interacting atoms are at a distance equal to the sum of their individual Van der Waals radii. In the Jacobsen's catalyst the interaction occurs between two hydrogen atoms hence it would be expected for the maximum interaction to occur when they are 2.40 Å apart (Van der Waals radius of hydrogen is 1.20 Å[12]).
From Figure 14 two important distances can be identified; 2.354 Å and 2.549 Å. These two distances are the only ones that will have a significant effect to the Van der Waals interactions between the t-butyl groups. The other distances found are too large to cause an attractive interaction between the atoms. The interaction present at 2.354 Å is a slightly repulsive interaction as it is just shorter than the sum of the Van der Waals radii. On the other hand, the interaction that occurs at 2.549 Å is relatively attractive as the distance is fairly close to the shortest attractive distance found above.
The Calculated NMR Properties for the chosen Epoxides
The 1H and 13C NMR Sepctra of styrene oxide and TBMSO were quantum mechanically spectroscopically simulated in order to check their integrity. However, this data cannot be used to obtain the absolute configurations of the modeled epoxides as both enantiomers will show identical chemical shifts.
For this reason, the NMR data for only the enantiomer modelled of each epoxide has been presented below. The outputs of both calculations can be found here; styrene oxide DOI:10042/195194 and TBMSO DOI:10042/195193 .
Styrene Oxide
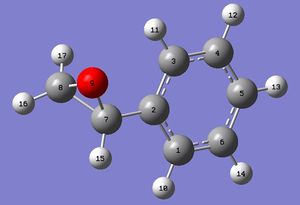
The 1H NMR Data is presented in Table 8 below.
| Atom Number | Mean Shift (ppm) | Reference Mean Shift (ppm)[13] | Deviation (ppm) |
|---|---|---|---|
| 10 | 7.61 | 7.33 | 0.29 |
| 11 | 7.61 | 7.33 | 0.29 |
| 12 | 7.61 | 7.33 | 0.29 |
| 13 | 7.61 | 7.33 | 0.29 |
| 14 | 7.61 | 7.33 | 0.29 |
| 15 | 3.85 | 3.88 | -0.03 |
| 16 | 3.21 | 3.17 | 0.04 |
| 17 | 2.66 | 2.82 | -0.16 |
The 1H NMR Spectrum of Styrene Oxide is reported in Figure 16 below.

The 13C NMR Data is presented in Table 9 below.
| Atom Number | Mean Shift (ppm) | Reference Mean Shift (ppm)[13] | Deviation (ppm) |
|---|---|---|---|
| 1 | 133.69 | 129.78 | 3.91 |
| 2 | 133.69 | 129.78 | 3.91 |
| 3 | 133.69 | 129.78 | 3.91 |
| 4 | 133.69 | 129.78 | 3.91 |
| 5 | 133.69 | 129.78 | 3.91 |
| 6 | 133.69 | 129.78 | 3.91 |
| 7 | 56.71 | 52.10 | 4.61 |
| 8 | 56.89 | 51.00 | 5.89 |
The 13C NMR Spectrum of Styrene Oxide is reported in Figure 17 below.

Trans-β-Methylstyrene Oxide
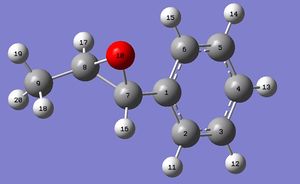
The 1H NMR Data is presented in Table 10 below.
| Environment | Atom Number | Mean Shift (ppm) | Reference Mean Shift (ppm)[14] | Deviation (ppm) |
|---|---|---|---|---|
| A | 11 | 7.59 | 7.29 | 0.30 |
| B | 12 | 7.59 | 7.29 | 0.30 |
| C | 13 | 7.59 | 7.29 | 0.30 |
| D | 14 | 7.59 | 7.29 | 0.30 |
| E | 15 | 7.59 | 7.29 | 0.30 |
| F | 16 | 3.54 | 4.05 | -0.51 |
| G | 17 | 2.87 | 3.33 | -0.46 |
| H | 18, 19, 20 | 1.34 | 1.08 | 0.26 |
The 1H NMR Spectrum of TBMSO is reported in Figure 19 below.
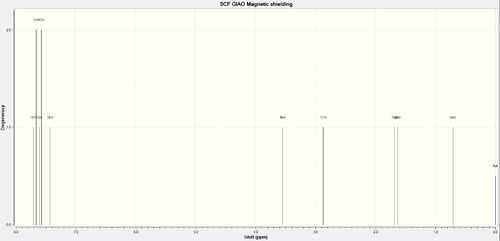
The 13C NMR Data is presented in Table 11 below.
| Atom Number | Mean Shift (ppm) | Reference Mean Shift (ppm)[14] | Deviation (ppm) |
|---|---|---|---|
| 1 | 133.65 | 129.33 | 4.32 |
| 2 | 133.65 | 129.33 | 4.32 |
| 3 | 133.65 | 129.33 | 4.32 |
| 4 | 133.65 | 129.33 | 4.32 |
| 5 | 133.65 | 129.33 | 4.32 |
| 6 | 133.65 | 129.33 | 4.32 |
| 7 | 64.16 | 57.50 | 6.66 |
| 8 | 67.13 | 55.00 | 12.13 |
| 9 | 18.29 | 12.50 | 5.79 |
The 13C NMR Spectrum of TBMSO is reported in Figure 20 below.
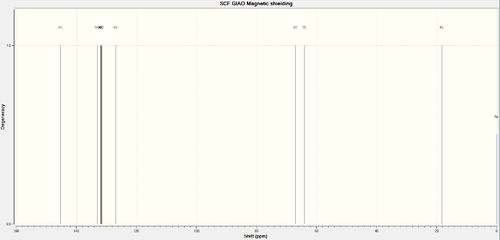
Assigning the Absolute Configuration of the Chosen Epoxides
Optical rotations
The optical rotations for both epoxides chosen (Styrene oxide and TBMSO) were computed via the HPC. Unlike the NMR Spectra simulations, optical rotations were calculated for both enantiomers of each epoxide. It is expected that the two enantiomers have equal and opposite optical rotations.
The output files of the optical rotations for styrene oxide enantiomers can be found here; R-styrene oxide DOI:10042/195199 and S-styrene oxide DOI:10042/195195 .
The output files of the optical rotations for TBMSO enantiomers can be found here; RR-TBMSO DOI:10042/195201 and SS-TBMSO DOI:10042/195200 .
References
- ↑ A. K. Rappe and C. J. Casewit, Molecular Mechanics across Chemistry, Sausalito : University Science Books, 1996.
- ↑ 2.0 2.1 2.2 P. Caramella, P. Quadrelli and L. Toma, J. Am. Chem. Soc., 2002, 124, 1130–1131.
- ↑ 3.0 3.1 A. Behr, V. Manz, A. Lux and A. Ernst, Catal. Letters, 2013, 143, 241–245.
- ↑ 4.0 4.1 4.2 4.3 4.4 4.5 L. A. Paquette, N. A. Pegg, D. Toops, G. D. A. Maynard and R. D. Rogers, J. Am. Chem. Soc., 1990, 112, 277–283.
- ↑ 5.0 5.1 S. W. Elmorel and l. A. Paquette, Tetrahedron Lett., 1991, 32, 319–322.
- ↑ H. Rzepa, 2011. Chemistry with a twist. Blogbooks, e-books and future proofing chemical diagrams. Retrieved March 01, 2015. From http://www.ch.imperial.ac.uk/rzepa/blog/?p=5312
- ↑ H. Rzepa, 2012. Chemistry with a twist. Ring-flipping in cyclohexane in a different light. Retrieved March 01, 2015. From http://www.ch.imperial.ac.uk/rzepa/blog/?p=7926
- ↑ 8.0 8.1 8.2 H. Rzepa, 2012. Chemistry with a twist. An orbital analysis of the stereochemistry of the E2 elimination reaction. Retrieved March 01, 2015. From http://www.ch.imperial.ac.uk/rzepa/blog/?p=6205
- ↑ 9.0 9.1 9.2 W. F. Maier and P. von R. Schleyer, J. Am. Chem. Soc., 1981, 103, 1891–1900.
- ↑ 10.0 10.1 D. C. Braddock and H. S. Rzepa, J. Nat. Prod., 2008, 71, 728–730.
- ↑ 11.0 11.1 11.2 H. Rzepa, 2011. Chemistry with a twist. Spotting the unexpected. Anomeric effects involving alkenes? Retrieved March 02, 2015. From http://www.ch.imperial.ac.uk/rzepa/blog/?p=5368
- ↑ R. S. Rowland and R. Taylor, J. Phys. Chem., 1996, 100, 7384–7391.
- ↑ 13.0 13.1 D. Limnios and C. D. Kokotos, J. Org. Chem., 2014, 79, 4270−4276.
- ↑ 14.0 14.1 Y. Kon, H. Hachiya, Y. Ono, T. Matsumoto and K. Sato, Synth. 2011, 7, 1092–1098.
