User:Nb1412
EX3 section
Introduction
The EX3 molecules that were analysed using computational chemistry are BH3, BBr3, GaBr3 and NH3. The program that were used was Gaussian to do optimisation, frequency, MO and NBO analysis of the EX3 with exception of heavier molecule such as GaBr3 where the analysis were done in High Performance Computing, HPC via online portal in order to minimise the CPU time.
Computational chemistry are useful in terms of the properties of the molecules like its transition state, the substituents effect, the IR and the vibrational frequencies of the molecule being analysed which will be shown later.1
In the optimisation step, the minimum energy structures of the molecules are located on its potential energy surface or the moelcule transition structure.1 The additional keyword used in the method step were 'integral=grid=ultrafine scf=conver=9'. The same keyword will he used for the frequency step. All the molecules used in this part are neutral thus in the method section of the optimisation step, the charge is set at zero with multiplicity of a singlet because 2S+1= 1. This step is very important in the project section as the ionic liquid molecules that were analysed as all positively charged. The gradient of the optimised molecule should be close to zero, for the stationary point on the potential energy surface is zero.1 For the optimisation step, it is important to check whether the molecule we optimised has converged or not as shown later in the 'Optimisation summmary data' of the respective molecules. The details of the convergence criteria will not be discussed in this section. In the frequency step, we are confirming to have minimal structure deally, we would like all the frequency readings to be positive, but the program used is not perfect. Population analysis type that were used was the NBO population analysis.
In all the comparison that was done in this 'EX3 section' and 'mini project section', whether its the optimisation, frequency, MO and NBO analysis were using the same method and basis set unless stated otherwise. Method/basis set used: B3LYP/3-21G level. The higher level of basis set that were used in some part of this report is 6-13G (d,p) and the medium basis set is LanL2DZ which was used for heavier group element of the periodic table.
Bond type and strengths
| Bond type | Weak | Medium | Strong | info |
|---|---|---|---|---|
| C-H | ✓ | Bond length= 109 pm, bond energy= 411 kj/mol | ||
| C-C | ✓ | Bond length= 154 pm, bond energy= 346 kj/mol | ||
| C-Br | ✓ | Bond length= 194 pm, bond energy= 327 kj/mol |
| Bond type | Weak | Medium | Strong | info |
|---|---|---|---|---|
| Si-H | ✓ | Bond length= 148 pm, bond energy= 318 kJ/mol | ||
| Si-O | ✓ | Bond length= 163 pm, bond energy= 452 kJ/mol | ||
| Si-I | ✓ | Bond length= 243 pm, bond energy= 234 kJ/mol |
In general, the shorter the bond the more s-character thus more energy is needed to break the bond. As shown in the above table, Si-O is a much stronger bond in comparison to all the above bonds. This shows that the definition of bond strength is different for every atom, it is not a fixed property but rather a spectrum. Its the same as the ligand spectrochemical series are slightly different or very different for every metal complex. Data in table 1 and 2 was taken from reference [[2]]
So what is bond? Bond can not be seen physically, so how do we define it? The best way to explain what a bond is by referring to the probability at which we find the most electrons to be in. [[3]]
BH3
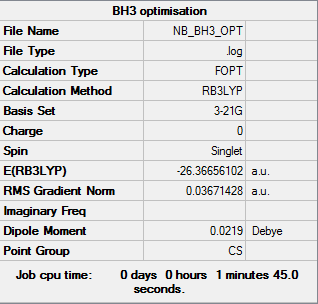
Optimisation of BH3: B3LYP/3-21G level with Cs symmetry
Optimisation log file here
This molecule, BH3 should have a D3h symmetry, but since we set the bond lengths of B-H bond to 1.53 angstrom, one B-H bond to 1.54 angstrom, and the third B-H bond to 1.55 angstrom, before we optimised them, we break the D3h symmetry to Cs point group.
Optimisation of BH3: B3LYP/3-21G level with D3h symmetry
Optimisation log file here
| summary data | convergence | Jmol | |||
|---|---|---|---|---|---|
|
Item Value Threshold Converged? Maximum Force 0.000000 0.000015 YES RMS Force 0.000000 0.000010 YES Maximum Displacement 0.000000 0.000060 YES RMS Displacement 0.000000 0.000040 YES |
|
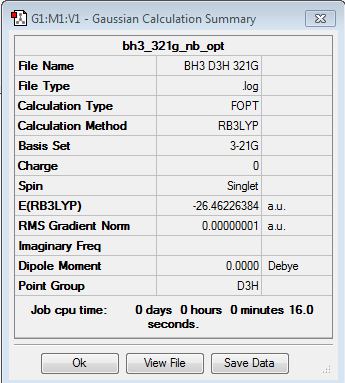
With basis set of 3-21g, the bond length of B-H is 1.19(4) Å while the bond angle is 120 °.
Optimisation of BH3: B3LYP/6-31G(d,p) level with Cs symmetry
Optimisation log file here
| summary data | convergence | Jmol | |||
|---|---|---|---|---|---|
|
Item Value Threshold Converged? Maximum Force 0.000012 0.000450 YES RMS Force 0.000008 0.000300 YES Maximum Displacement 0.000063 0.001800 YES RMS Displacement 0.000039 0.001200 YES |
|
Optimisation of BH3: B3LYP/6-31G(d,p) level with D3h symmetry
Optimisation log file here
| summary data | convergence | Jmol | |||
|---|---|---|---|---|---|
|
Item Value Threshold Converged? Maximum Force 0.000004 0.000015 YES RMS Force 0.000003 0.000010 YES Maximum Displacement 0.000017 0.000060 YES RMS Displacement 0.000011 0.000040 YES |
|
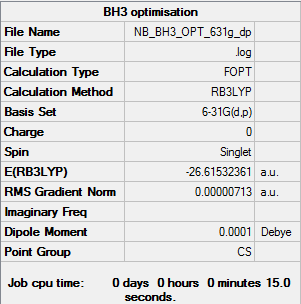
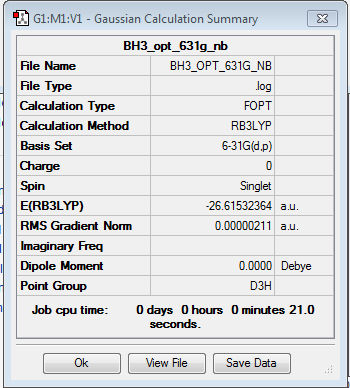
With D3h symmetry point group, the bond angle between H-B-H is 120° while the bond length of B-H is 1.19(2) Å. The bond length for B-H is shorter when we use a higher basis set (6-21g) when compared with using 3-21g basis set, which indicates the accuracy of the bond length when using a higher basis set where the experimental value of B-H bond length is 1.19 Å. [[4]]
Frequency Analysis of BH3 :B3LYP/6-31G(d,p) level
D-space of BH3 frequency file Link DOI:10042/147675
Frequency file: here
| summary data | low modes |
|---|---|
|
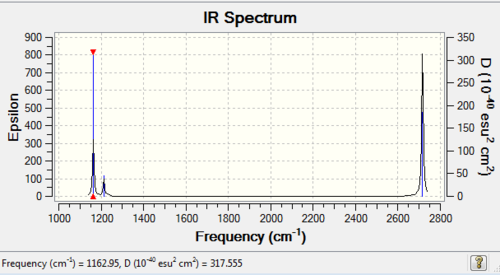
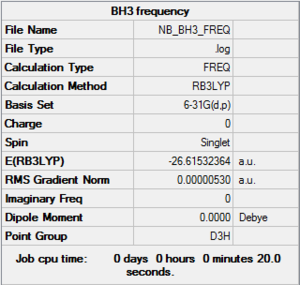
Low frequencies --- -14.5190 -14.5149 -10.8207 0.0006 0.0169 0.3454 Low frequencies --- 1162.9508 1213.1230 1213.1232 |
Vibrational Analysis for BH3
| wavenumber | Intensity | IR active? | type |
| 1163 | 93 | yes | bend (wagging i.e. umbrella motion) |
| 1213 | 14 | very slight | bend (rocking) |
| 1213 | 14 | very slight | bend (scissoring) |
| 2583 | 0 | no | symmetrical stretch |
| 2716 | 126 | yes | asymmetric stretch |
| 2716 | 126 | yes | asymmetric stretch |
Diagram 1:IR spectrum of BH3
BH3 is a polyatomic molecule thus to calculate the number of vibration is 3N-6 where N is the number of atoms of the molecule. The '-6' factor is due to the redundant translational and rotational motion of the molecules which does not contribute to the property of the molecule.[[5]]
Comparison of real MOs and LCAO MOs diagrams of BH3 molecule
| MO diagram of BH3 molecule | ||
|---|---|---|

|
| More Info | |||
|---|---|---|---|
| Real MO | LCAO MO | Comments | |
| 1a' | 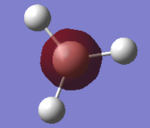 |
 |
The LCAO MO is simple and basically saying that this is a core AO which exhibit s-orbital, it being the lowest occupied AO. What it does not tell us, is the H atoms contributions to the MO. As shown under the 'Real MO', 1a' MO, the H AO does not contribute at all to the 1a' MO, meaning the electron density is localised at the centre of the molecule, the B atom only. Therefore, while it is easy assume that it is the core MO, it is not exactly accurate in terms of explaining which AO contribute to the orbital. |
| 2a' | 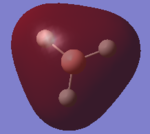 |
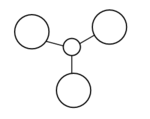 |
The LCAO MO shows the s-atomic orbital of the atoms are in phase and overlap with each other. The LCAO shows the H AO contributes more to the bonding properties of the MO but when we looked at the 'real MO' of 2a', the electron density of the MO is evenly delocalised throughout all the atoms. The LCAO is accurate in terms of the s-orbitals of the B and H atoms contribute to the bonding MO. |
| 1e' | 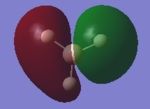 |
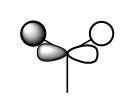 |
In the 'real MO', there is an internuclear node at the B atom and this is depicted accurately in the LCAO MO, as the MO is more anti-bonding due to the p-orbital of B contribution. |
| 1e' | 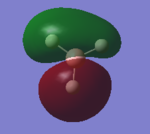 |
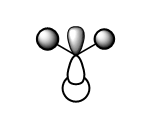 |
In the 'real MO', there is an internuclear node at the B atom and this is depicted accurately in the LCAO MO, as the MO is more anti bonding due to the p-orbital of B contribution. The degeneracy is not obvious from LCAO when in comparison to 'real MO', where the colour of the MO is the only thing that is different but the size of the of contribution does not change in 'real MO', this is not obvious from the 'LCAO'. |
| 1a2 | 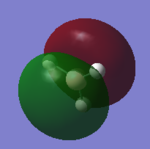 |
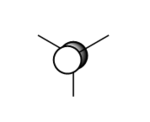 |
The 'real MO' shows an internuclear node at the B atom, and this was showed accurately by the LCAO where the antibonding contribution comes from B atom. What is not clear is that the internuclear nodes at the H atoms in 'real MO' is not depicted clearly in LCAO. |
| 3a1' | 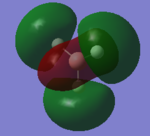 |
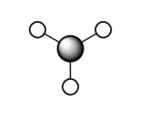 |
There are 3 nodal planes perpendicular to the B-H bond and this shows in the 'real MO' clearly which contributes to the high antibonding and thus high in energy for the MO. The 'real MO' shows that the s-orbital of the B atom smeared across the different phase of the s-orbital of the H atom and this is not shown in the LCAO. Thus LCAO does not show the effect of the opposite phase have on each other. |
| 2e' |  |
 |
There are internuclear node at the B atom and 2 nodal plane perpendicular across the B-H bond. The LCAO shows the p-orbital contribution of B to the antibonding nature of the MO and thus the high energy in comparison to the MO before this. The s-orbital of the opposite phase of the H was not shown to be smeared in the LCAO. |
| 2e' | 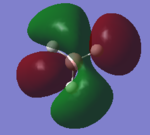 |
 |
There are internuclear node at the B atom and 2 nodal plane perpendicular across the B-H bond. The LCAO shows the p-orbital contribution of B to the antibonding nature of the MO and thus the high energy in comparison to the MO before this. The s-orbital of the opposite phase of the H was not shown to be smeared in the LCAO. |
BBr3
Optimisation of BH3: GEN level
D-Space Link of optimisation file DOI:10042/143692
Optimisation log file here
| summary data | convergence | Jmol | |||
|---|---|---|---|---|---|
|
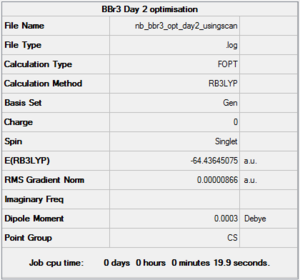
Item Value Threshold Converged? Maximum Force 0.000015 0.000450 YES RMS Force 0.000008 0.000300 YES Maximum Displacement 0.000100 0.001800 YES RMS Displacement 0.000058 0.001200 YES |
|
This molecule, BBr3 should have D3h symmetry i.e trigonal planar.
GaBr3
Optimisation of GaBr3: B3LYP/LANL2DZ level
Optimisation log file here
| summary data | convergence | Jmol | |||
|---|---|---|---|---|---|
|
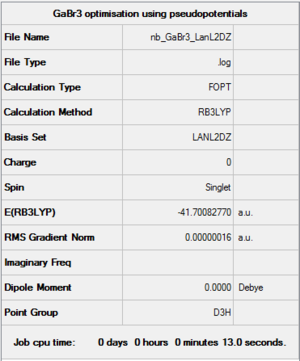
Item Value Threshold Converged? Maximum Force 0.000000 0.000450 YES RMS Force 0.000000 0.000300 YES Maximum Displacement 0.000003 0.001800 YES RMS Displacement 0.000002 0.001200 YES |
|
Optimisation of GaBr3: B3LYP/ 6-31G(d,p)level
Optimisation log file here
| summary data | convergence | Jmol | |||
|---|---|---|---|---|---|

|
Item Value Threshold Converged? Maximum Force 0.000072 0.000450 YES RMS Force 0.000047 0.000300 YES Maximum Displacement 0.000434 0.001800 YES RMS Displacement 0.000284 0.001200 YES |
|
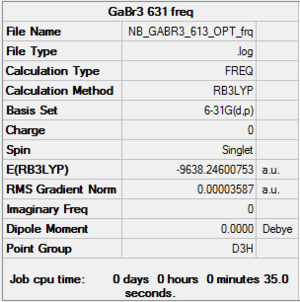
Frequency Analysis of GaBr3:B3LYP/6-31G(d,p) level
Frequency log file: here
| summary data | low modes |
|---|---|
|
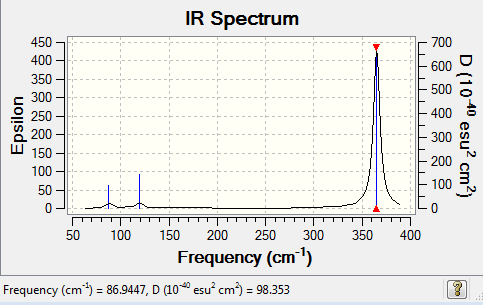
Low frequencies --- -3.3718 -3.3718 -2.7645 -0.0135 -0.0115 0.0139 Low frequencies --- 86.9447 86.9448 119.6983 |
Vibrational Analysis for GaBr3:B3LYP/6-31G(d,p)
| wavenumber | Intensity | IR active? | type |
| 87 | 2 | very slight | bend (rocking) |
| 87 | 2 | very slight | bend (scissoring) |
| 120 | 4 | very slight | bend (wagging i.e. umbrella motion) |
| 235 | 0 | no | symmetrical stretch |
| 365 | 62 | yes | asymmetrical stretch |
| 365 | 62 | yes | asymmetrical stretch |
Diagram 2:IR spectrum of GaBr3
NH3
The point group of NH3 miolecule is C3v as 3σv and 2C3.
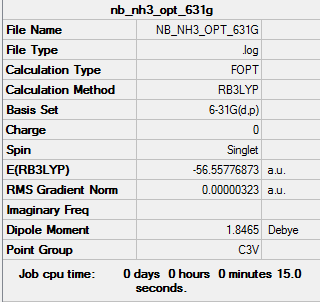
Optimisation Analysis of NH3: B3LYP/6-31G(d,p) level
Optimisation log file here
| summary data | convergence | Jmol | |||
|---|---|---|---|---|---|
|
Item Value Threshold Converged? Maximum Force 0.000006 0.000015 YES RMS Force 0.000004 0.000010 YES Maximum Displacement 0.000011 0.000060 YES RMS Displacement 0.000008 0.000040 YES |
|
NBO Analysis of NH3: B3LYP/6-31G(d,p) level
| Population Analysis | Summary of Natural Population Analysis | |
|---|---|---|
 |
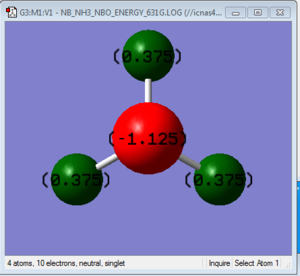 |
Summary of Natural Population Analysis:
               Natural
   Atom  No    Charge
----------------------
     N    1   -1.12514
     H    2    0.37505
     H    3    0.37505
     H    4    0.37505
=======================
  * Total *    0.00000
|
The charge distribution shows that N atom in NH3 is the only electronegative atom in the molecule and since the total charge of the molecule is zero, the remaining positive charge is distributed evenly to the H atoms. This is not a formal charge but relative to the atoms in the molecule itself.
| Bond orbital/ coefficients/ hybrids |
|---|
(Occupancy) Bond orbital/ Coefficients/ Hybrids
---------------------------------------------------------------------------------
    1. (1.99909) BD ( 1) N   1 - H   2
               ( 68.83%)   0.8297* N   1 s( 24.86%)p 3.02( 75.05%)d 0.00(  0.09%)

               ( 31.17%)   0.5583* H   2 s( 99.91%)p 0.00(  0.09%)

    2. (1.99909) BD ( 1) N   1 - H   3
               ( 68.83%)   0.8297* N   1 s( 24.86%)p 3.02( 75.05%)d 0.00(  0.09%)

               ( 31.17%)   0.5583* H   3 s( 99.91%)p 0.00(  0.09%)

    3. (1.99909) BD ( 1) N   1 - H   4
               ( 68.83%)   0.8297* N   1 s( 24.86%)p 3.02( 75.05%)d 0.00(  0.09%)

               ( 31.17%)   0.5583* H   4 s( 99.91%)p 0.00(  0.09%)

    4. (1.99982) CR ( 1) N   1           s(100.00%)

    5. (1.99721) LP ( 1) N   1           s( 25.38%)p 2.94( 74.52%)d 0.00(  0.10%)
|
The table above shows that the hybridisation of the atoms in the NH3 and also the contribution of each atom to the bond. For the N-H, N atom contributes 69% to the N-H bond.
| Natural Bond Orbital Summary |
|---|
Natural Bond Orbitals (Summary):
                                                           Principal Delocalizations
          NBO                        Occupancy    Energy   (geminal,vicinal,remote)
====================================================================================
Molecular unit  1  (H3N)
    1. BD (   1) N   1 - H   2          1.99909    -0.60417
    2. BD (   1) N   1 - H   3          1.99909    -0.60417
    3. BD (   1) N   1 - H   4          1.99909    -0.60417
    4. CR (   1) N   1                  1.99982   -14.16768
    5. LP (   1) N   1                  1.99721    -0.31757
|
Vibrational spectrum for NH3
| wavenumber | Intensity | IR active? | type |
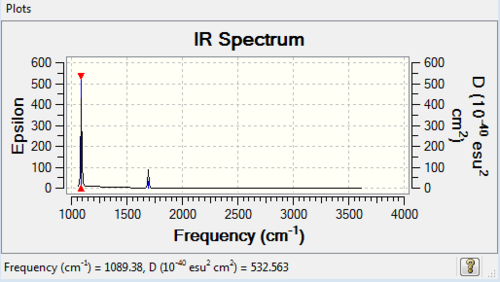
| 1089 | 145 | yes | bend |
| 1694 | 14 | very slight | bend |
| 1694 | 14 | very slight | bend |
| 3461 | 1 | no | stretch |
| 3591 | 0 | no | stretch |
| 3591 | 0 | no | stretch |
Diagram 3: IR Spectrum of NH3
MO analysis of NH3: B3LYP/6-31G(d,p) level with C3v symmetry
MO analysis of NH3 log file here
NH3BH3: B3LYP/6-31G(d,p) level with C3v symmetry
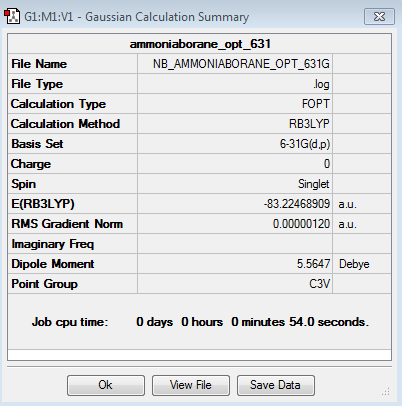
Optimisation of NH3BH3: B3LYP/6-31G(d,p) level with C3v symmetry
Optimisation log file here
| summary data | convergence | Jmol | |||
|---|---|---|---|---|---|
|
Item Value Threshold Converged? Maximum Force 0.000002 0.000015 YES RMS Force 0.000001 0.000010 YES Maximum Displacement 0.000023 0.000060 YES RMS Displacement 0.000010 0.000040 YES |
|
Frequency Analysis of NH3BH3: B3LYP/6-31G(d,p) level with C3v symmetry
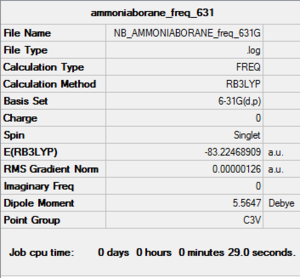
Frequency log file: here
| summary data | low modes |
|---|---|
|
Low frequencies --- -5.5864 -0.3039 -0.0444 0.0009 1.2177 1.2912 Low frequencies --- 263.2843 632.9623 638.4603 |
Vibrational spectrum for NH3BH3
| wavenumber | Intensity | IR active? | type |
| 263 | 0 | no | bend |
| 633 | 14 | very slight | stretch |
| 638 | 4 | very slight | bend |
| 638 | 4 | very slight | bend |
| 1069 | 41 | yes | bend |
| 1069 | 41 | yes | bend |
| 1196 | 109 | yes | bend |
| 1204 | 3 | yes | bend |
| 1204 | 3 | yes | bend |
| 1329 | 114 | yes | bend |
| 1676 | 28 | very slight | bend |
| 1676 | 28 | very slight | bend |
| 2472 | 67 | yes | stretch (symmetric) |
| 2532 | 231 | yes | stretch (anti-symmetric) |
| 2532 | 231 | yes | stretch (anti-symmetric) |
| 3464 | 3 | very slight | stretch (symmetric) |
| 3581 | 28 | yes | stretch (anti-symmetric) |
| 3581 | 28 | very slight | stretch (anti-symmetric) |
Determination of the dative bond energy
| Energy values | |
|---|---|
| E(NH3) | -148490 kJ/mol |
| E(BH3) | -69880 kJ/mol |
| E(NH3BH3) | -218510 kJ/mol |
| [E(NH3BH3)]- [E(NH3) + E(BH3)] | -140 kJ/mol |
BH3 molecule have an empty p-orbital on the B atom which makes it Lewis acid i.e. electron acceptor as it is electron deficient molecule. Therefore BH3 in reality does not exist on its own, it prefers to exist in dimer, usually with itself, thus forming BH3BH3 adduct. Based on the dissociation energy of NH3BH3 is lower compared to the constituents energy of NH3 and BH3 from the calcualtion, this indicates that the molecule prefers to be in NH3BH3 rather than in the constituents NH3 and BH3 as it provides stabilisation in adduct from.
Diagram 4:IR Spectrum of NH3BH3
Mini Project section
In this mini project, ionic liquid properties were analysed computationally suing Gaussian. In order to obtain a valid result when comparing the ionic liquids, the same method and basis set were used i.e B3LYP/6-31G(d,p) level. The point group of the ionic liquid are summarised bellow. It was noticed that there is a limitation with the Gaussian is that they analysed the molecule as it is drawn which is the case for [N(CH3)3CH2OH]+ where the torsion angle of the moelcule drawn had to be changed manually.
Comparison of selected 'onium' cations
| [N(CH3)4]+ | [P(CH3)4]+ | [S(CH3)3]+ | |
|---|---|---|---|
| r(E-Me) | 1.51 Å | 1.82 Å | 1.82 Å |
| r(C-H) | 1.09 Å | 1.09 Å | 1.09 Å |
| θ(Me-E-Me) | 109.5 ° | 109.5 ° | 102.7 ° |
| θ(H-C-H) | 110.0 ° | 109.0 ° | 109.4 ° |
| Point Group | Td | Td | C3v |
[N(CH3)4]+
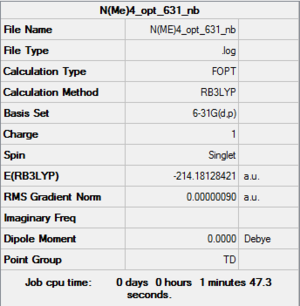
Optimisation Analysis of [N(CH3)4]+:B3LYP/6-31G level with Td symmetry
D-space of [N(CH3)4]+ optimisation file Link DOI:10042/157429
| summary data | convergence | Jmol | |||
|---|---|---|---|---|---|
|
Item Value Threshold Converged? Maximum Force 0.000003 0.000015 YES RMS Force 0.000001 0.000010 YES Maximum Displacement 0.000013 0.000060 YES RMS Displacement 0.000005 0.000040 YES |
|
Frequency Analysis
D-space of [N(CH3)4]+ frequency file Link DOI:10042/157433
| summary data | low modes |
|---|---|

|
Low frequencies --- -0.0004 -0.0004 0.0003 21.5288 21.5288 21.5288 Low frequencies --- 188.5489 292.6546 292.6546 |
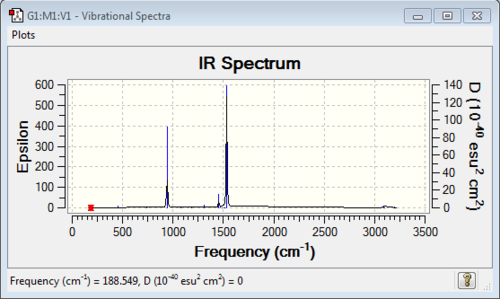
Vibrational Analysis for [N(CH3)4]+:
| wavenumber | Intensity | IR active? | type |
| 189 | 0 | no | bend |
| 293 | 0 | no | bend |
| 293 | 0 | no | bend |
| 293 | 0 | no | bend |
| 362 | 0 | no | bend |
| 362 | 0 | no | bend |
| 456 | 0 | no | bend |
| 456 | 0 | no | bend |
| 456 | 0 | no | bend |
| 736 | 0 | no | symmetric stretch |
| 941 | 22 | yes (very slight) | asymmetric stretch and bend |
| 941 | 22 | yes (very slight) | asymmetric stretch and bend |
| 941 | 22 | yes (very slight) | asymmetric stretch and bend |
| 1078 | 0 | no | bend |
| 1078 | 0 | no | bend |
| 1078 | 0 | no | bend |
| 1185 | 0 | no | bend |
| 1185 | 0 | no | bend |
| 1306 | 11 | yes (very slight) | bend |
| 1306 | 11 | yes (very slight) | bend |
| 1306 | 11 | yes (very slight) | bend |
| 1456 | 5 | yes (very slight) | bend |
| 1456 | 5 | yes (very slight) | bend |
| 1456 | 5 | yes (very slight) | bend |
| 1487 | 0 | no | bend |
| 1487 | 0 | no | bend |
| 1487 | 0 | no | bend |
| 1502 | 0 | no | bend |
| 1502 | 0 | no | bend |
| 1512 | 0 | no | bend |
| 1532 | 54 | yes | bend |
| 1532 | 54 | yes | bend |
| 1532 | 54 | yes | bend |
| 3087 | 1 | yes (very slight) | stretch (anti-symmetric) |
| 3087 | 1 | yes (very slight) | stretch (anti-symmetric) |
| 3096 | 0 | no | symmetrical stretch |
| 3189 | 0 | no | symmetrical stretch |
| 3189 | 0 | no | symmetrical stretch |
| 3189 | 0 | no | symmetrical stretch |
| 3190 | 0 | no | symmetrical stretch |
| 3195 | 1 | yes (very very slight) | symmetrical stretch |
| 3195 | 1 | yes (very very slight) | symmetrical stretch |
| 3195 | 1 | yes (very very slight) | symmetrical stretch |
Diagram 5:IR spectrum of [N(CH3)4]+
MO Analysis
D-space of [N(CH3)4]+ MO analysis file Link DOI:10042/157836
| Real MO | Comments | |
|---|---|---|
| Bonding | 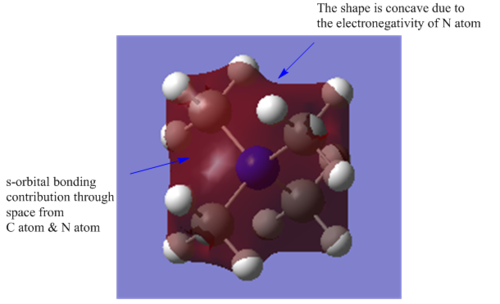 |
This is the highly bonding MO, where the s-orbital of N atom and C atoms contribute to the bonding of the MO, through space interactions. The MO are very delocalised across all the atoms. There is no nodes at all in this MO. |
| Bonding | 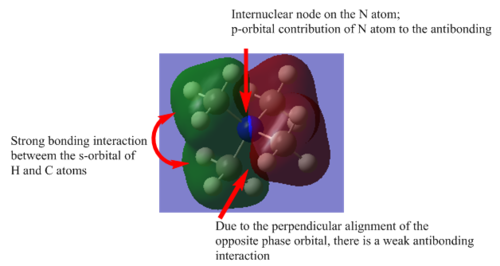 |
The existance of the node increases the energy of the bonding MO, together with the perpendicular alignment of the opposite phase. There are bonding through space interactions between the C and the H atoms on the methyl groups. There is no nodal plane. The MO is delocalised with respect to the 2 methyl groups. |
| Bonding | 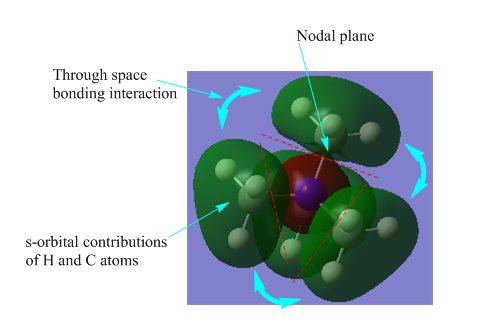 |
There are 3 nodal planes perpendicular through the N-C bonds and this contributes to the high energy thus the antibonding part. For the 4 methyl groups on the N atom, their s-orbital overlap and contributes to the bonding of the MO. The MO is not very delocalised as shown in the diagram, where the s-orbital of the N atom localised to itself. |
| Bonding | 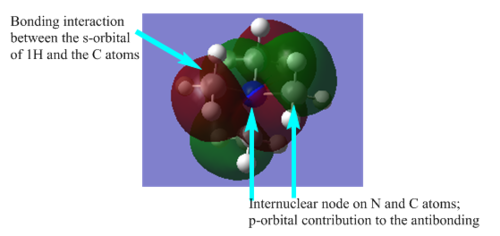 |
There are 5 nodes in the MO which contributes to the antibonding and high energy of the MO. The MO is mostly localised on the individual methyl group and the N atom. |
| Bonding | 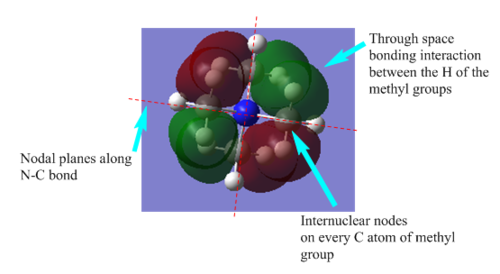 |
The existance of the 4 nodal planes along the C-N bonds and the 4 internuclear nodes on the C atoms of the methyl group contributes to the antibonding nature of the MO thus the high energy. There is partial through space bonding interactions of the s-orbitals of the H atoms of the methyl group. |
It is noted that only one of the degenerate orbitals of each energy level were analysed due to it redundancy.
NBO Analysis of [N(CH3)4]+
| Population Analysis | Summary of Natural Population Analysis | |
|---|---|---|
 |
 |
Summary of Natural Population Analysis:
               Natural
   Atom  No    Charge
-----------------------
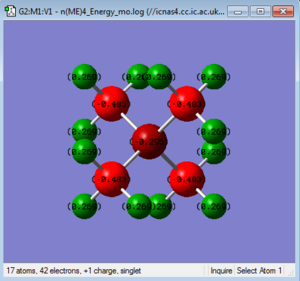
     N    1   -0.29516
     C    2   -0.48342
     H    3    0.26907
     H    4    0.26907
     H    5    0.26907
     C    6   -0.48342
     H    7    0.26907
     H    8    0.26907
     H    9    0.26907
     C   10   -0.48342
     H   11    0.26907
     H   12    0.26907
     H   13    0.26907
     C   14   -0.48342
     H   15    0.26907
     H   16    0.26907
     H   17    0.26907
=======================
  * Total *    1.00000
|
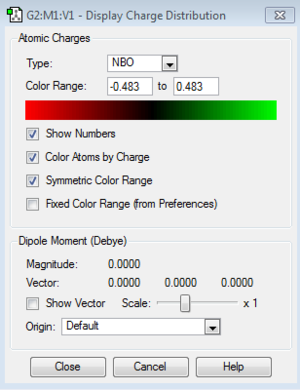
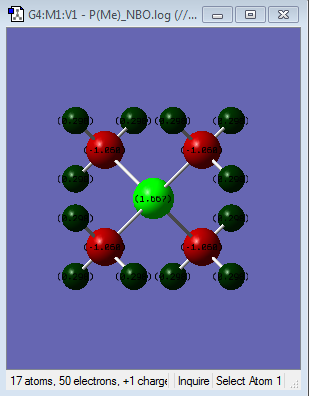
Looking at the summary of the population analysis, the total charge of the molecule i.e. +1 are divided for the atoms, with carbon being the most negative charge, then nitrogen and the positively charged hydrogen. It is an arbitrary assignment of charges, not electron density.
[P(CH3)4]+
B3LYP/6-31G(d,p) level
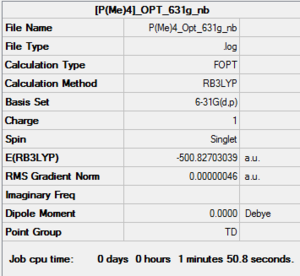
D-space of [P(CH3)4]+ optimisation file Link DOI:10042/158471
| summary data | convergence | Jmol | |||
|---|---|---|---|---|---|
|
Item Value Threshold Converged? Maximum Force 0.000001 0.000015 YES RMS Force 0.000000 0.000010 YES Maximum Displacement 0.000005 0.000060 YES RMS Displacement 0.000002 0.000040 YES |
|
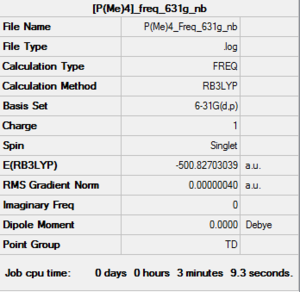
D-space of [P(CH3)4]+ frequency file Link DOI:10042/158506
| summary data | low modes |
|---|---|
|
Low frequencies --- -0.0017 -0.0011 0.0025 24.7242 24.7243 24.7243 Low frequencies --- 160.0696 194.8034 194.8034 |
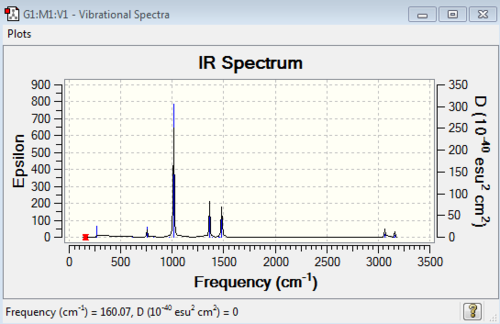
Diagram 6: IR Spectrum of [P(CH3)4]+
Vibrational spectrum for [P(CH3)4]+
| wavenumber | Intensity | IR active? | type |
| 160 | 0 | no | bend |
| 195 | 0 | no | bend |
| 195 | 0 | no | bend |
| 195 | 0 | no | bend |
| 223 | 0 | no | bend |
| 223 | 0 | no | bend |
| 271 | 2 | yes (very very slight) | bend |
| 271 | 2 | yes (very very slight) | bend |
| 271 | 2 | yes (very very slight) | bend |
| 615 | 0 | no | symmetrical stretch |
| 756 | 4 | yes (very very slight) | bend |
| 756 | 4 | yes (very very slight) | bend |
| 756 | 4 | yes (very very slight) | bend |
| 824 | 0 | no | bend |
| 824 | 0 | no | bend |
| 824 | 0 | no | bend |
| 973 | 0 | no | bend |
| 973 | 0 | no | bend |
| 1013 | 78 | yes | bend |
| 1013 | 78 | yes | bend |
| 1013 | 78 | yes | bend |
| 1362 | 21 | yes | bend |
| 1362 | 21 | yes | bend |
| 1362 | 21 | yes | bend |
| 1389 | 0 | no | bend |
| 1454 | 0 | no | bend |
| 1454 | 0 | no | bend |
| 1454 | 0 | no | bend |
| 1462 | 0 | no | bend |
| 1462 | 0 | no | bend |
| 1481 | 26 | yes | bend |
| 1481 | 26 | yes | bend |
| 1481 | 26 | yes | bend |
| 3064 | 5 | yes (very very slight) | asymmetric stretch |
| 3064 | 5 | yes (very very slight) | asymmetric stretch |
| 3064 | 5 | yes (very very slight) | asymmetric stretch |
| 3066 | 0 | no | symmetric stretch |
| 3157 | 0 | no | symmetric stretch |
| 3157 | 0 | no | symmetric stretch |
| 3158 | 0 | no | symmetric stretch |
| 3158 | 0 | no | symmetric stretch |
| 3160 | 4 | yes | symmetric stretch |
| 3160 | 4 | yes | symmetric stretch |
| 3160 | 4 | yes | symmetric stretch |
MO Analysis
D-space of [P(CH3)4]+ MO analysis file Link DOI:10042/160143
NBO Analysis of [P(CH3)4]+
| Population Analysis | Summary of Natural Population Analysis | |
|---|---|---|
 |
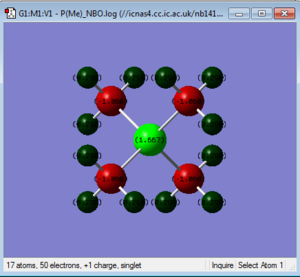 |
Summary of Natural Population Analysis:
               Natural
   Atom  No    Charge
-----------------------
     P    1    1.66680
     C    2   -1.06021
     H    3    0.29784
     H    4    0.29784
     H    5    0.29784
     C    6   -1.06021
     H    7    0.29784
     H    9    0.29784
     C   10   -1.06021
     H   11    0.29784
     H   12    0.29784
     H   13    0.29784
     C   14   -1.06021
     H   15    0.29784
     H   16    0.29784
     H   17    0.29784
=======================
  * Total *    1.00000
|
[S(CH3)3]+
B3LYP/6-31G level
D-space of [S(CH3)3]+ optimisation file Link DOI:10042/160621
| summary data | convergence | Jmol | |||
|---|---|---|---|---|---|

|
Item Value Threshold Converged? Maximum Force 0.000002 0.000015 YES RMS Force 0.000001 0.000010 YES Maximum Displacement 0.000054 0.000060 YES RMS Displacement 0.000017 0.000040 YES |
|
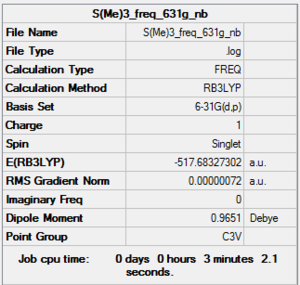
D-space of [S(CH3)3]+ frequency file Link DOI:10042/160634
| summary data | low modes |
|---|---|
|
Low frequencies --- -8.1009 -7.7505 -7.7472 -0.0025 0.0018 0.0090 Low frequencies --- 161.9980 199.6776 199.6776 |
Vibrational spectrum for [S(CH3)3]+
| wavenumber | Intensity | IR active? | type |
| 162 | 0 | no | bend |
| 200 | 0 | no | bend |
| 200 | 0 | no | bend |
| 255 | 0 | no | bend |
| 255 | 0 | no | bend |
| 285 | 0 | no | bend |
| 624 | 2 | yes (very very slight) | symmetrical stretch |
| 704 | 1 | yes (very very slight) | asymmetrical stretch |
| 704 | 1 | yes (very very slight) | asymmetrical stretch |
| 918 | 0 | no | bend |
| 958 | 1 | yes (very very slight) | bend |
| 958 | 1 | yes (very very slight) | bend |
| 1071 | 11 | yes | bend |
| 1071 | 11 | yes | bend |
| 1076 | 12 | yes | bend |
| 1371 | 0 | no | bend (umbrella motion of 2 methyl group) |
| 1371 | 0 | no | bend (umbrella motion of 2 methyl group) |
| 1408 | 2 | yes (very very slight) | bend (umbrella motion of all methyl group) |
| 1452 | 0 | no | bend (scissoring) |
| 1464 | 10 | yes | bend (scissoring of Me groups) |
| 1464 | 10 | yes | bend (scissoring of Me groups) |
| 1473 | 25 | yes | bend (scissoring of Me groups) |
| 1473 | 25 | yes | bend (scissoring of Me groups) |
| 1485 | 42 | yes | bend (scissoring of Me groups) |
| 3074 | 0 | no | symmetrical stretch |
| 3075 | 3 | yes (very very slight) | asymmetrical stretch |
| 3075 | 3 | yes (very very slight) | asymmetrical stretch |
| 3184 | 0 | no | symmetrical stretch |
| 3185 | 8 | yes | symmetrical stretch |
| 3185 | 8 | yes | symmetrical stretch |
| 3187 | 3 | yes (very very slight) | symmetrical stretch |
| 3187 | 2 | yes (very very slight) | asymmetrical stretch |
| 3187 | 2 | yes (very very slight) | asymmetrical stretch |
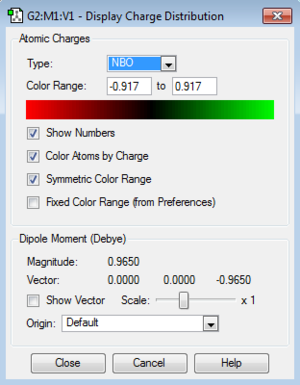
NBO Analysis of [S(CH3)3]+
| Population Analysis | Summary of Natural Population Analysis | |
|---|---|---|
 |
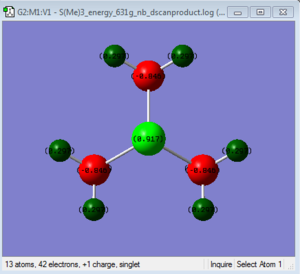 |
Summary of Natural Population Analysis:
               Natural
   Atom  No    Charge
-----------------------
     P    1    1.66680
     C    2   -1.06021
     H    3    0.29784
     H    4    0.29784
     H    5    0.29784
     C    6   -1.06021
     H    7    0.29784
     H    8    0.29784
     H    9    0.29784
     C   10   -1.06021
     H   11    0.29784
     H   12    0.29784
     H   13    0.29784
     C   14   -1.06021
     H   15    0.29784
     H   16    0.29784
     H   17    0.29784
=======================
  * Total *    1.00000
|
Comparing the different ionic liquids
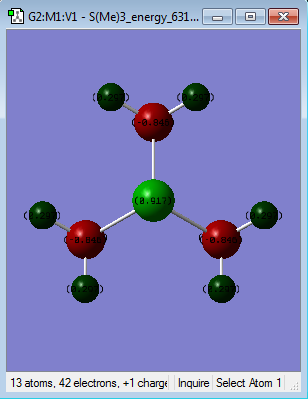
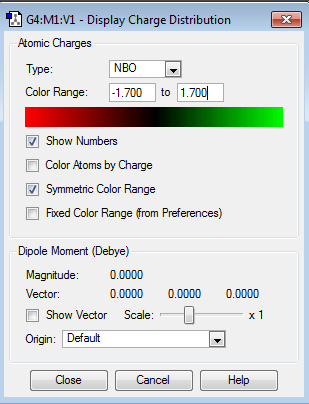
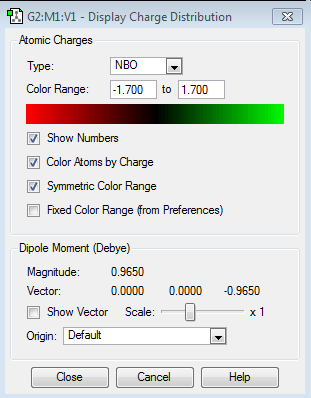
NBO analysis was used to compare and contrast the charge distribution across the ionic liquids with different cations i.e. Nitrogen, Phosphoros and Sulfur.
| X contribution to C-X | X hybridisation | C contribution to C-X | C hybridisation | |
|---|---|---|---|---|
| N | 66% | 25%s+75%p i.e. sp3 | 34% | 21%s+79%p i.e sp3 |
| P | 40% | 25%s+74%p+1%d i.e. sp2d | 60% | 25%s+75%p i.e. sp3 |
| S | 51% | 17%s+82%p+1%d | 49 % | 20%s+80%p i.e i.e. sp4 |
The electronegativity N=3.0, S=2.5 and P=2.1 and this gives different contribution to the C-X bond as shown.
| [N(CH3)4]+ | [P(CH3)4]+ | [S(CH3)3]+ | |
|---|---|---|---|
| Specific NBO charges | 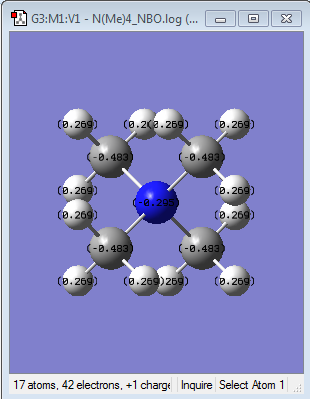 |
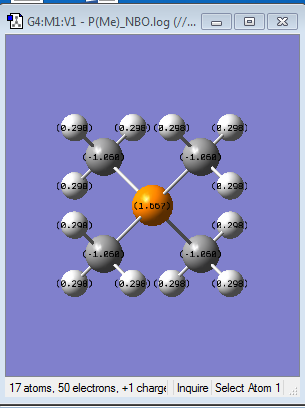 |
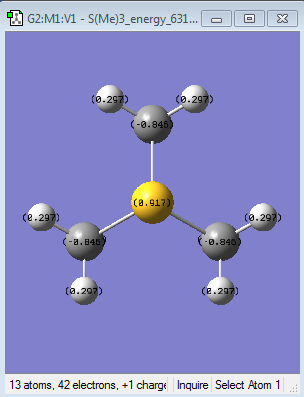
|
| Colour atom by charge | 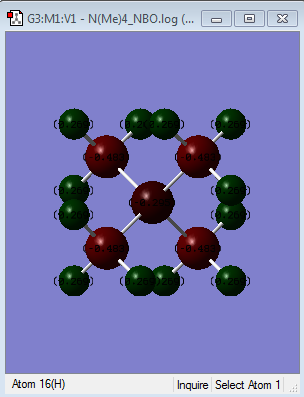 |
 |
|
| NBO Charge Distribution |  |
 |
|
Influence of Functional Group
In this section, the effect of functional groups replacing one of the methyl group on the N(Me) were analysed. Hydroxyl and nitrile fucntional group were used. OH is an electron donating group and CN is the electron withdrawing group.By doing this, two different effect can be compared with the control i.e. [N(CH3)4]+. By carrying out MO and NBO analysis on [N(Me)3(FG)]+ where FG is the respective functional group, the charge distribution and their effect on the HUMO and LUMO of the three compounds i.e. [N(CH3)4]+, [N(CH3)3(CH2OH)]+ and [N(CH3)3(CH2CN)]+ can be analysed.
[N(CH3)3(CH2OH)]+
Optimisation of [N(CH3)3(CH2OH)]+: B3LYP/6-31G(d,p) level
Charge= 1, Spin: singlet
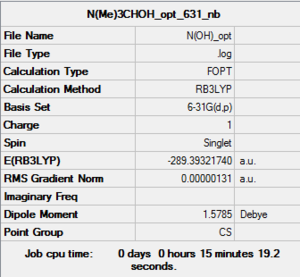
D-space of [N(CH3)3(CH2OH)]+:B3LYP/6-31G level optimisation file Link DOI:10042/161009
| summary data | convergence | Jmol | |||
|---|---|---|---|---|---|
|
Item Value Threshold Converged? Maximum Force 0.000002 0.000015 YES RMS Force 0.000001 0.000010 YES Maximum Displacement 0.000054 0.000060 YES RMS Displacement 0.000017 0.000040 YES |
|
Frequency analysis of [N(CH3)3(CH2OH)]+: B3LYP/6-31G(d,p) level
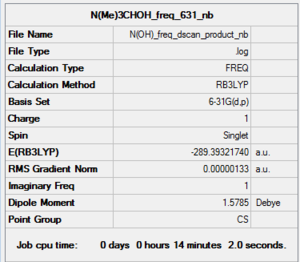
D-space of [N(CH3)3(CH2OH)]+:B3LYP/6-31G level frequency file Link DOI:10042/161011
| summary data | low modes |
|---|---|
|
Low frequencies --- -118.5298 -7.0356 -6.6962 -4.9877 0.0006 0.0009 Low frequencies --- 0.0012 129.5539 217.2942 |
Using a 'high' 6-31G(d,p) level basis set does not gave a good result as shown in the above table. The 'low frequency' values are too largely negative, -118.529 as shown above. Thus, using a 'medium' basis set, LanL2DZ but maintain the same method of B3LYP, we got an approximately good 'low frequency' in comparison to the higher basis set, 6-31G (d,p) level.
Optimisation of [N(CH3)3(CH2OH)]+: B3LYP/LanL2DZ level
Charge= 1, Spin: singlet
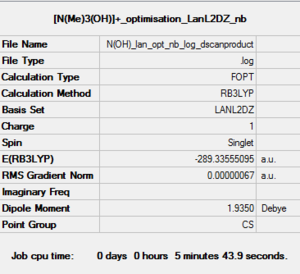
D-space of [N(CH3)3(CH2OH)]+:B3LYP/LanL2DZ level optimisation file Link DOI:10042/161016
| summary data | convergence | Jmol | |||
|---|---|---|---|---|---|
|
Item Value Threshold Converged? Maximum Force 0.000002 0.000015 YES RMS Force 0.000000 0.000010 YES Maximum Displacement 0.000008 0.000060 YES RMS Displacement 0.000003 0.000040 YES |
|
Frequency analysis of [N(CH3)3(CH2OH)]+: B3LYP/LanL2DZ level
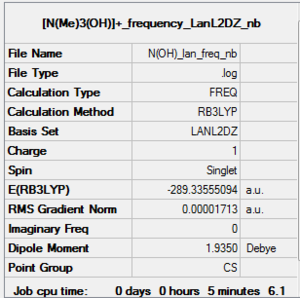
D-space of [N(CH3)3(CH2OH)]+:B3LYP/LanL2DZ level frequency file Link DOI:10042/161017
| summary data | low modes |
|---|---|
|
Low frequencies --- -8.4520 -7.3510 -5.5751 -0.0009 -0.0001 0.0009 Low frequencies --- 90.9596 107.4403 191.6445 |
As noted before using medium basis set, LanL2DZ for [N(CH3)3(CH2OH)]+ gave a good low frequency but it is not accurate. LanL2DZ i.e Pseudo-potential should only be used on heavy atoms, row threee Therefore the result that were obtained using LanL2DZ will not be used.
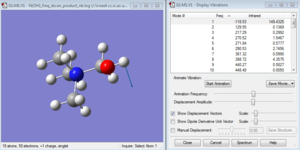
After doing the animated vibration of [N(CH3)3(CH2OH)]+:B3LYP/6-31g with Cs point group symmetry, it shows that the O-H group was doing the bending motion in one plane only as shown in the diagram as evident with the 'displacement vector'.
With Gaussian, drawing the molecule can mislead us to having different point group. In [N(CH3)3(CH2OH)]+ case, we have to manually change the torsion angle between H-C-O as shown in the diagram as (1), (2) and (3) respectively. We do this to make the OH group to have more rotational freedom.
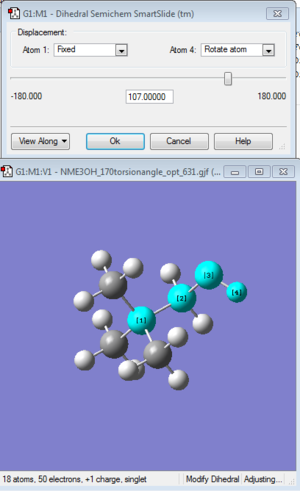
Optimisation of [N(CH3)3(CH2OH)]+: B3LYP/6-31G(d,P) level with torsion angle of 107°
Charge= 1, Spin: singlet with torsion angle between C-N and C-O as 107°.
D-space of [N(CH3)3(CH2OH)]+:B3LYP/6-31G(d,P) level optimisation file Link DOI:10042/155637
| summary data | convergence | Jmol | |||
|---|---|---|---|---|---|

|
Item Value Threshold Converged? Maximum Force 0.000002 0.000015 YES RMS Force 0.000001 0.000010 YES Maximum Displacement 0.000053 0.000060 YES RMS Displacement 0.000013 0.000040 YES |
|
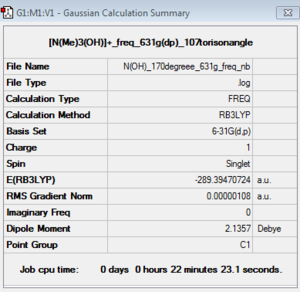
Frequency analysis of [N(CH3)3(CH2OH)]+: B3LYP/6-31G(d,P) level with torsion angle of 107°
D-space of [N(CH3)3(CH2OH)]+:B3LYP/6-31G(d,P) level frequency file Link DOI:10042/161032
| summary data | low modes |
|---|---|
|
Low frequencies --- -8.5281 -5.1364 -1.6469 -0.0015 -0.0013 -0.0013 Low frequencies --- 131.0879 213.4335 255.7052 |
MO analysis of [N(CH3)3(CH2OH)]+: B3LYP/6-31G(d,P) level with torsion angle of 107°
D-space of [N(CH3)3(CH2OH)]+:B3LYP/6-31G(d,P) level MO analysis file Link DOI:10042/161034
[N(CH3)3(CH2CN)]+
Optimisation of [N(CH3)3(CH2CN)]+: B3LYP/6-31G level
D-space of [N(CH3)3(CH2CN)]+ optimisation file Link DOI:10042/155621
| summary data | convergence | Jmol | |||
|---|---|---|---|---|---|
|
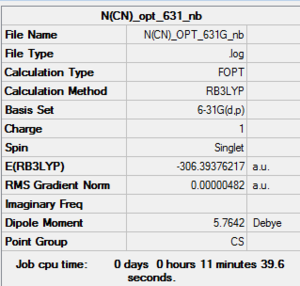
Item Value Threshold Converged? Maximum Force 0.000009 0.000015 YES RMS Force 0.000003 0.000010 YES Maximum Displacement 0.000052 0.000060 YES RMS Displacement 0.000015 0.000040 YES |
|
Frequency analysis of [N(CH3)3(CH2CN)]+: B3LYP/6-31G level
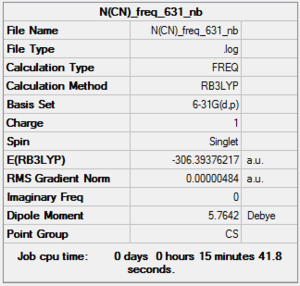
D-space of [N(CH3)3(CH2CN)]+ frequency file Link DOI:10042/155618
| summary data | low modes |
|---|---|
|
Low frequencies --- -4.0768 -0.0009 -0.0004 0.0004 2.3693 3.6124 Low frequencies --- 91.8337 153.9482 212.0313 |
MO analysis of [N(CH3)3(CH2CN)]+: B3LYP/6-31G level
D-space of [N(CH3)3(CH2CN)]+ MO analysis file Link DOI:10042/161035
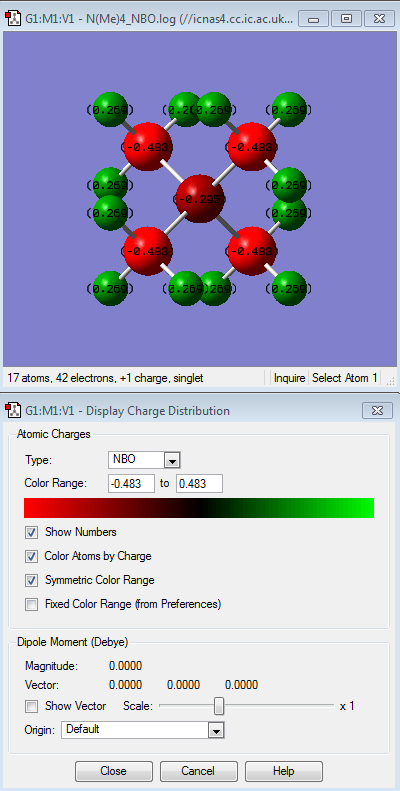
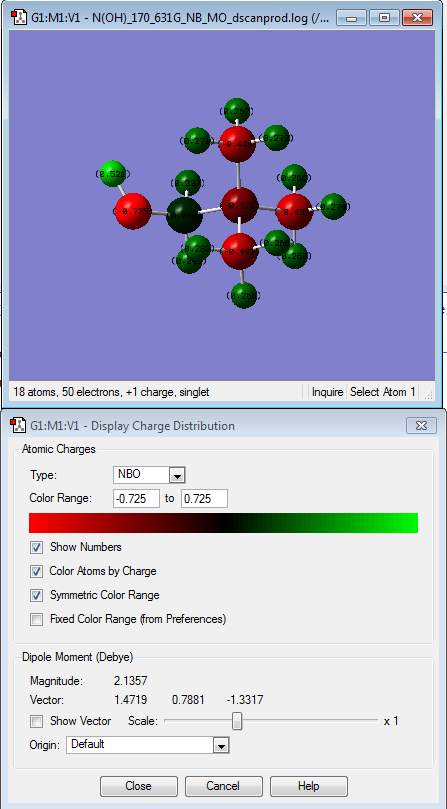
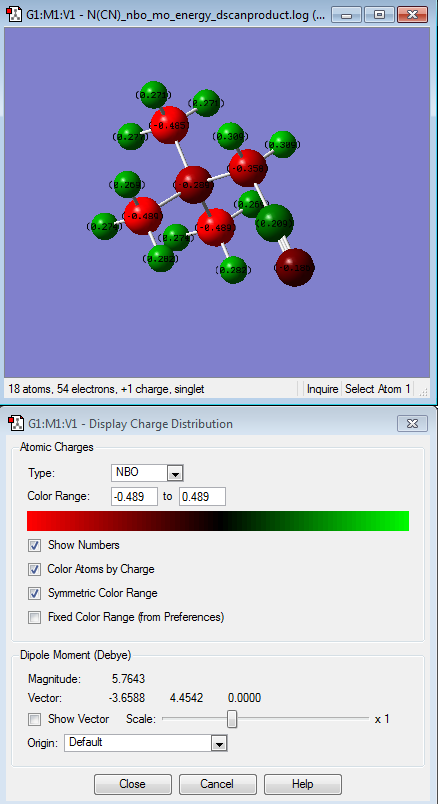
NBO analysis of [N(CH3)3(CH2OH)]+ and [N(CH3)3(CH2CN)]+ compared with [N(CH3)4]+
| [N(CH3)4]+ | [N(CH3)3(CH2OH)]+ | [N(CH3)3(CH2CN)]+ |
|---|---|---|
 |
 |
|
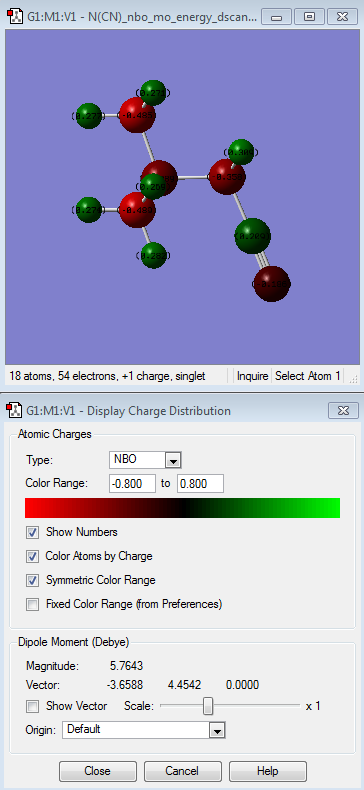
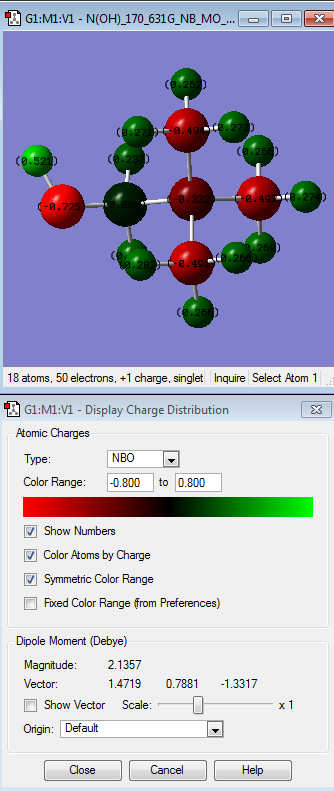
After comparing the charge distribution of [N(CH3)3(CH2OH)]+, [N(CH3)3(CH2CN)]+ and [N(CH3)4]+, it was found that the [N(CH3)3(CH2OH)]+ has the largest charge range of -o.725 to + o.725. Therefore the charge range was modified for the next step in order
| [N(CH3)4]+ | [N(CH3)3(CH2CN)]+ | [N(CH3)3(CH2OH)]+ | |
|---|---|---|---|
| Specific NBO charges and Colour atom by charge | 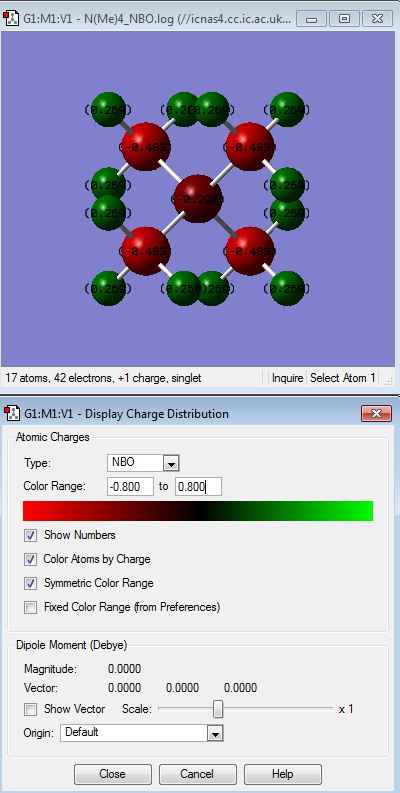 |
 |
|
| Molecule | Comments |
|---|---|
| [N(CH3)4]+ | There is not a wide range of difference between the atoms where the most electropostively charged is the hydrogen atoms (indicated by the bright green colour) followed by nitrogen (dark red colour) and carbon being the most electronegative relative to the other atoms (indicated by its bright red colour). This contradicts the idea that N atom is more electronegative than C atom i.e. N= 3.0 while C=2.5 by Pauling scale. This might be due to H atoms donating its electron density to the C atoms. |
| [N(CH3)3(CH2CN)]+ | The one that is interesting in here is the different relative electornegativity of the nitrogen atoms which depends on their neighbouring atoms. H atoms is the most relatively positive charge (indicated by the light green colour) followed by C atoms, then N atom (which connected to other methyl groups, the central N atom) and N (of the nitrile group) being the most electronegative atom relative to the other atoms in the molecule itself. This is due to CN being electron withdrawing group. |
| [N(CH3)3(CH2OH)]+ | The hydrogen atom of the hydroxyl group is the most electropositive charged followed by H atoms of the methyl group then C atom (that is attached to the hydroxyl group), followed by N atom and lastly, C of the methyl groups. The hydrogen atom of the hydroxyl group is the most electropositive because while O atom is an electron-withdrawing group, thus takes the electron density of the hydrogen atom it is attached to. |
Comparing HOMO and LUMO [N(CH3)4]+, [N(CH3)3(CH2OH)]+, [N(CH3)3(CH2CN)]+
| [N(CH3)4]+ | [N(CH3)3(CH2OH)]+ | [N(CH3)3(CH2CN)]+ | |
|---|---|---|---|
| HOMO | 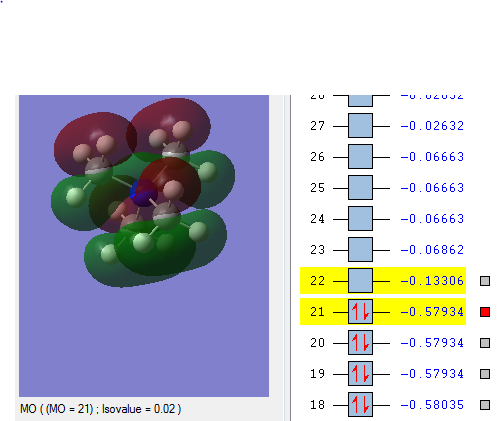 |
 |
|
| LUMO | 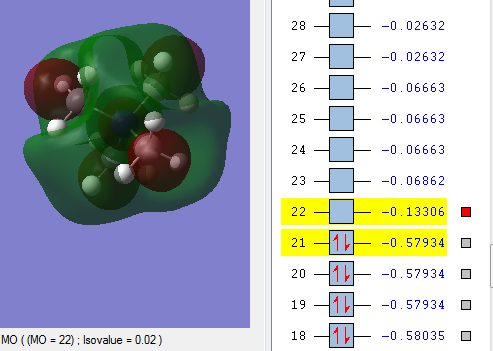 |
 |
|
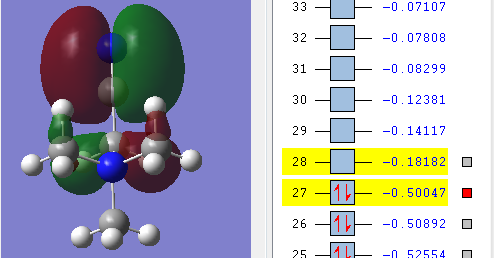
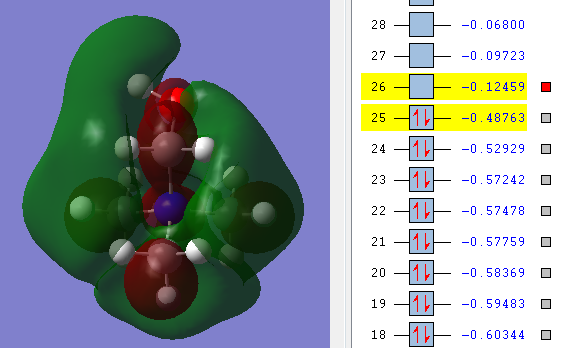
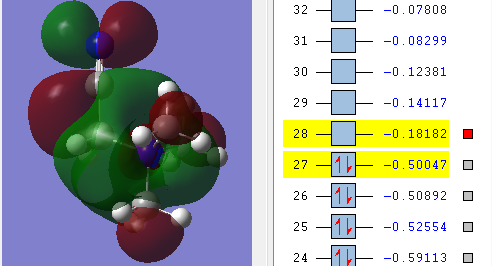
| Energy difference between HOMO and LUMO | 0.44628 | 0.36304 | 0.31865 |
In terms of the HOMO of the molecule;
| [N(CH3)4]+ | [N(CH3)3(CH2OH)]+ | [N(CH3)3(CH2CN)]+ | |
|---|---|---|---|
| Energy of HOMO | The energy of the HOMO is the lowest in energy in comparison to the other molecules being compared, which indicates that [N(CH3)4]+ is the most bonding and thus less reactive relative to the other two molecules i.e 0.57934 a.u. | The energy of the HOMO is the highest among the molecule being compared i.e. 0.48763 a.u. and this makes the molecule reactive in comparison. Having an electron donating group and electron withdrawing group by induction shifted the energy of the HOMO up the most when compared with having just electron withdrawing functional group. | The energy of the HOMO is in the middle among the molecules being compared i.e. 0.50047 a.u. Having an electron withdrawing group shifted the HOMO energy up, causing it to be more reactive relative to with just [N(CH3)4]+. |
| Energy of LUMO | The energy of the LUMO is 0.13306 a.u. and this is the 'control' where the effect of having electron withdrawing and electron doanmting functional group is examined | The energy of the LUMO is 0.12459 a.u. The energy of the LUMO shifted up, making it more reactive as it is less stable | The energy of the LUMO is 0.18182 a.u. the energy of the LUMOn shifted down, thus it is more stable and less reacitive. |
| HOMO-LUMO gap | The HOMO-LUMO gap for [N(CH3)4]+ is 0.44628 a.u. which is the largest gap in comparison to the other two molecules. This means that large amount of energy is required to excite electron from ground state to its excited state thus signifies the stability of [N(CH3)4]+. Therefore [N(CH3)4]+ is least reactive among the molecules being compared. | The HOMO-LUMO gap for [N(CH3)3(CH2OH)]+ is 0.36304 a.u. which is in the middle compared with the [N(CH3)4]+ and [N(CH3)3(CH2CN)]+. OH being electron-donating group makes the molecules not as reactive as having CN as a functional group but it is still more reactive than [N(CH3)4]+ | CN being electron-withdrawing functional group have the smallest energy gap between the HOMO and its LUMO, therefore it requires the least energy to excite electron from the ground state to the excited state. This causes them to be the least stable and thus the most reactive among the molecules being compared. |
The HUMO and LUMO is called the frontier orbital which can be used to predict the chemical reactivity of the molecules. [[6]] In summary, the order of chemical reactivity (from more reactive to least reactive relative to each other) are [N(CH3)3(CH2CN)]+ > [N(CH3)3(CH2OH)]+ > [N(CH3)4]+ with respect to their HOMO-LUMO gap where large HOMO-LUMO gap signifies their stability as a molecule.
In terms of the shapes of the orbitals,
| Molecule | Comments on the shape of the HOMO |
|---|---|
| [N(CH3)4]+ | 5 internuclear nodes i.e. 4 on the carbon atoms and 1 on the nitrogen atoms. |
| [N(CH3)3(CH2OH)]+ | 6 internuclear nodes, with 1 nodal plane through H-C-O-H. The HOMO of [N(CH3)3(CH2OH)]+ has the highest energy relative to the [N(CH3)4]+ and [N(CH3)3(CH2CN)]+. |
| [N(CH3)3(CH2CN)]+ | 5 internuclear nodes and 1 nodal plane through the nitrile group. |
The higher the number of nodes or nodal, it causes the MO to be less bonding thus higher in energy and the result agrees with the energy level values.
| Molecule | Comments on the shape of the LUMO |
|---|---|
| [N(CH3)4]+ | The LUMO of [N(CH3)4]+ has the most delocalised electron density when compared with [N(CH3)3(CH2OH)]+ and [N(CH3)3(CH2CN)]+, therefore [N(CH3)4]+ is the most bonding MO (as evident by the energy level) and the most stable relatively thus the least reactive. |
| [N(CH3)3(CH2OH)]+ | The shape of the HOMO is more diffuse around OH. |
| [N(CH3)3(CH2CN)]+ | The shape of the MO is localised on the CN. |
For molecule with electronegative substituent, for the molecule to be reactive, i.e. to be readily accept electron from a donor, the LUMO is preferably low in energy while the HOMO is high in energy.
In summary, the shapes of the orbital shows the effect of the functional group on the MO. The more electronegative the functional group i.e. CN in comparison to OH, the more localised the electron density in the functional group. The electron density is seen to be more diffuse in [N(CH3)3(CH2OH)]+.
Conclusion
| BH3 | BBr3 | GaBr3 | |
|---|---|---|---|
| r(E-X) | 1.19 Å | 1.93 Å | 2.39 Å |
| θ(X-E-X) | 120.0 ° | 120.0 ° | 120.0° |
Where E is the main group element and X is either H and Br with respect to the molecule analysed. The data from this table were obtained from the optimised molecules.
As shown in the table 1 above, changing the ligand H and Br will not change the point group of the molecule i.e. D3h, a trigonal planar molecule with a bond angle of 120°. The bond lengths of B-E (where E= H or Br) are different as we changed the ligand type to a more electronegative ligand i.e. Br, which is a weak field ligand.
Different central element have a significant effect on the bond length of the central atom to the ligand as shown in the table 1. While both Boron and Gallium have the bond angle which indicates that they have a trigonal planar structure thus D3h point group, they are different in terms of their effect on the bond length.
Camparison of GaBr3 and BH3 molecules
GaBr3 and BH3 molecules vibration spectra were compared and it was found out that there is a large difference in the values of the frequencies of the GaBr3 and BH3 molecules. Both molecules were analysed under the same method B3LYP with basis set of 6-31G(d,p).
| GaBr3 | BH3 | |
|---|---|---|
| Frequency |  |

|
| Displacement Vector | 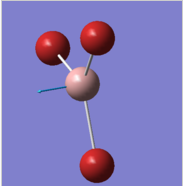 |
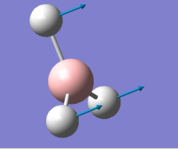
|
| Modes | 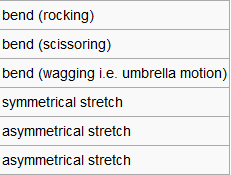 |
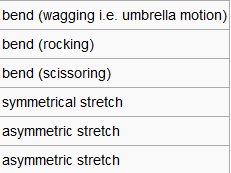
|
In the frequency row, the frequency of the umbrella motion is highlighted in blue as shown. For the modes of GaBr3 and BH3 molecules, the frequencies of the modes decreases down the column of the modes. Between these two molecules, the umbrella motion is an interesting part to discuss. As shown in the 'displacement vector' row of the table above, different atoms are doing the displacement. For the heavy molecule, GaBr3 the Ga atoms were the one that is doing the displacement. This is due to the fact that Br atom are slightly heavier than Ga atom. For BH3, the H atoms were the one doing the displacement as it is obviously lighter in mass in comparison to B atom. It is deduced then that for the umbrella motion, the lighter atom relative to the other atoms in the molecules will do the displacement. The arrangement of the modes between the two molecules were almost similar but the frequecy of the respective molecule's umbrella motion the focus of this discussion. Both the frequency and the intensity of this vibration varied greatly between these molecules. The frequency of these vibrational motion is proportional to the bond strength and inversely proportional to the mass of the molecule as shown by the Simple Harmonic Motion formula. Therefore since the mass of the GaBr3 molecule is heavier in total in comparison to BH3 molecule, the frequency is thus lower for the umbrella motion of the GaBr3 molecule when compared with BH3 molecule. The bond length of Ga-Br is 2.26 Å while for B-H it is 1.19 Å, therefore the longer the bond, the weaker the strength of the bond as evident by the dissociation energy of the bond.

Traditional versus computational
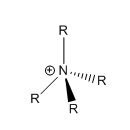
Traditionally, the positive charge on [NR4]+ molecule would be on the nitrogen centre but looking at the table above on the 'colour atom by charge' of [N(CH3)4]+, the green colour of the hydrogen atoms reflects the relative positive charge. The colour of the carbon atoms and the nitrogen having almost the same shade of red which reflects the relative δ- of the atoms. Among nitrogen, carbon and hydrogen atoms, their relative electronegativity from highest to lowest are N(3.0), C(2.5) and H (2.1), thus hydrogen atoms are the most electropostive one and this is proven by the relative 'colour by charge' diagram shown in the above table. By computational method, the the positive charge is actually located on the hydrogen atoms. Traditionally, the formal postivite charge on the nitrogen atom represent the nitrogen donating its lone pair of electrons to form bond with the R group, in this case, methyl.
In conclusion, higher basis set used, the higher the accuracy as shown in BH3 case and the closer the value is to the experimental value. Changing the ligand affects the frequency which depends on the size of the ligand and its mass. The heavier the ligand, the lower the frequency because frequency is inversely proportional to the mass as discussed previously.
In terms of functional group, using an eletron donating fucntional group decreases the HOMO-LUMO gap thus increase the molecule reactivity.
Further Study
Gaussian can also be used to predict the NMR of the molecules. It is interesting to use this to analyse computationally on how the chemical shift of a atom changes in different molecule environment, whether its different bonding type or different atoms its bonded to.
References
1. J. B. Foresman and A. Frisch, Exploring Chemistry with Electronic Structure Methods, Gaussian, Inc. U.S.A, 2nd Ed., 1993 and URL: http://hyperphysics.phy-astr.gsu.edu/hbase/shm.html for equation reference.
2. URL: http://www.wiredchemist.com/chemistry/data/bond-energies-lengths
3.URL: http://www.pearsonhighered.com/blbmw13einfo/assets/pdf/blbmw-ch09.pdf
4. URL: http://scitation.aip.org/content/aip/journal/jcp/96/5/10.1063/1.461942

