User:Lx812
EX3 Section
BH3
B3LYP/3-21G level Optimisation
Optimisation log file here
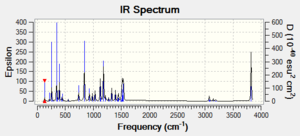
The point group of BH3 should be D3h, not Cs. So the optimisation at 3-21G level, which is not a very good basis set, did not optimise the BH3 molecule to minimum.
B3LYP/6-31G(d,p) level Optimisation
Optimisation log file here
| summary data | convergence | Jmol | |||
|---|---|---|---|---|---|
|
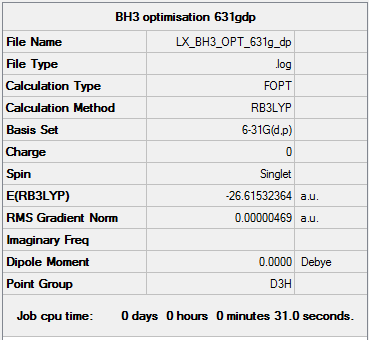
Item Value Threshold Converged? Maximum Force 0.000009 0.000015 YES RMS Force 0.000006 0.000010 YES Maximum Displacement 0.000037 0.000060 YES RMS Displacement 0.000024 0.000040 YES |
|
B3LYP/6-31G(d,p) level Frequency
Frequency log file: here
| summary data | low modes |
|---|---|
|
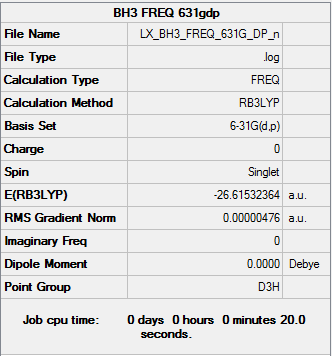
Low frequencies --- -14.0794 -14.0749 -10.2229 0.0005 0.0178 0.3562 Low frequencies --- 1162.9548 1213.1257 1213.1259 |
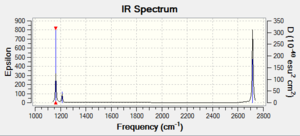
Vibrational spectrum
| wavenumber | Intensity | IR active? | type |
| 1163 | 93 | Yes | Bend |
| 1213 | 14 | Yes,very slight | Bend |
| 1213 | 14 | Yes,very slight | Bend |
| 2583 | 0 | No | Stretch |
| 2716 | 126 | Yes | Stretch |
| 2716 | 126 | Yes | Stretch |
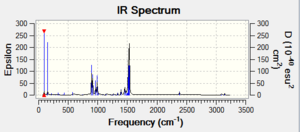
As shown in the table above, the frequency calculation gives 6 vibrations of BH3 while the computed IR Spectrum gives only 3 peaks at 1163, 1213 and 2716 cm-1. The peaks at 1213 and 2716 cm-1 each represents a pair of vibrations with the same wavenumber and intensity values. The 2716 cm-1 peak is due to the asymmetric stretch of B-H bonds. The vibration at 1163 cm-1 is an umbrella bend of the molecule. The vibrations that does not shown in the spectrum is the one of 2583 cm-1. It is a stretch along 3 B-H bonds which cancels each other out and do not have a dipole moment change, giving rise to zero intensity and therefore it is not IR active.
BH3 MO
Population Analysis file: DOI:10042/158157
The real MOs computed are quite different from the LCAO MOs.
In LCAO MOs, the orbitals are not distorted by each other. They are still in spherical shape (s orbital) or in dumbbell shape (p orbital). In comparison, the real MOs showed the interaction between orbitals. When there is a bonding interaction, the orbitals would overlap with each other. The electron densities combine and there is an increasing electron density in the region between the nuclei. For an anti-bonding interaction, the electron density decreases and there is a nodal plane between nuclei where the possibility of finding an electron is zero. What is more, the real MOs can demonstrate the degree of bonding overlap. If the bonding interaction is weak, the electron density would only overlap slightly.
The real MOs help visualize the actual electron density and prove that the qualitative MO theory is correct but not very accurate on the MO shape. So MO diagram and LCAO is useful in predicting the rough shape of MO but it has limitation.
GaBr3
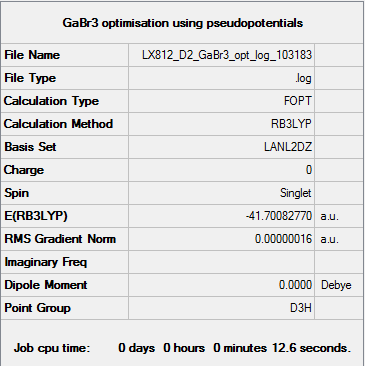
B3LYP/LANL2DZ level Optimisation
Optimisation file: DOI:10042/143686
| summary data | convergence | Jmol | |||
|---|---|---|---|---|---|
|
Item Value Threshold Converged? Maximum Force 0.000000 0.000450 YES RMS Force 0.000000 0.000300 YES Maximum Displacement 0.000003 0.001800 YES RMS Displacement 0.000002 0.001200 YES |
|
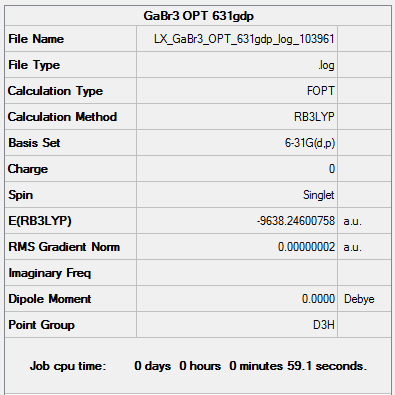
B3LYP/6-31G(d,p) level Optimisation
Optimisation file: DOI:10042/161021
| summary data | convergence | Jmol | |||
|---|---|---|---|---|---|
|
Item Value Threshold Converged? Maximum Force 0.000000 0.000015 YES RMS Force 0.000000 0.000010 YES Maximum Displacement 0.000000 0.000060 YES RMS Displacement 0.000000 0.000040 YES |
|
B3LYP/6-31G(d,p) level Frequency
Frequency file: DOI:10042/161020
| summary data | low modes |
|---|---|

|
Low frequencies --- -2.3851 -2.3850 -1.4167 0.0189 0.0197 0.0355 Low frequencies --- 86.9740 86.9741 119.7677 |
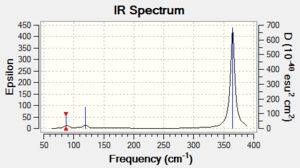
Vibrational spectrum for GaBr3
| wavenumber | Intensity | IR active? | type |
| 87 | 2 | Yes,very slight | Bend |
| 87 | 2 | Yes,very slight | Bend |
| 120 | 4 | Yes,very slight | Bend |
| 235 | 0 | No | Stretch |
| 365 | 62 | Yes | Stretch |
| 365 | 62 | Yes | Stretch |
The symmetric stretch along 3 Ga-Br bonds cancels each other out giving a net vibration with zero intensity at 235 cm-1, so it is not shown in the spectrum although this vibration does exist. The small peak at 87cm-1 stands for 2 bends with very weak intensity. The vibration at 120 cm-1 with low intensity results from the umbrella bend of the molecule. And the strongest vibrational peak at 365 cm-1 is caused by the asymmetric stretch along bonds.
Comparison of Vibrational spectrum for GaBr3 and BH3
Generally the frequencies of all the vibrations in BH3 molecule is much larger than those in GaBr3. The frequency values for BH3 are all above 1000 cm-1 while the frequency values for GaBr3 are all below 400 cm-1. This huge difference in frequency values results from the fact that BH3 has lighter component atoms than GaBr3. In GaBr3, both central atom and the ligand atoms are heavier and large atoms in the 4th row of periodic table, making the whole molecule hard to bend or stretch. In contrast, BH3 with small and light atoms can vibrate more easily and frequently.
The umbrella motion for BH3 and GaBr3 is respectively at 1163 cm-1 with intensity 93 and 120 cm-1 with intensity only 4. The values indicate that BH3 has a stronger umbrella bend than GaBr3. For both BH3 and GaBr3, the displacement vectors show that the central atoms vibrate in the opposite direction with ligand atoms. However in BH3, central B atom has a shorter displacement vector than other 3 H atoms and in GaBr3, 3 ligand Br atoms have shorter displacement vectors than Ga atom. This is because in BH3, B atom is heavier than ligand H atom and moves at a shorter displacement. Similarly in GaBr3, ligand Br is heavier than central Ga atom and therefore has a shorter vector. So BH3 and GaBr3 have different nature of the umbrella bend.
Discussion on OPT and FREQ
In order to compare the results of the calculation, the same method and basis set must be used in optimisation and frequency analysis. If different criteria is used, molecules would be computed with different accuracy and different number of functions to get the optimised electronic structure and frequency values. Then it would be meaningless to compare the results since they are at different accuracy level.
A frequency analysis is the calculation of the second derivative of the potential energy surface which can provide an evidence if the molecule has been optimised to minimum (i.e. ground state) or it is still at transition states. When the calculation has low frequency values normally in the range of ±15cm-1, it means the molecule is now at its most stable state showing the success of optimisation. If it is not the case, it indicates some mistakes in the optimisation or the convergence is not tight. For example, my first frequency analysis on BH3 has a low frequency value of about -15.89, which is due to the incorrect point group used in optimisation (the incorrect calculation results are not shown in this wiki). What is more, a frequency can also predict the IR Spectrum of molecules by calculating frequencies and intensities for all the possible vibrations.
The equation of vibrational modes for nonlinear molecules is 3N-6. The 6 low frequencies in the first line correspond to these 6 vibrational modes which do not cause a change of the nuclear coordinates and need to be subtracted in the equation. The low frequencies in the second line is the frequency calculated which can be either IR active or inactive.
BBr3
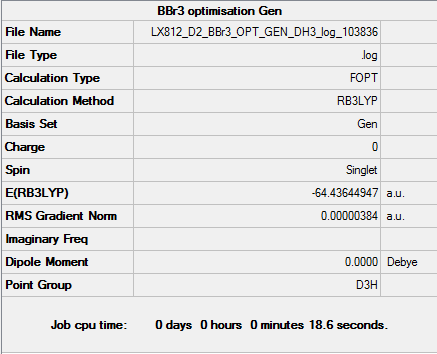
B3LYP/6-31G(d,p)LANL2DZ level Optimisation
optimisation file: DOI:10042/158098
| summary data | convergence | Jmol | |||
|---|---|---|---|---|---|
|
Item Value Threshold Converged? Maximum Force 0.000008 0.000015 YES RMS Force 0.000005 0.000010 YES Maximum Displacement 0.000036 0.000060 YES RMS Displacement 0.000024 0.000040 YES |
|
Geometry Comparison
| BH3 | BBr3 | GaBr3 | |
|---|---|---|---|
| r(E-X) Å | 1.19 | 1.93 | 2.35 |
| θ(X-E-X) degrees(º) | 120.0 | 120.0 | 120.0 |
From BH3, BBr3 to GaBr3, the atoms involved in the molecules become larger leading to increasing bond lengths but constant bond angels.
According to VSEPR theory, all these 3 molecules should have trigonal planar structure with a bond angel of 120.0° because B and Ga, which both have 3 valence electrons, would form 3 single bonds with H or Br atoms and there would be no lone pair of electrons. The data obtained in the table is consistent with the theory.
The bond lengths go up as the sizes of ligand atoms or central atom increase. Bond length can be defined as distance between two nuclei of the bonded atoms. It is also a measure of the bond strength. For BH3 and BBr3, the ligand atoms become bigger and bonds become longer. As a ligand atom, both H and Br have one unpaired valence electron and can form one single bond with B. However the formation of B-H bond is due to overlap between s orbital of H and sp2 orbital of B while the formation of B-Br bond is due to interaction between p orbital of Br and sp2 orbital of B. And the larger the bonding atoms are(ie. larger covalent radius), the poorer the orbital overlap and thus leading to weaker and longer bonds. In contrast of Br, which is a much larger atom than B, H has a shorter covalent radius. This makes B-H bond stronger and shorter than B-Br bond. For BBr3 and GaBr3, as the central atom goes down the group, the atomic size increases and bond lengths rises as well. Ga and B are both Group 13 elements and are both able to achieve sp2 hybridisation with one empty p orbital, which makes BBr3 and GaBr3 both Lewis Acids. The s-p energy gap in B is smaller than that in Ga, so it would be easier for B to promote and hybridise s and p orbitals, leading to better and shorter bonding.
The literature bond length value is 119 pm for BH3 [1], 189 pm for BBr3 [2] and 2.26 pm for GaBr3 [3]. This indicates that the calculation is relatively accurate, but the accuracy decreases when there are more heavy atoms involved.
Bond is the electrostatic attraction between atoms. It holds atoms together to give crystals and molecules etc. Bond energy is the amount of the energy required to break the bond in one mole of substance into separate atoms.
A strong bond is generally the intramolecular bond within the compound. Covalent (e.g. Cl-Cl) and ionic (e.g. NaCl) bonds are good examples of strong bonds. The bond energy of Cl-Cl bond is 240.0 kJ/mol [4]. H bond is a medium bond with a wide range of bond energy (0.8-167.5 kJ/mol). For instance, water molecules have H bond energy of 20.9 kJ/mol [5]. Weak bonds is the intermolecular force between molecules, such as the London force of ethane. London force has the bond energy below 4.2 kJ/mol [6].
The undrawn bonds in Gaussview may be a result of weak bonds. The computation may not be able to show weak bonds which have really low bond energies. However these weak bonds do exist though they possibly do not affect the overall structure.
NH3
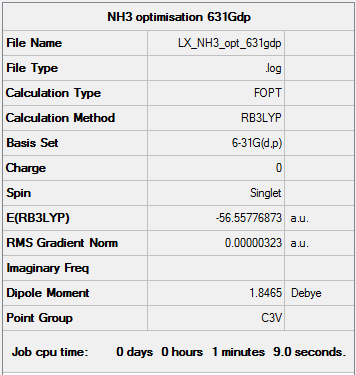
B3LYP/6-31G(d,p) level Optimisation
Optimisation log file here
| summary data | convergence | Jmol | |||
|---|---|---|---|---|---|
|
Item Value Threshold Converged? Maximum Force 0.000006 0.000450 YES RMS Force 0.000004 0.000300 YES Maximum Displacement 0.000012 0.001800 YES RMS Displacement 0.000008 0.001200 YES |
|
B3LYP/6-31G(d,p) level Frequency
Frequency log file: here
| summary data | low modes |
|---|---|
|
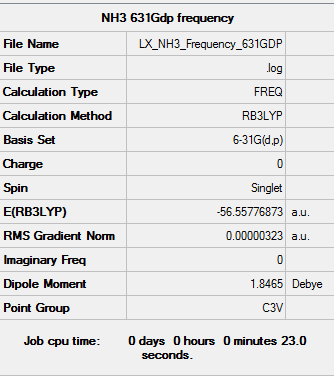
Low frequencies --- -0.0129 -0.0022 0.0017 7.0722 8.1014 8.1017 Low frequencies --- 1089.3849 1693.9369 1693.9369 |
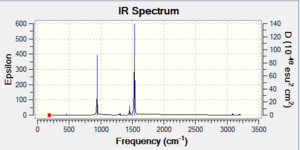
Vibrational spectrum for NH3
| wavenumber | Intensity | IR active? | type |
| 1089 | 145 | Yes | Bend |
| 1694 | 14 | Yes | Bend |
| 1694 | 14 | Yes | Bend |
| 3461 | 1 | Yes, very slight | Stretch |
| 3590 | 0 | No | Stretch |
| 3590 | 0 | No | Stretch |
Population Analysis
log file: DOI:10042/158177
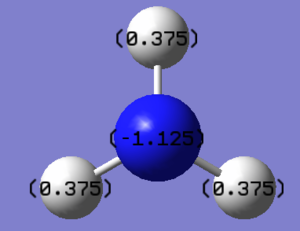
NBO Analysis
| Charge distribution | specific NBO charges for N and H atoms |
|---|---|
|
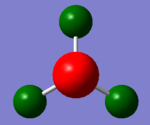
The N atom is electronegative with a charge value of -1.125 while ligand H is electropositive with charge 0.375. There are 5 bond orbitals which are 3N-H, 1 lone pair and 1 N core atomic orbital. The occupancy for all of them are 2. Lone pair has higher energy than N-H bond.
NH3BH3
B3LYP/6-31G(d,p) level Optimisation
Optimisation log file here
| summary data | convergence | Jmol | |||
|---|---|---|---|---|---|
|
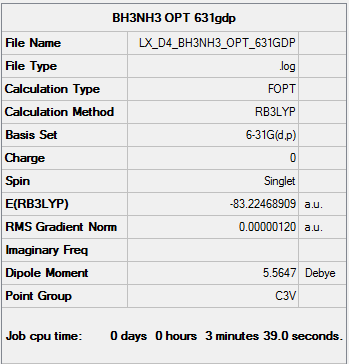
Item Value Threshold Converged? Maximum Force 0.000002 0.000015 YES RMS Force 0.000001 0.000010 YES Maximum Displacement 0.000023 0.000060 YES RMS Displacement 0.000010 0.000040 YES |
|
B3LYP/6-31G(d,p) level Frequency
Frequency file: here
| summary data | low modes |
|---|---|
|
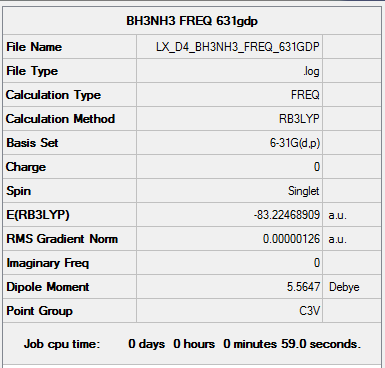
Low frequencies --- -5.5864 -0.3039 -0.0444 0.0009 1.2177 1.2912 Low frequencies --- 263.2843 632.9623 638.4603 |
Association energy
| BH3 | NH3 | NH3BH3 | Association Energy | |
|---|---|---|---|---|
| Energies | -26.6153236 au | -56.5577687 au | -83.2246891 au | -0.0515968 au = -135.78 kJ/mol |
According to the study on the energy of strong, medium and weak bonds before, the bond formed in NH3BH3 is a medium bond since it is lower than the energy of strong covalent bonds and higher than weak bonds eg. intermolecular forces. This bond is formed because the lone pair of electrons on N atom is donated to the empty p orbitals in B atom, leading to a negative charge on B atom and a positive charge on N atom.
Ionic Liquids (Mini Project)
[N(CH3)4]+
B3LYP/6-31G(d,p) level Optimisation
Optimisation log file: DOI:10042/158094
| summary data | convergence | Jmol | |||
|---|---|---|---|---|---|
|
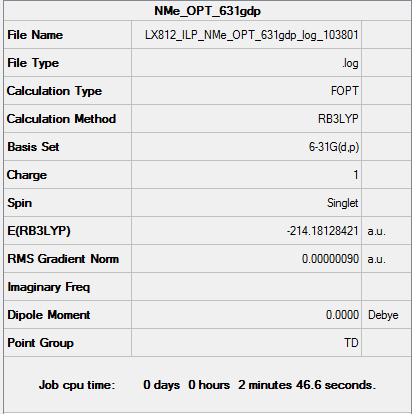
Item Value Threshold Converged? Maximum Force 0.000003 0.000015 YES RMS Force 0.000001 0.000010 YES Maximum Displacement 0.000013 0.000060 YES RMS Displacement 0.000005 0.000040 YES |
|
B3LYP/6-31G(d,p) level Frequency
Frequency log file: DOI:10042/158084
| summary data | low modes |
|---|---|
|
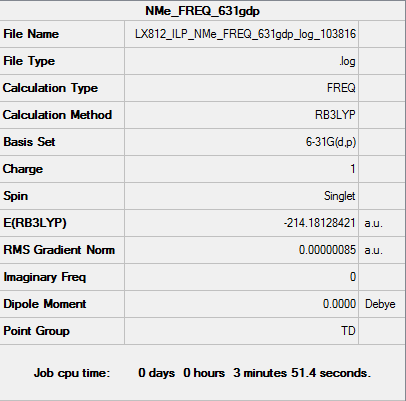
Low frequencies --- -0.0008 -0.0007 -0.0003 21.5288 21.5288 21.5288 Low frequencies --- 188.5490 292.6545 292.6545 |
Since the 1st fine low frequencies is within the range of +/- 20—30 cm-1, the cation has been optimised to minimum (i.e. ground state).
Vibrational spectrum
Population Analysis
log file: DOI:10042/158074
MO Analysis
| MO | |
|---|---|
 |
This MO is the lowest non-core MOs of [N(CH3)4]+. It is an overall strong bonding MO. And it is relatively delocalised. |
 |
This MO is one of the triple-degenerate MOs. It is an overall bonding MO. It has a nodal plane across the central atom separating methyl groups on two sides. The two electron density (red and green) are perpendicular with each other with the node in the middle. In comparison, it is more diffused than the previous MO. |
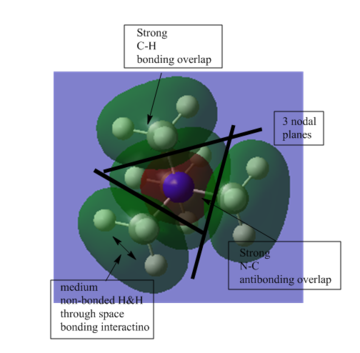 |
This MO is an overall bonding MO. It has 4 nodal planes but only 3 of them is shown in the diagram on the left. The nodal planes is between N and 4 C atoms. It is not very delocalised. |
 |
This MO is an overall anti-bonding MO. Each nodal plane is across 2 C atoms. It is more delocalised than the previous MO. |
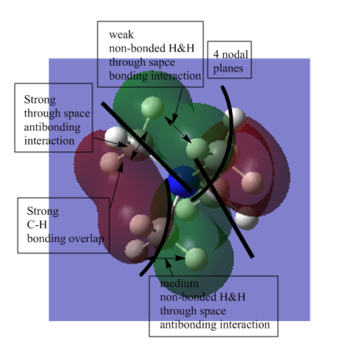 |
This MO is overall anti-bonding and quite diffused. It has 4 nodal planes, which should looks like a cross if observing the MO from side. |
NBO Analysis
| Charge distribution | specific NBO charges for N, C and H atoms |
|---|---|

|
[P(CH3)4]+
B3LYP/6-31G(d,p) level Optimisation
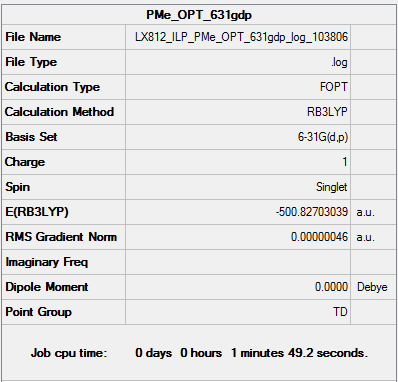
Optimisation log file: DOI:10042/158091
| summary data | convergence | Jmol | |||
|---|---|---|---|---|---|
|
Item Value Threshold Converged? Maximum Force 0.000001 0.000015 YES RMS Force 0.000000 0.000010 YES Maximum Displacement 0.000005 0.000060 YES RMS Displacement 0.000002 0.000040 YES |
|
B3LYP/6-31G(d,p) level Frequency
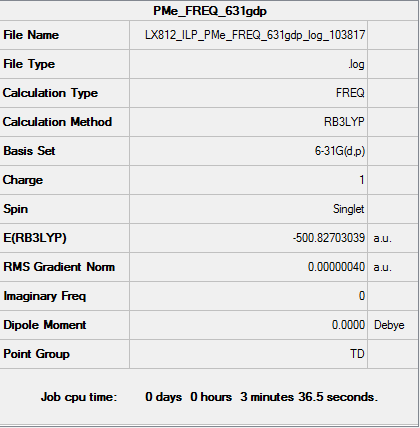
Frequency log file: DOI:10042/158081
| summary data | low modes |
|---|---|
|
Low frequencies --- -0.0032 -0.0028 -0.0006 24.7243 24.7243 24.7243 Low frequencies --- 160.0697 194.8035 194.8035 |
Since the 1st fine low frequencies is within the range of +/- 20—30 cm-1, the cation has been optimised to minimum (i.e. ground state).
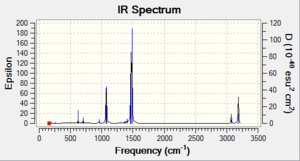
Vibrational spectrum for [P(CH3)4]+
Population Analysis
log file: DOI:10042/158070
NBO Analysis
| Charge distribution | specific NBO charges for P, C and H atoms |
|---|---|
|
[S(CH3)3]+
B3LYP/6-31G(d,p) level Optimisation
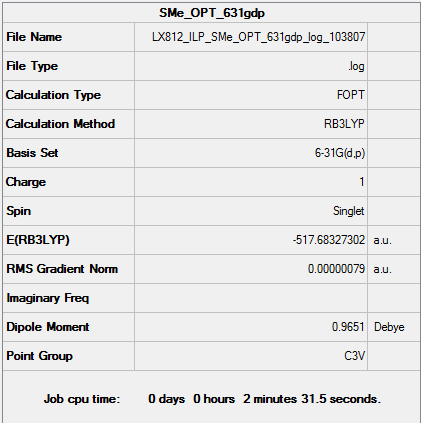
Optimisation log file: DOI:10042/158087
| summary data | convergence | Jmol | |||
|---|---|---|---|---|---|
|
Item Value Threshold Converged? Maximum Force 0.000002 0.000015 YES RMS Force 0.000001 0.000010 YES Maximum Displacement 0.000054 0.000060 YES RMS Displacement 0.000017 0.000040 YES |
|
B3LYP/6-31G(d,p) level Frequency
Frequency log file: DOI:10042/158077
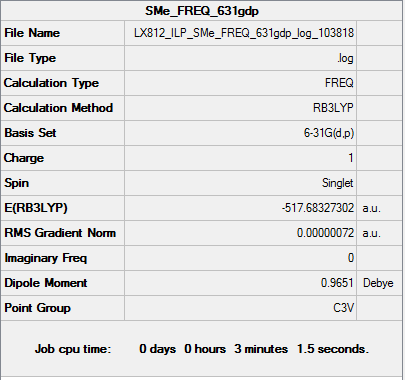
| summary data | low modes |
|---|---|
|
Low frequencies --- -8.1009 -7.7505 -7.7472 -0.0044 -0.0026 0.0078 Low frequencies --- 161.9980 199.6776 199.6776 |
Since the 1st fine low frequencies is within the range of +/- 20—30 cm-1, the cation has been optimised to minimum (i.e. ground state).
Vibrational spectrum for [S(CH3)3]+
Population Analysis
log file: DOI:10042/158065
NBO Analysis
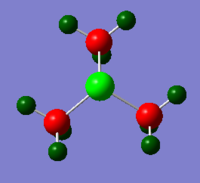
| Charge distribution | specific NBO charges for S, C and H atoms |
|---|---|
|
Structure Discussion
| Bond Length(Å) | Bond Angle(º) | Point Group | |
|---|---|---|---|
| [N(CH3)4]+ | N-C 1.51 C-H 1.09 |
C-N-C 109.5 H-C-N 108.9 H-C-H 110.0 |
Td |
| [P(CH3)4]+ | P-C 1.82 C-H 1.09 |
C-P-C 109.5 H-C-P 109.9 H-C-H 109.0 |
Td |
| [S(CH3)3]+ | S-C 1.82 C-H 1.09 |
C-S-C 102.7 H-C-S 107.3 H-C-H 109.4 or 111.1 |
C3v |
[N(CH3)4]+ and [P(CH3)4]+ have the same structure with 4 methyl groups as ligands, which are both tetrahedral and [S(CH3)3]+ is trigonal pyramidal with 3 methyl group as ligands.
These 3 cations have the same C-H bond length in methyl groups. Among 3 central atom-C bonds, N-C bond is the shortest because N atom is the smallest atom and has shorter covalent radius, forming shorter and stronger bond. P-C bond and S-C bond has roughly the same value for bond length. P and S atom are in the second row of periodic table and have larger covalent radius than N atom, which is in the first row. So the bonds are longer and weaker.
C-N-C bond angle and C-P-C bond angle are both 109.5. In both case, 4 bonding pair and no lone pair arrange 4 methyl groups in the optimum place to minimize the energy so tetrahedral structure is adopted. In [S(CH3)3]+ cation, trigonal pyramidal structure is resulted from the existence of 3 bonding pair and 1 lone pair. The lone pair would occupy more space than bonding pair.
There are 2 slightly different values for the C-H-C bond angle in [S(CH3)3]+. This shows that the methyl groups may experience some distortion and not perfectly tetrahedral.
NBO Discussion
Charge Distribution Table
| Cation | Charge on Central atom | Charge on C atoms | Charge on H atoms |
| [N(CH3)4]+ | -0.295 | -0.483 | 0.269 |
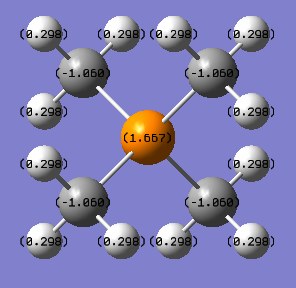
| [P(CH3)4]+ | 1.667 | -1.050 | 0.298 |
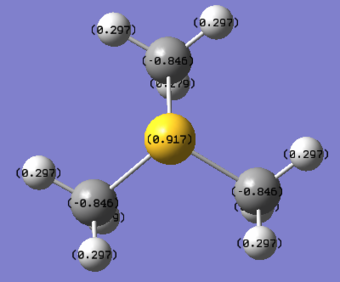
| [S(CH3)3]+ | 0.917 | -0.846 | 0.297 or 0.279 |
Bond Contribution in Central atom-C bond and Hybridisation Table
| Cation | Central atom Contribution | Central atom Hybridisation | C atom Contribution | C atom Hybridisation |
| [N(CH3)4]+ | 66% | 25%s+75%p | 34% | 21%s+79%p |
| [P(CH3)4]+ | 40% | 25%s+74%p+1%d | 60% | 25%s+75%p |
| [S(CH3)3]+ | 51% | 17%s+82%p+1%d | 49% | 20%s+80%p |
In N(CH3)4]+, the dark red central N atom has a slight negative charge of -0.295. This is inconsistent with the theory which predicts that N donates its lone pair and then has a positive charge. It might be due to the high electronegativity of N. N atom would pull electron density of the bond towards itself. The occupancy of N-C bonds are 2 electrons with energy of -0.9au, which is more stable than C-H bonds with energy -0.7au. All core orbital of N and C are much lower in energy.
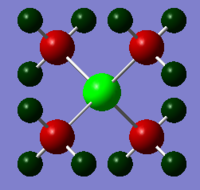
For [P(CH3)4]+, the bright green central P atom of 1.667 charge is very electropositive. P-C has lower energy ,-0.8au, than that of C-H bond, -0.7au. To compare [P(CH3)4]+ with N(CH3)4]+, as a central atom of the cation, N is negatively charged while P atom is positively charged because as going down the group, the electronegativity decreases. Therefore P has less control over electrons than N and in [P(CH3)4]+, electron density in P-C bond would not be pulled towards P as it would be in [N(CH3)4]+. And compared to C, P contributes less to P-C bond but N contributes more to N-C bond. With respect to the 2s&2p orbital of C atom, 3s&3p orbitals of P atom is at a higher energy level while 2s&2p of N atom is at a lower energy level, leading to less contribution to P-C bonding MO from P atom and more contribution to N-C bonding MO from N atom, because AOs with lower energy contribute more to bonding orbital. P-C is also less stable than N-C due to larger energy gap required to achieve sp3 hybridisation for P than C.
In [S(CH3)3]+, the central S atom with a bright green colour has a charge of 0.917 which is less positive than P atom and more positive than N atom. Because the electronegativity of S atom is higher than P and lower than N, it would only distort the electron density slightly and obtain a middle value of charge across these three cations. But in overall S atom is not very electronegative and has a positive charge. What is more, since 3s&3p orbitals of S atom is at lower energy level than that of P atom, it leads to a higher contribution to bond than P atom does. In addition, there are two slightly different charge values for H atoms in [S(CH3)3]+. This is due to the distorted tetrahedral structure of methyl groups which has been mentioned above in structure comparison.
In general, as the charge on central atom decreases, the contribution of the central atom to the bond would increase. The charge on C atom is always negative in all 3 cases. It would becomes less negative if the central atom is more electronegative and attracting electrons away.
For central atom hybridisation, N does not have a d orbital, so it has a perfect sp3 hybridisation. However P has 3d orbitals which is slightly involved in the hybridisation, but it has a sp3 hybridisation overall. S atom hybridisation has different pattern as N and P atom. It is roughly a sp3 hybridisation with a greater character of p orbital and tiny character of d orbital.
Discussion on [NR4]+ (R=alkyl)
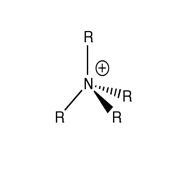
As the picture above shown, the traditional [NR4]+ has a positive charge on N atom. In traditional theory, this species is obtained by NR3 donating a lone pair of electrons from N atom to an alkyl group with one positive charge, forming a dative bond. As a result, 2 electrons in the new dative bond would be equally shared between N and C atom, which means at this time N atom would have one electron shortage and the formal positive charge would be on the N atom.
However the traditional theory is not valid because it does not take account of the different electronegativities of various atoms. The computational calculation indicated that the formal positive charge should be delocalised on all the H atoms since H atoms are the most electropositive atoms in this kind of species.
[N(CH3)3(CH2OH)]+
B3LYP/6-31G(d,p) level Optimisation
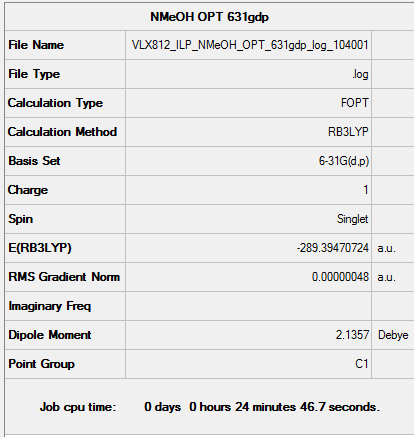
Optimisation log file: DOI:10042/161028
| summary data | convergence | Jmol | |||
|---|---|---|---|---|---|
|
Item Value Threshold Converged? Maximum Force 0.000001 0.000015 YES RMS Force 0.000000 0.000010 YES Maximum Displacement 0.000013 0.000060 YES RMS Displacement 0.000005 0.000040 YES |
|
The point group for this cation is C1 indicating that it has neither rotational nor reflectional symmetry. This means the OH group is slightly rotated out of the plane. The cation would be less stable with Cs symmetry than C1 symmetry due to torsional strain.
B3LYP/6-31G(d,p) level Frequency
Frequency log file: DOI:10042/161029
| summary data | low modes |
|---|---|

|
Low frequencies --- -8.4308 -5.0464 -1.1798 -0.0011 0.0001 0.0010 Low frequencies --- 131.1045 213.4576 255.7128 |
Since the 1st fine low frequencies is within the range of +/- 20—30 cm-1, the cation has been optimised to minimum (i.e. ground state).
Vibrational spectrum
Population Analysis
log file: DOI:10042/161031
NBO Analysis
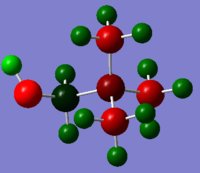
| Charge distribution | specific NBO charges for N, C, O and H atoms |
|---|---|
|
[N(CH3)3(CH2CN)]+
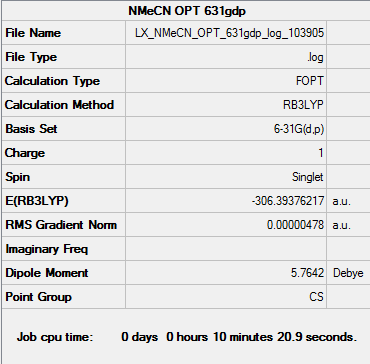
B3LYP/6-31G(d,p) level Optimisation
Optimisation log file: DOI:10042/161006
| summary data | convergence | Jmol | |||
|---|---|---|---|---|---|
|
Item Value Threshold Converged? Maximum Force 0.000009 0.000015 YES RMS Force 0.000002 0.000010 YES Maximum Displacement 0.000048 0.000060 YES RMS Displacement 0.000015 0.000040 YES |
|
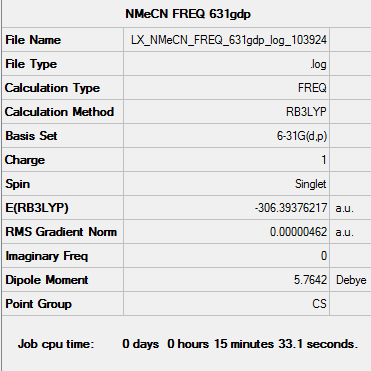
B3LYP/6-31G(d,p) level Frequency
Frequency log file: DOI:10042/161008
| summary data | low modes |
|---|---|
|
Low frequencies --- -4.0265 0.0006 0.0007 0.0008 2.4192 3.6714 Low frequencies --- 91.8390 153.9501 212.0444 |
Since the 1st fine low frequencies is within the range of +/- 20—30 cm-1, the cation has been optimised to minimum (i.e. ground state).
Vibrational spectrum
Population Analysis
log file: DOI:10042/161033
NBO Analysis
| Charge distribution | specific NBO charges for N, C and H atoms |
|---|---|

|
Charge Distribution Discussion
Charge Distribution Table
| Cation | Charge on Central N atom | Charge on C atoms | Charge on H atoms |
| [N(CH3)3(CH2OH)]+ | -0.322 | 0.088 (CH2OH)
-0.491 ~ -0.494 (CH3) |
0.237 0.249 (CH2OH)
0.262~0.282 (CH3) |
| [N(CH3)3(CH2CN)]+ | -0.289 | -0.358 (CH2CN)
-0.358 ~ -0.489 (CH3) |
0.269 ~ 0.282 (CH3)
0.309 (CH2CN) |
| [N(CH3)4]+ | -0.295 | -0.483 | 0.269 |
OH is an electron donating group and push electron density towards CH2 and N atom. The central N atom is more negatively charged than it is in [N(CH3)4]+, decreasing from -0.295 to -.322. The C atom in methyl groups also has more negative charge values. The H atoms on the C which OH attached to, is less positive now. Generally OH group decreases the charge on central N atoms and methyl C atoms.
Oppositely CN is an electron withdrawing group and pull electron density towards itself from other atoms. The central N atom is less negative due to loss of electron density. The charge value increase slightly from -0.295 to -0.289. Basically the Methyl C atom and the C atom CN group attached to has less negative charges as well. All the H atoms become more positive than it is in [N(CH3)4]+.
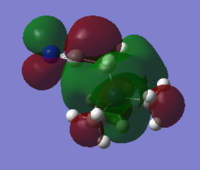
HOMO & LUMO Comparison on N cations
| MO | [N(CH3)4]+ | [N(CH3)3(CH2OH)]+ | [N(CH3)3(CH2CN)]+ |
| HOMO | 
-0.58au |
-0.49au |
-0.50au |
| LUMO | 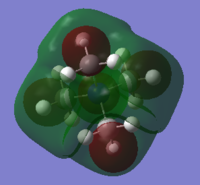
-0.13au |

-0.12au |
-0.18au |
| LUMO-HOMO Energy Gap | 0.45au | 0.37au | 0.32au |
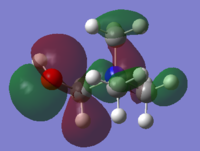
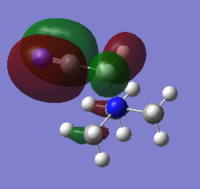
With OH and CN groups, the HOMO energy level both going up. This might be a result from more anti-bonding interactions. And the HOMO becomes more delocalised in both cases because of the electron donating and withdrawing effect caused by OH and CN groups. The LUMO energy level increases with OH group and decreases with CN group. The HOMO-LUMO energy gap both decrease in size. This can make electron promotion from HOMO to LUMO more easily and therefore some changes in photochemical properties.
Reference
[1] Kawaguchi, Kentarou (1992). "Fourier transform infrared spectroscopy of the BH3 ν3 band". The Journal of Chemical Physics 96 (5): 3411. doi:10.1063/1.461942. ISSN 0021-9606.
[2] Chemistry Of P-Block Elements, M. Satake & S.A. Iqbal, M. Satake, P38
[3] C´ecile Da Silva, Olivier Proux, Jean-Louis Hazemann, Julianne James-Smith, Denis Testemale,et al.. X-ray Absorption Spectroscopy Study of Solvation and Ion-Pairing in Aqueous Gallium Bromide Solutions at Supercritical Conditions. Journal of Molecular Liquids, Elsevier, 2008,147, pp.83-95.
[4]http://www.science.uwaterloo.ca/~cchieh/cact/c120/bondel.html
[5]http://evans.rc.fas.harvard.edu/pdf/smnr_2009_Kwan_Eugene.pdf
[6]http://www.800mainstreet.com/08/0008-0012-interforce.html


