User:Lmf12
Chemical Bonding
A bond is considered to have been formed between two atoms when the energy of the individual atoms are higher than that of molecule. The bond length is a result of attractive and repulsive forces between the nuclei and the electrons of the two atoms that reaches an energy minimum. From looking at a plot of potential energy vs. internuclear distance it can be seen that a shortening of the bond would result in an increase in energy - this is due to repulsion forces between the two nuclei and between their electrons. However, a lengthening of the bond would result in an increase in attractive forces bringing the two nuclei closer together.[1]
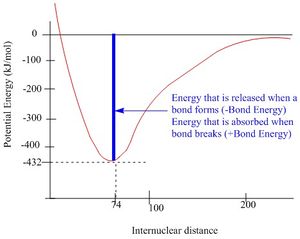
The bond energy can be used to measure the strength of a bond and is defined as how much energy that is required to break one mole of molecules into their individual atoms.[3]. A strong bond would be the N≡N bond that has a bond energy of 946 kJ/mol, a bond of medium strength would be Si-O that has a bond energy of 460 kJ/mol and a weak bond would be a C-1 bond that has a bond energy of 213 kJ/mol[4].
Bonding in MX3 and MH3 Species
| BH3 | BBr3 | GaBr3 | |
| r(E-X) | 1.19 | 1.93 | 2.35 |
| θ(X-E-X) | 120.0 | 120.0 | 120.0 |
From looking at the geometrical data for the cases listed above it can be seen that substituting the H atoms in BH3 with Br atoms increases the bond length. This is expected as Br is in Period 4 (compared to H in Period 1) and therefor sterically larger than H, resulting in a longer bond. From substituting the Boron atom with Gallium, that is found in the same group but in Period 4 the bond distance increases further. All these molecules will take a trigonal planar form, and thus have the same bond angles.
However, it is found experimentally that the bonds in MX3 species of Group 13 are shorter than what would be expected from looking at the covalent radii of the individual atoms in combination with the ionic contribution to the bonds.[5]. This is due to an effect referred to as π-bonding, where the halide donates electron density to the electron deficient central metal atom through low lying energy p-orbitals, which results in a shortening of the bond (compared to purely the covalent radii). In BH3 species the electron 'donation' from H is purely inductive through the σ-bond since there are no filled p-orbitals on H that can interact with the empty p-orbital on Boron.
This overlap is greatest for p-orbitals of similar size, as it allows a better energy match. however, as the orbital size increases further down a group, it also becomes more diffuse. In order to determine which effect that contributes the most to the bond strength, calculations were carried out using B3LYP/6-31G for BH3 and NH3 and B3LYP/LANL2DZ for GaBr3 and BBr3.
The energies found were:
E(BH3)=-26.62 a.u. E(NH3)=-56.55 a.u. E(GaBr3)=-41.70 a.u. E(BBr3)=-64.44 a.u.
This indicates that the NH3 bond is stronger than the BH3 bonds and that the BBr3 bond is stronger than the GaBr3 bond.
For BBr3, the 2p(B)-4p(Br) orbital overlap is better and therefor the bond is stronger whereas for GaBr3, the 4p(Ga)-4p(B) orbital overlap, although providing a better energy energy match, are between two diffuse orbitals and the atoms are sterically large, so the bond will be weaker and hence easier to break.
Software: Gauss View
Using programmes such as Gauss View can sometimes be misleading; Gauss view draw bonds based on a distance criteria and if the distance exceeds this pre-defined value Gauss View will not recognise that there is a bond present. However, this does not mean that the bond does not exist.
When a frequency analysis is carried out using Gauss View, the software has taken the second derivative of the potential energy surface of a molecule. This means that if the frequencies are all positive there is a minimum, if one of them should be negative a transition state has been located and if more than one is negative then the critical point was not find, this means that either the optimisation was not completed or failed.
BH3 Project Section
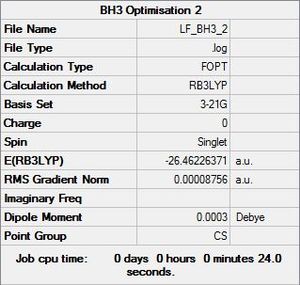
BH3 Optimisation Data
B3LYP/3-21G level
Optimisation log file here
B3LYP/6-31G level
Optimisation log file here
| summary data | convergence | Jmol | |||
|---|---|---|---|---|---|
|
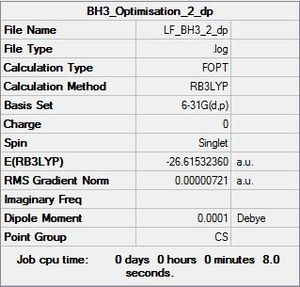
Item Value Threshold Converged? Maximum Force 0.000012 0.000450 YES RMS Force 0.000008 0.000300 YES Maximum Displacement 0.000064 0.001800 YES RMS Displacement 0.000039 0.001200 YES Predicted change in Energy=-1.126784D-09 Optimization completed. |
|
BH3 Symmetry
Optimisation log file here
| summary data | low modes |
|---|---|
|
 Full mass-weighted force constant matrix:
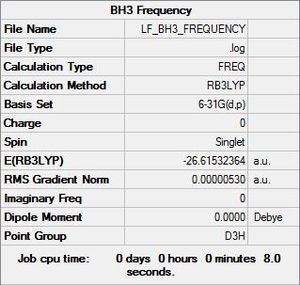
 Low frequencies ---  -14.5183  -14.5142  -10.8197   -0.0005
 0.0169    0.3454
 Low frequencies --- 1162.9508 1213.1230 1213.1232
|
Vibrational spectrum for BH3
| Wavenumber | Intensity | IR active? | Type | IR Spectrum |
| 1162.95 | 92.5706 | yes | bend | 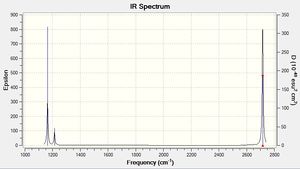
|
| 1213.12 | 14.0539 | very slight | bend | |
| 1213.12 | 14.0539 | very slight | bend | |
| 2582.66 | 0.0000 | no | symmetric stretch | |
| 2715.81 | 126.3291 | no | asymmetric stretch | |
| 2715.81 | 126.3291 | no | asymmetric stretch |
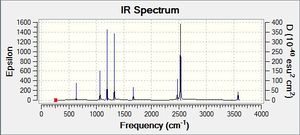
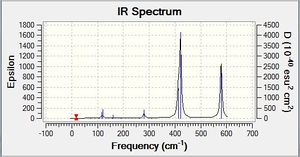
As can be seen from the Ir spectrum there are two regions of IR-active modes; one at ≈1200 cm-1 and one at ≈2600-2700cm-1. The lower frequency region comes from the asymmetrical bending modes of the molecule, and are of lower frequency as less energy is required to bend a bond than to stretch it.
Molecular Orbital Diagram for BH3
Where the Linear Compination of Atomic Orbitals (LCAO) approximation has been used the electrons are more localised whereas for the real molecular orbitals the electrons delocalise over the entire molecule. The LCAO approximation is still very useful when it comes to estimating energy levels, but can give the wrong order of orbitals that are very close in energy.
GaBr3 Project Section
GaBr3 Optimisation Data
B3LYP/LANL2ZD level
Optimisation log file here
| summary data | convergence | Jmol | |||
|---|---|---|---|---|---|

|
Item Value Threshold Converged? Maximum Force 0.000000 0.000450 YES RMS Force 0.000000 0.000300 YES Maximum Displacement 0.000003 0.001800 YES RMS Displacement 0.000002 0.001200 YES Predicted change in Energy=-1.307747D-12 Optimization completed. |
|
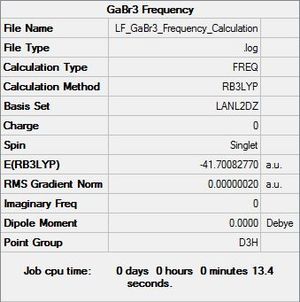
GaBr3 Symmetry
Optimisation log file here
| summary data | low modes |
|---|---|
|
 Full mass-weighted force constant matrix:
  Low frequencies ---   -1.4878   -0.0015   -0.0002    0.0096    0.6540    0.6540
 Low frequencies ---   76.3920   76.3924   99.6767
|
Vibrational spectrum for GaBr3
| Wavenumber | Intensity | IR active? | Type | IR Spectrum |
| 76.39 | 3.3451 | yes | bend | 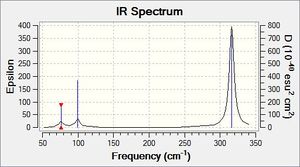
|
| 76.39 | 3.3450 | very slight | bend | |
| 99.68 | 9.2166 | very slight | bend | |
| 197.33 | 0.0000 | no | symmetric stretch | |
| 316.18 | 57.0655 | no | asymmetric stretch | |
| 316.18 | 57.0669 | no | asymmetric stretch |
Comparing this spectrum to that of BH3 they look very similar which is due to that they both belong to the same point group. The asymmetric stretch occurs at a significantly lower frequency which is due to that the GaBr3 is much larger in size and the bonding present is weaker.
BBr3 Project Section
B3LYP/Gen level
Optimisation log file here
| summary data | convergence | Jmol | |||
|---|---|---|---|---|---|

|
Item Value Threshold Converged? Maximum Force 0.000013 0.000450 YES RMS Force 0.000006 0.000300 YES Maximum Displacement 0.000058 0.001800 YES RMS Displacement 0.000029 0.001200 YES Predicted change in Energy=-6.008434D-10 Optimization completed. |
|
NH3 Project Section
NH3 Optimisation Data
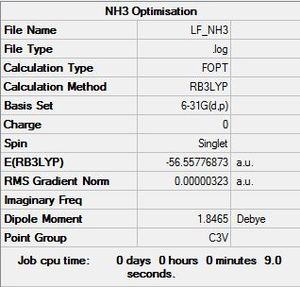
B3LYP/6-31G level
Optimisation log file here
| summary data | convergence | Jmol | |||
|---|---|---|---|---|---|
|
Item Value Threshold Converged? Maximum Force 0.000006 0.000450 YES RMS Force 0.000004 0.000300 YES Maximum Displacement 0.000012 0.001800 YES RMS Displacement 0.000008 0.001200 YES Predicted change in Energy=-9.843885D-11 Optimization completed. |
|
NH3 Symmetry
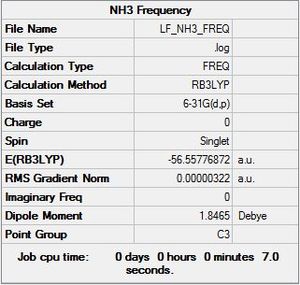
Optimisation log file here
| summary data | low modes |
|---|---|
|
 Full mass-weighted force constant matrix:
 Low frequencies ---   -0.0138   -0.0026   -0.0009    7.0783    8.0932    8.0937
 Low frequencies --- 1089.3840 1693.9368 1693.9368
|
Vibrational spectrum for NH3
| Wavenumber | Intensity | IR active? | Type | IR Spectrum |
| 1089.16 | 145.4750 | yes | bend | 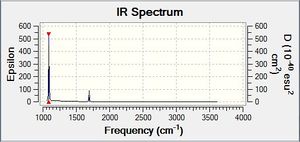
|
| 1693.89 | 13.5595 | very slight | bend | |
| 1693.90 | 13.5628 | very slight | bend | |
| 3461.54 | 1.0576 | no | stretch | |
| 3590.00 | 0.2684 | no | asymmetrical stretch | |
| 3590.24 | 0.2686 | no | asymmetrical stretch |
From comparing the NH3 spectrum with that of BH3 and GaBr3 it looks a bit difference. This is partly due to the presence of an electron lone pair on Nitrogen.
Umbrella modes
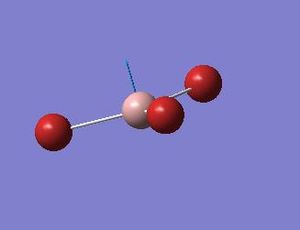
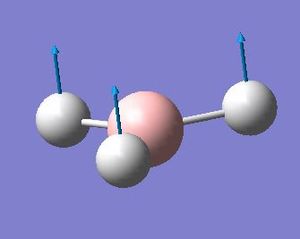
By looking at the so called umbrella modes for the GaBr3 and the BH3 molecule one important difference can be spotted. This is that in the GaBr3 the Gallium is what is moving up and down as it is the lightest atom in the molecule. For BH3 this species would be H and so these are the ones that are moving.
NBO Analysis/Charge Distribution
| Charge Distribution | Specific NBO Charges for N and H | Display Charge Distribution | |
|---|---|---|---|
|
|
|
|
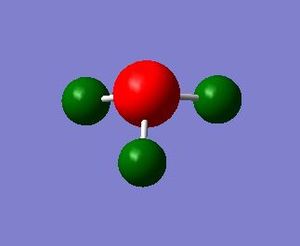
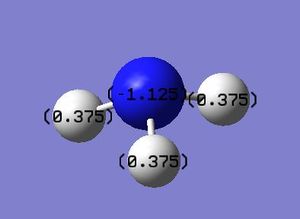
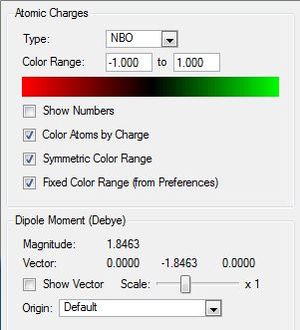
From looking at the picture above it can be seen that the charge distribution is as would be expected from the relative electronegativities of the individual atoms, where the negative charge is on the Nitrogen and the positive charge is on the Hydrogen atoms, suggesting that there is an ionic contribution to the bonding present in the NH3 species.
Ammonia-Borane NH3BH3 Project Section
NH3 BH3 Optimisation Data
B3LYP/6-31G level
Optimisation log file here
| summary data | convergence | Jmol | |||
|---|---|---|---|---|---|
|
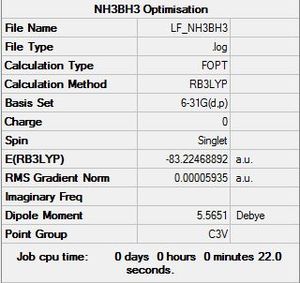
Item Value Threshold Converged? Maximum Force 0.000121 0.000450 YES RMS Force 0.000057 0.000300 YES Maximum Displacement 0.000507 0.001800 YES RMS Displacement 0.000295 0.001200 YES Predicted change in Energy=-1.613117D-07 Optimization completed. |
|
NH3BH3 Symmetry
Optimisation log file here
| summary data | low modes |
|---|---|
|
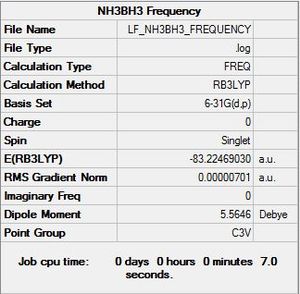
Full mass-weighted force constant matrix:
 Low frequencies ---   -0.1450   -0.0736   -0.0066   13.3607   13.3703   15.4061
 Low frequencies ---  263.5321  633.1134  639.2469
|
Vibrational spectrum for BH3NH3
| Wavenumber | Intensity | IR active? | Type |
| 263.52 | 0.0000 | yes | bend |
| 633.11 | 13.9670 | very slight | bend |
| 639.25 | 3.5366 | very slight | bend |
| 639.25 | 3.5342 | no | stretch |
| 1069.30 | 40.5370 | no | stretch |
| 1069.30 | 40.5392 | no | stretch |
| 1196.45 | 108.9089 | no | stretch |
| 1203.37 | 3.4661 | no | stretch |
| 1203.37 | 3.4667 | no | stretch |
| 1329.59 | 113.7238 | no | stretch |
| 1676.44 | 27.5513 | no | stretch |
| 1676.44 | 27.5515 | no | stretch |
| 2472.01 | 67.2562 | no | stretch |
| 2532.19 | 231.2574 | no | stretch |
| 2532.19 | 231.2328 | no | stretch |
| 3463.99 | 2.5114 | no | stretch |
| 3580.97 | 27.9581 | no | stretch |
| 3580.97 | 27.9582 | no | stretch |
ΔE=E(NH3BH3)-[E(NH3)+E(BH3)]
ΔE=-83.22468892-[(-56.55776872 a.u.)+(-26.61532364 a.u.)]= -0.05159656 a.u.
ΔE=-135.4672842 J/mol
Al2Cl2Br2 Lab Project Section
The Different Isomers of Al2Cl2Br2
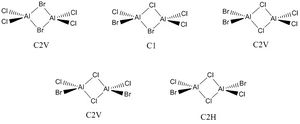
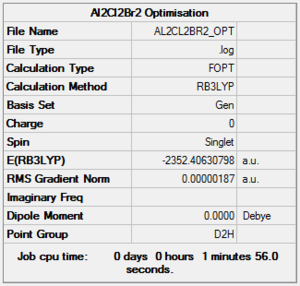
Al2Cl2Br2 can form five different isomers, all shown in the picture with their respective point groups.
B3LYP/6-31G level, Isomer 1
Optimisation log file here
| summary data | convergence | Jmol | |||
|---|---|---|---|---|---|
|
Item Value Threshold Converged? Maximum Force 0.000003 0.000450 YES RMS Force 0.000001 0.000300 YES Maximum Displacement 0.000057 0.001800 YES RMS Displacement 0.000015 0.001200 YES Predicted change in Energy=-2.941232D-10 Optimization completed. |
|
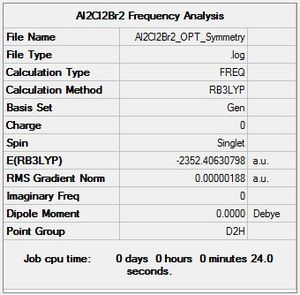
Al2Cl2Br2 Isomer 1 Symmetry
Optimisation log file here
| summary data | low modes |
|---|---|
|
Low frequencies ---   -5.1748   -5.0352   -3.1463    0.0014    0.0018    0.0020
 Low frequencies ---   14.8261   63.2702   86.0770
|
Vibrational spectrum for Al2Cl2Br2 Isomer 1
| Mode | Frequency | Intensity | Type |
| 1 | 14.83 | 0.3441 | Al-Br bend |
| 5 | 107.58 | 4.5739 | Al-Cl bend |
| 7 | 125.65 | 8.1417 | Al-Cl bend |
| 9 | 138.38 | 7.0416 | Al-Br bend |
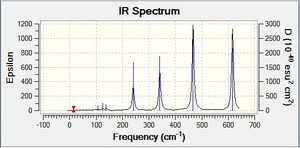
| 12 | 240.99 | 99.7791 | Al-Br stretch |
| 14 | 341.30 | 160.6480 | Al-Br stretch |
| 15 | 467.23 | 346.5463 | Cl-Al-Br Stretch |
| 18 | 616.34 | 331.8044 | Al-Cl stretch |
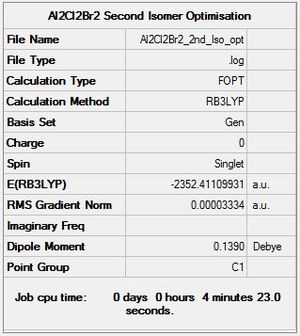
B3LYP/6-31G level, Isomer 2
Optimisation log file here
| summary data | convergence | Jmol | |||
|---|---|---|---|---|---|
|
Item Value Threshold Converged? Maximum Force 0.000105 0.000450 YES RMS Force 0.000026 0.000300 YES Maximum Displacement 0.001357 0.001800 YES RMS Displacement 0.000596 0.001200 YES Predicted change in Energy=-1.134244D-07 Optimization completed. |
|
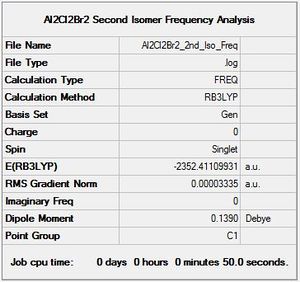
Al2Cl2Br2 Isomer 2 Symmetry
Optimisation log file here
| summary data | low modes |
|---|---|
|
Low frequencies ---   -2.9931   -1.4948   -0.0035   -0.0026    0.0015    3.0891
 Low frequencies ---   17.0169   55.9580   80.0480
|
Vibrational spectrum for Al2Cl2Br2 Isomer 2
| Mode | Frequency | Intensity | Type |
| 1 | 17.01 | 0.3958 | Al-Br/Al-Cl stretch |
| 6 | 109.63 | 5.1468 | Al-Cl bend |
| 7 | 121.15 | 7.5623 | Al-Cl/Al-Br bend |
| 8 | 148.92 | 5.1319 | Al-Cl bend |
| 9 | 154.30 | 6.2886 | Al-Br/Al-Cl bend |
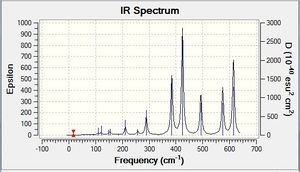
| 11 | 211.10 | 21.1007 | Al-Br stretch |
| 12 | 257.45 | 9.6920 | Al-Br/Al-Cl (bridging) |
| 13 | 289.07 | 47.9373 | Al-Cl stretch (bridging) |
| 14 | 384.41 | 153.7854 | Al-Cl stretch (bridging) |
| 15 | 424.13 | 274.3499 | Al-Cl stretch (bridging) |
| 16 | 492.85 | 106.5828 | Al-Cl stretch (bridging) |
| 17 | 574.48 | 121.8889 | Al-Cl stretch (terminal) |
| 18 | 614.55 | 197.1619 | Al-Cl stretch (terminal) |
This is where you add your explanation of why there are fewer vibrational peaks than there are vibrations.(Because some of the energy levels are degenerate and so give rise to only one peak in the spectrum.
B3LYP/6-31G level, Isomer 3
Optimisation log file here
| summary data | convergence | Jmol | |||
|---|---|---|---|---|---|

|
Item Value Threshold Converged? Maximum Force 0.000120 0.000450 YES RMS Force 0.000043 0.000300 YES Maximum Displacement 0.000153 0.001800 YES RMS Displacement 0.000049 0.001200 YES Predicted change in Energy=-1.401356D-08 Optimization completed. |
|
Al2Cl2Br2 Isomer 3 Symmetry
Optimisation log file here
| summary data | low modes |
|---|---|

|
Low frequencies ---   -4.1720   -2.6762   -1.2823   -0.0029   -0.0025   -0.0025
 Low frequencies ---   17.8116   50.9340   72.1836
|
Vibrational spectrum for Al2Cl2Br2 Isomer 3
| Mode | Frequency | Intensity | Type |
| 1 | 17.81 | 0.4847 | Al-Cl bend |
| 3 | 72.18 | 0.5506 | Al-Br/Al-Cl bend bend (terminal) |
| 6 | 111.94 | 7.5673 | Al-Br/Al-Cl bend bend (terminal) |
| 8 | 159.74 | 1.2083 | Al-Cl bend |
| 9 | 165.82 | 6.5596 | Al-Cl bend (terminal + bridging) |
| 10 | 186.75 | 1.6215 | Al-Cl bend |
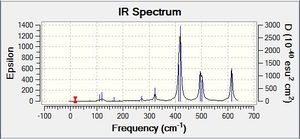
| 12 | 270.91 | 13.3026 | Al-Br/Al-Cl stretch (bridging) |
| 13 | 322.43 | 41.4391 | Al-Cl stretch (bridging) |
| 14 | 413.35 | 149.5130 | Al-Cl stretch (bridging) |
| 15 | 419.11 | 310.3169 | Al-Br/Al-Cl stretch (bridging) |
| 16 | 495.25 | 133.7911 | Al-Br stretch (terminal) |
| 17 | 502.58 | 104.1962 | Al-Cl stretch (terminal) |
| 18 | 615.03 | 177.0592 | Al-Cl stretch (terminal) |
This is where you add your explanation of why there are fewer vibrational peaks than there are vibrations.(Because some of the energy levels are degenerate and so give rise to only one peak in the spectrum.
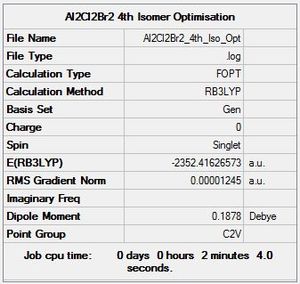
B3LYP/6-31G level, Isomer 4
Optimisation log file here
| summary data | convergence | Jmol | |||
|---|---|---|---|---|---|
|
Item Value Threshold Converged? Maximum Force 0.000023 0.000450 YES RMS Force 0.000012 0.000300 YES Maximum Displacement 0.000867 0.001800 YES RMS Displacement 0.000316 0.001200 YES Predicted change in Energy=-2.548056D-08 Optimization completed. |
|
Al2Cl2Br2 Isomer 4 Symmetry
Optimisation log file here
| summary data | low modes |
|---|---|

|
Low frequencies ---   -4.2111   -2.4732    0.0025    0.0030    0.0042    0.9356
 Low frequencies ---   17.0899   50.8290   78.6237
|
Vibrational spectrum for Al2Cl2Br2 Isomer 4
| Mode | Frequency | Intensity | Type |
| 1 | 17.09 | 0.4359 | Al-Cl bend (bridge) |
| 5 | 103.64 | 2.7204 | Al-Cl bend (bridge |
| 6 | 120.57 | 12.8808 | Al-Br/Al-Cl bend bend (terminal) |
| 7 | 122.25 | 6.0119 | Al-Cl bend |
| 9 | 158.47 | 5.1949 | Al-Cl bend |
| 10 | 194 | 2 | Al-Cl bend |
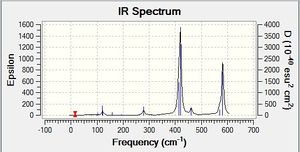
| 12 | 279 | 26 | Al-Br/Al-Cl stretch (bridging) |
| 13 | 309 | 2 | Al-Cl stretch (bridging) |
| 14 | 413 | 149 | Al-Cl stretch (bridging) |
| 15 | 420 | 409 | Al-Cl stretch (bridging) |
| 16 | 461 | 36 | Al-Cl Al-Br stretch (bridging + terminal) |
| 17 | 570 | 34 | Al-Cl Al-Br stretch (terminal) |
| 18 | 582 | 277 | Al-Cl stretch (terminal) |
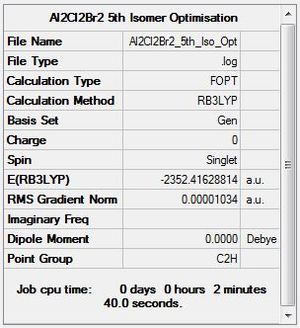
B3LYP/6-31G level, Isomer 5
Optimisation log file here
| summary data | convergence | Jmol | |||
|---|---|---|---|---|---|
|
Item Value Threshold Converged? Maximum Force 0.000019 0.000450 YES RMS Force 0.000009 0.000300 YES Maximum Displacement 0.000584 0.001800 YES RMS Displacement 0.000198 0.001200 YES Predicted change in Energy=-3.789425D-09 Optimization completed. |
|
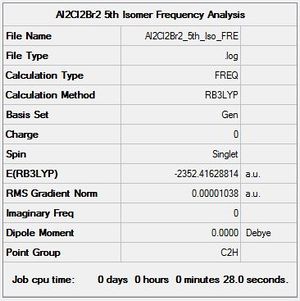
Al2Cl2Br2 Isomer 5 Symmetry
Optimisation log file here
| summary data | low modes |
|---|---|
|
Low frequencies ---   -4.0872   -2.1697   -0.0043   -0.0042   -0.0029    1.2886
 Low frequencies ---   17.7558   48.9700   72.9549
|
Vibrational spectrum for Al2Cl2Br2 Isomer 5
| Mode | Frequency | Intensity | Type |
| 6 | 117 | 9 | Br-Al-Cl bend (terminal) |
| 7 | 119 | 13 | Al-Br/Al-Cl bend (terminal) |
| 9 | 160 | 6 | Al-Cl bend (terminal) |
| 12 | 280 | 29 | Al-Cl stretch (bridging) |
| 14 | 414 | 149 | Al-Cl stretch (bridging) |
| 15 | 421 | 439 | Al-Cl stretch (bridging) |
| 18 | 579 | 316 | Cl-Al-Br Stretch (terminal) |
Energy Comparison for the Isomers of Al2Cl2Br2
| Isomer Energies | ΔE [kJ/mol] |
| E(2)-E(1) | (-)182.517696kJ/mol |
| E(3)-E(1) | (-)381.679848kJ/mol |
| E(4)-E(1) | (-)379.280304kJ/mol |
| E(5)-E(1) | (-)380.156328kJ/mol |
The lowest energy isomers will be those of highest frequency. In the calculations above the lowest energy isomer is isomer 1.
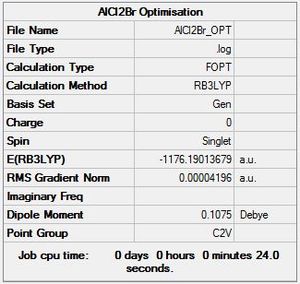
AlCl2Br Monomer
B3LYP/LANL2ZD level
Optimisation log file here
| summary data | convergence | Jmol | |||
|---|---|---|---|---|---|
|
Item Value Threshold Converged? Maximum Force 0.000136 0.000450 YES RMS Force 0.000073 0.000300 YES Maximum Displacement 0.000760 0.001800 YES RMS Displacement 0.000497 0.001200 YES Predicted change in Energy=-7.984435D-08 Optimization completed. |
|
For the dissociation of Al2Cl2Br2 into two monomers of AlCl2Br:
Al2Cl2Br2 → 2AlCl2Br ΔE=1371.77 kJ/mol, showing that the AlCl2Br would much rather form dimers in order to relieve the electron deficiency on the Aluminium; it is a Lewis acid and will not be very stable as the monomer and will thus accept electron density into its low-lying p-orbitals.
Frequency Comparison 1
| Isomer | Mode | Frequency | Intensity | Type |
| 1 | 13 | 247 | Not IR active | 
|
| 2 | 16 | 493 | 107 | 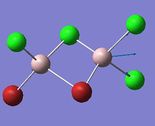
|
| 3 | 17 | 503 | 104 | 
|
| 4 | 16 | 461 | 36 | 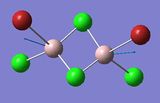
|
| 5 | 16 | 459 | Not IR active | 
|
The modes listed in the table shows the displacement of the Al atoms in the same plane as the bridging Cl atoms. Starting off with Isomer 1. as it is symmetrical this mode will not be IR-active as the prerequisite for a molecule to be IR-active is it to have a change in dipole moment, and in this case the change is cancelled out by an equal and opposite motion. However, comparing the displacement of the Al atoms with that of Isomer 2, exchanging one of the bridging Br atoms for one of the terminal Cl atoms induces an asymmetry that results in an IR-active mode which occurs at a higher frequency, 247 vs. 493 [cm−1].
Knowing that , this is quite a significant difference ΔV=246 [cm−1] showing that the same motion in isomer 2 is of higher energy, since the Frequency, v, is proportional to the Energy, E (E∝v). This is, however, expected since the Al-Cl bond is stronger than the Al-Br bond.
Interestingly, the difference in frequency between isomer 2 and isomer 3 is not great, ΔV=10 [cm−1] indicating that it does not make that big of a difference if the Br-atoms are placed in geminal (terminal) or bridging position. Comparing isomer 4 and isomer 5, the difference between if the terminal Br-atoms are cis or trans does not produce a significant difference; ΔV=2 [cm−1], (where cis is the higher energy isomer) and so in conclusion the trans vs. cis configuration does not produce as large difference in frequency as compared to geminal terminal or bridging indicating that it is the number of bonds between the atoms that is significant.
Frequency Comparison 2
| Isomer | Mode | Frequency | Intensity | Type |
| 1 | 18 | 616 | 332 | 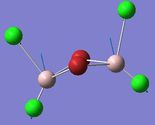
|
| 2 | 17, 18 | 574, 615 | 122, 197 | 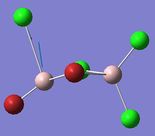 
|
| 3 | 16, 18 | 495, 615 | 134, 177 | 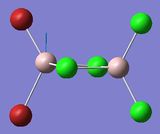 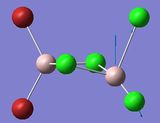
|
| 4 | 18 | 582 | 277 | 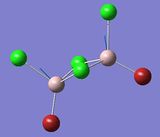
|
| 5 | 18 | 579 | 316 | 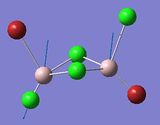
|
From looking at the modes where the Aluminium atoms are moving up and down in an orthogonal motion to the bridging Br/Cl atoms one can tell that the asymmetry that is induced in isomer 2 and 3 give rise to two modes instead of one, 17 and 18 for the orthogonal displacement. Comparing these modes with that of isomer 1 show a difference in frequency Δv=40 cm-1 and Δv=1 cm-1. Mode 18 in isomer 2 where the Al-Cl bond stretches is significantly closer in energy to that of isomer 1 in comparison to mode 17 where the Al is bonded one terminal and one bridging Br atom. This effect is also shown from comparing isomer 2 with isomer 3 where the Δv=79 cm-1 for the mode where the Al with two geminal (terminal) Br atoms are stretching and Δv=0 for the mode where the Al with two geminal (terminal) Br atoms are stretching. And so the effect of having one terminal and one bridging Br atom only have a significant effect on stretches of bonds of atoms that are directly bonded to the Br atoms. As in Frequency Comparison 1. for isomer 4 and 5 the Δv=3cm-1, and like before the higher energy isomer was the cis-configuration.
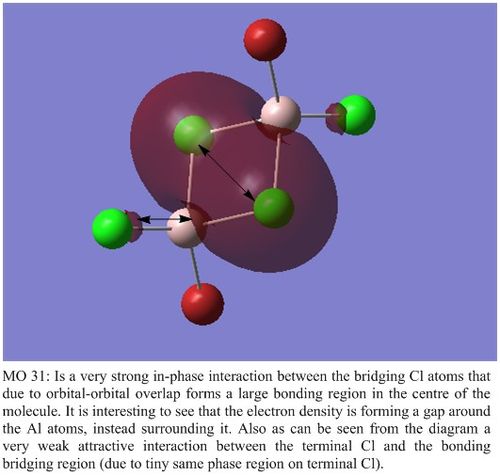
MO Analysis of Isomers 5
As Isomer 1 and Isomer 5 were lowest in energy, I chose to do a Molecular Orbital Analysis of Isomer 5.
| Molecular Orbital 31 | Molecular Orbital 34 |
|

|
| Molecular Orbital 41 | Molecular Orbital 47 |

|

|

|
References
- ↑ IUPAC. Compendium of Chemical Terminology, 2nd ed. (the "Gold Book"). Compiled by A. D. McNaught and A. Wilkinson. Blackwell Scientific Publications, Oxford (1997). XML on-line corrected version: http://goldbook.iupac.org (2006-) created by M. Nic, J. Jirat, B. Kosata; updates compiled by A. Jenkins. ISBN 0-9678550-9-8. doi:10.1351/goldbook.
- ↑ "Bond Lengths and Energies." UWaterloo, n.d. Web. 21 Nov 2010. http://www.science.uwaterloo.ca/~cchieh/cact/c120/bondel.html.
- ↑ Frey, Paul Reheard. College Chemistry, 3rd Edition Prentice-Hall. 1965 p. 134.
- ↑ Michigan State University. Organic Chemistry [web access:23/10/14 20.00] http://www.cem.msu.edu/~reusch/OrgPage/bndenrgy.htm.
- ↑ Atomic Structure and Periodicity: RSC (Tutorial Chemistry Texts), 2002, J. Barrett, E W Abel, A G Davies, D. Phillips, J D. Woollins), C. Drayton. ISBN-10: 0854046577.

