User:Jt2010
3rd Year Computational Lab
Module 2: Hunt
BH3
Link to BH3 Optimization Analysis:
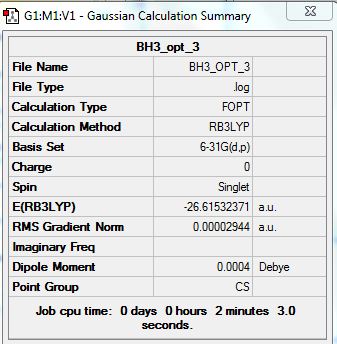
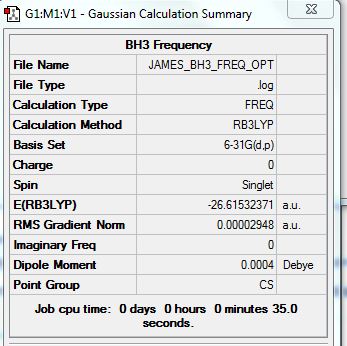
Summary containing all the information required and the basis set used for the calculation:
test molecule |
This is the item information which gives that the optimization worked successfully.
        Item               Value     Threshold  Converged?
 Maximum Force            0.000019     0.000450     YES
 RMS     Force            0.000011     0.000300     YES
 Maximum Displacement     0.000143     0.001800     YES
 RMS     Displacement     0.000086     0.001200     YES
 Predicted change in Energy=-3.091865D-09
 Optimization completed.
    -- Stationary point found.
                           ----------------------------
                           !   Optimized Parameters   !
                           ! (Angstroms and Degrees)  !
 --------------------------                            --------------------------
 ! Name  Definition              Value          Derivative Info.                !
 --------------------------------------------------------------------------------
 ! R1    R(1,2)                  1.1944         -DE/DX =    0.0                 !
 ! R2    R(1,3)                  1.1944         -DE/DX =    0.0                 !
 ! R3    R(1,4)                  1.1944         -DE/DX =    0.0                 !
 ! A1    A(2,1,3)              120.0095         -DE/DX =    0.0                 !
 ! A2    A(2,1,4)              119.9953         -DE/DX =    0.0                 !
 ! A3    A(3,1,4)              119.9953         -DE/DX =    0.0                 !
 ! D1    D(2,1,4,3)            180.0            -DE/DX =    0.0                 !
 --------------------------------------------------------------------------------
Bonds in this context can be defined as when total energy reaches an optimum and the gradient evens out. In this case this happens when the total energy = -26.24 au
BH3_opt_631g
Link to Optimization Analysis:
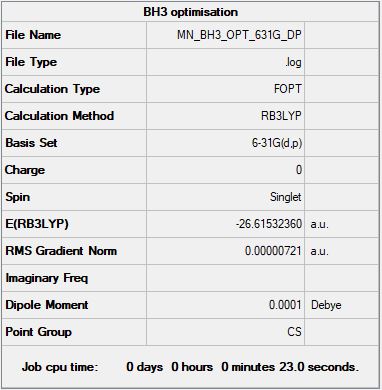
The summary for the BH3 molecule which has been optimized using a better basis set:
test molecule |
Item Table:
Item               Value     Threshold  Converged?
 Maximum Force            0.000152     0.000450     YES
 RMS     Force            0.000080     0.000300     YES
 Maximum Displacement     0.001032     0.001800     YES
 RMS     Displacement     0.000879     0.001200     YES
 Predicted change in Energy=-2.705532D-07
 Optimization completed.
    -- Stationary point found.
                           ----------------------------
                           !   Optimized Parameters   !
                           ! (Angstroms and Degrees)  !
 --------------------------                            --------------------------
 ! Name  Definition              Value          Derivative Info.                !
 --------------------------------------------------------------------------------
 ! R1    R(1,2)                  1.1922         -DE/DX =    0.0                 !
 ! R2    R(1,3)                  1.1922         -DE/DX =    0.0                 !
 ! R3    R(1,4)                  1.1924         -DE/DX =    0.0                 !
 ! A1    A(2,1,3)              120.1049         -DE/DX =   -0.0002              !
 ! A2    A(2,1,4)              119.9476         -DE/DX =    0.0001              !
 ! A3    A(3,1,4)              119.9476         -DE/DX =    0.0001              !
 ! D1    D(2,1,4,3)            179.9289         -DE/DX =    0.0001              !
 --------------------------------------------------------------------------------
Difference in energy between 3-21G optimized and 6-31G(d,p)difference = 0.24512924
However the difference in energy can not be compared directly as different basis sets were used.
B-H Bond Length: 1.19221 armstrong
H-B-H Bond Angle: 120.10486 degrees
TlBR3
Link to Optimization Analysis:
D-space Link: http://hdl.handle.net/10042/20912
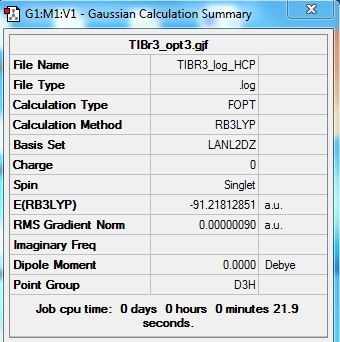
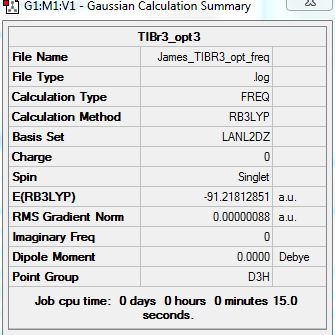
TIBR3 molecule summary which has been optimized using HCP.
test molecule |
   Item               Value     Threshold  Converged?
 Maximum Force            0.000002     0.000450     YES
 RMS     Force            0.000001     0.000300     YES
 Maximum Displacement     0.000022     0.001800     YES
 RMS     Displacement     0.000014     0.001200     YES
 Predicted change in Energy=-6.084134D-11
 Optimization completed.
    -- Stationary point found.
                           ----------------------------
                           !   Optimized Parameters   !
                           ! (Angstroms and Degrees)  !
 --------------------------                            --------------------------
 ! Name  Definition              Value          Derivative Info.                !
 --------------------------------------------------------------------------------
 ! R1    R(1,2)                  2.651          -DE/DX =    0.0                 !
 ! R2    R(1,3)                  2.651          -DE/DX =    0.0                 !
 ! R3    R(1,4)                  2.651          -DE/DX =    0.0                 !
 ! A1    A(2,1,3)              120.0            -DE/DX =    0.0                 !
 ! A2    A(2,1,4)              120.0            -DE/DX =    0.0                 !
 ! A3    A(3,1,4)              120.0            -DE/DX =    0.0                 !
 ! D1    D(2,1,4,3)            180.0            -DE/DX =    0.0                 !
 --------------------------------------------------------------------------------
Tl-Br Bond Length: 2.65095 Armstrong
Br-Tl-Br Bond angles: 120.00000 degrees
BBR3
Link to Optimization Analysis:
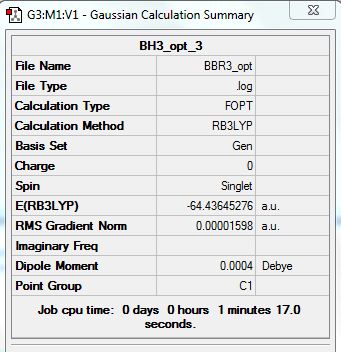
Summary:
test molecule |
Item               Value     Threshold  Converged?
 Maximum Force            0.000035     0.000450     YES
 RMS     Force            0.000020     0.000300     YES
 Maximum Displacement     0.000144     0.001800     YES
 RMS     Displacement     0.000093     0.001200     YES
 Predicted change in Energy=-6.219588D-09
 Optimization completed.
    -- Stationary point found.
                           ----------------------------
                           !   Optimized Parameters   !
                           ! (Angstroms and Degrees)  !
 --------------------------                            --------------------------
 ! Name  Definition              Value          Derivative Info.                !
 --------------------------------------------------------------------------------
 ! R1    R(1,2)                  1.934          -DE/DX =    0.0                 !
 ! R2    R(1,3)                  1.934          -DE/DX =    0.0                 !
 ! R3    R(1,4)                  1.934          -DE/DX =    0.0                 !
 ! A1    A(2,1,3)              119.9984         -DE/DX =    0.0                 !
 ! A2    A(2,1,4)              119.9984         -DE/DX =    0.0                 !
 ! A3    A(3,1,4)              120.0033         -DE/DX =    0.0                 !
 ! D1    D(2,1,4,3)           -180.0018         -DE/DX =    0.0                 !
 --------------------------------------------------------------------------------
B-Br Bond Length: 1.93401 Armstrong
Br-B-Br Bong Angles: 120.00020 degrees
Compare BH3, BBr3 and TIBr3
| BH3 | TIBr3 | BBr3 | |
|---|---|---|---|
| Bond Length (Armstrong) | 1.19221 | 2.65095 | 1.93401 |
| Bond Angle (degrees) | 120.10486 | 120.00000 | 120.00020 |
From the data shown, it can be seen that the molecules which have the substituent ligands as Br atoms have much larger bong lengths. This is mainly due an increase in size of the ligand from H to Br, which increases the steric repulsion. Br and H are different is size and properties, however they both need only one more electron to complete their outer shell of electrons. In this respect they usually form single bonds.
When we change the central atom from B-Tl it can be seen that the bond angle is much more stable at 120.00000 degrees. The reason for this extra stabilization is that TI is a much larger central atom and as such the ligands have more space to attach to the central atom, so can optimize at better angles.
Tl and B are similar in that they are in the same group and as such prefer to form 3 bonds in the trigonal planar arrangement. However Tl is much larger than B and this allows more space for the ligands, so the steric repulsions will be less and the overall energy of the molecule will be lower and as such much more stable.
Bonding in Guassview
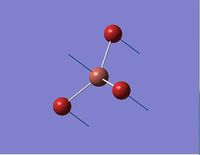
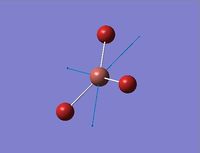
The bonding in Guassview sometimes does not draw bonds where we would normally expect them to be. The reason for this is not because they do not exist but because the bond distance exceeds some pre-defined value and as such the bonds are not drawn in by the program. As such the bond exists but is not represented by a line.
A bond is formed when the molecule is optimized and the bonds can be formed. Only when the ligands are in their correct positions and distances from each other can bonds be formed and as such in this instance a bond can form when the molecule is optimized and the optimization leads to a decrease in total energy.
BH3 Frequency Calculations
Frequency Analysis File: File:JAMES BH3 FREQ OPT.LOG
test molecule |
Summary:
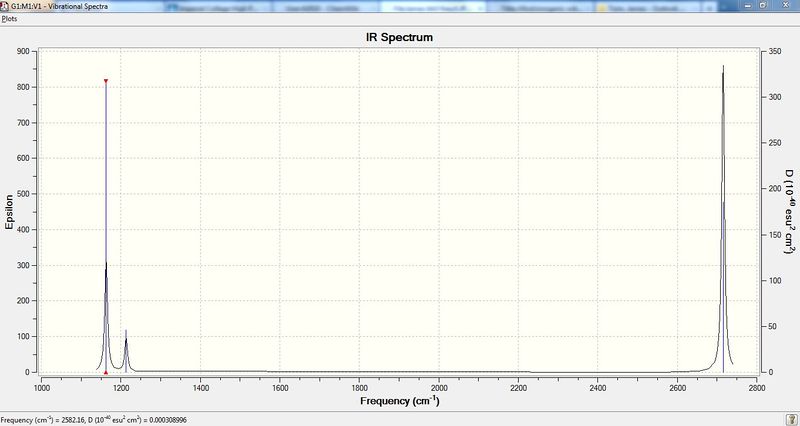
Low frequencies ---   -5.4856   -0.0012   -0.0009   -0.0005    4.3595   15.7526
 Low frequencies --- 1163.0070 1212.9841 1213.4664
Computed IR Spectrum of the molecule:
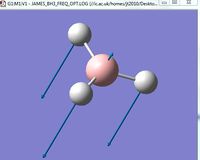
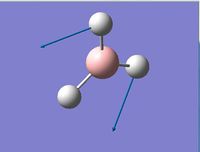
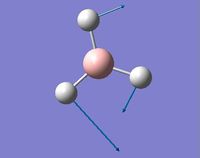
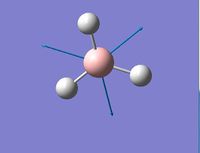
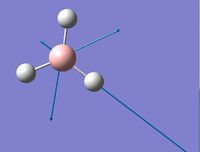
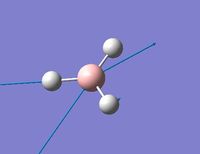
From the spectrum it can be seen that there are only 3 peaks when there should be 6 peaks. The reason for less peaks in the IR spectrum is because the frequency of the vibrations are too low in intensity. Another reason is that only vibrations which cause a change in the dipole moment are observed, and in this case only 3 of the vibrations cause a change in the dipole moment.
TlBr3 Frequency Analysis
Frequency analysis file:
D-space Link: http://hdl.handle.net/10042/20914
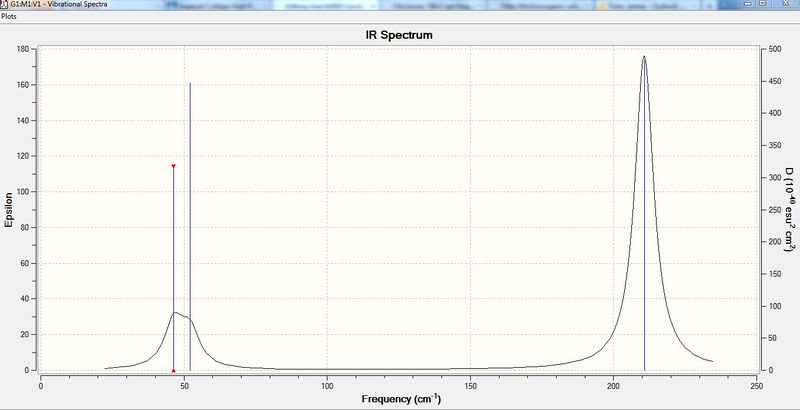
Summary:
  Low frequencies ---   -3.4213   -0.0026   -0.0004    0.0015    3.9367    3.9367
 Low frequencies ---   46.4289   46.4292   52.1449
Spectrum:
BH3 and TlBr3 Compare Frequencies
Table of Frequencies:
| Number | Frequency (Hz) BH3 | Frequency (Hz) TlBr3 | ||
|---|---|---|---|---|
| 1 | 1163.01 | 46.43 | ||
| 2 | 1212.98 | 46.43 | ||
| 3 | 1213.47 | 52.14 | ||
| 4 | 2582.16 | 165.27 | ||
| 5 | 2715.10 | 210.69 | ||
| 6 | 2715.54 | 210.69 |
The big difference in vibrating frequencies for BH3 and TlBr3 indicates that the BH3 molecule vibrates much more compared to the TlBr3 molecule. As such the frequency of the absorbed radiation for the vibrations of the BH3 molecule is bigger than that for the TlBr3 molecule. This is due to the fact that the TlBr3 molecules are much heavier and therefore vibrate much less.
There has been no reordering of the modes and this is due to the fact that although the ligands are different the structure and bonding is similar and such they vibrate in the same way. The spectra are similar in that only 3 peaks are observed in the spectrum. For TlBr3 there is a little bit of overlap and this is due to the smaller vibrations.
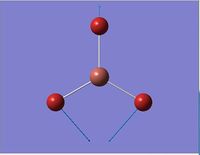
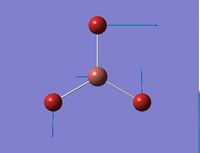
The reason why the A1' and E' modes lie higher in energy is due to the vibration causing a greater change in dipole moment and also causing some steric clashing. This is turn means that the mode will be higher in energy to achieve this vibration.
You must use the same method and basis set for optimization and frequency analysis calculations, as they provide the conditions, criteria and assumptions for that calculation. If the same method and basis set were not used then the optimization would not directly correspond with the frequency analysis and it would not be a true calculation for the molecule.
The reason for carrying out frequency analysis is so that we can work out not only how many modes there are, but how these vibrations actually happen, there frequency and their intensities. Therefore from this we can work out some properties of the molecule and compare it to others.
The low frequencies represent the 3N-6 vibrational frequencies of a molecule. They represent the vibrations of the central atom and that of the ligand.[1]
Molecular Orbitals
Population Analysis:
D-space Link: http://hdl.handle.net/10042/20924
Summary:
NBO from calculation:
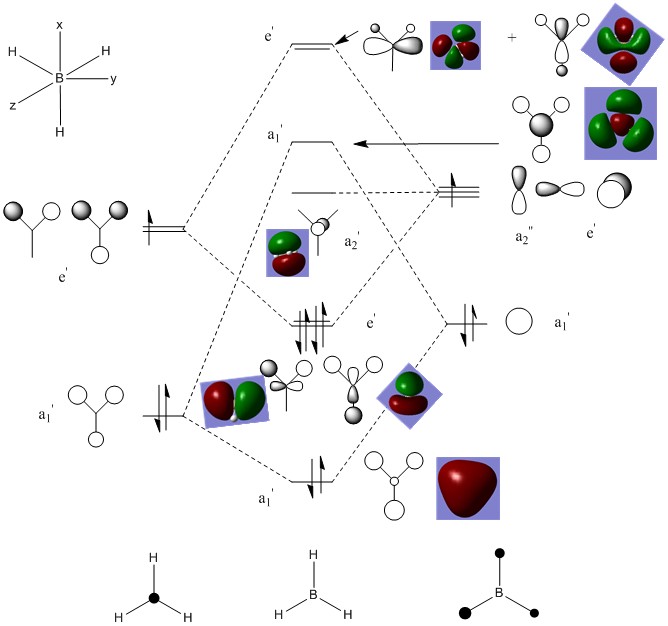
MO Diagram:
From the diagram above, it can be seen that there is no significant differences between the real and LCAO MOs. This means that the accuracy and usefulness of qualitative MO theory is useful in determining the electron density distribution of orbitals.
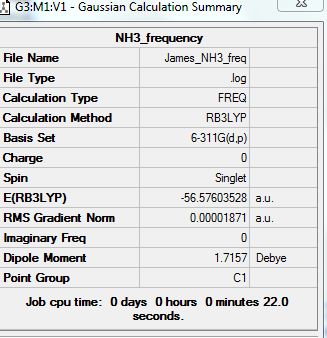
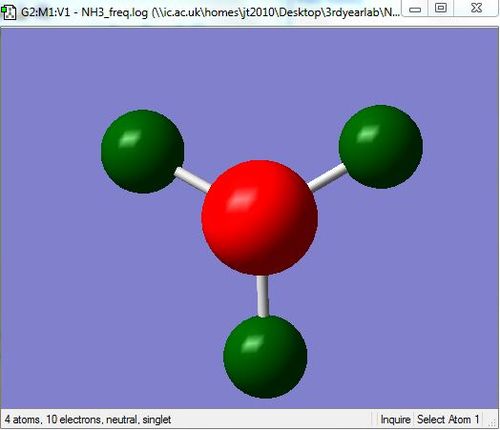
NH3
Optimization analysis:
test molecule |
Summary:
 Item               Value     Threshold  Converged?
 Maximum Force            0.000013     0.000450     YES
 RMS     Force            0.000009     0.000300     YES
 Maximum Displacement     0.000882     0.001800     YES
 RMS     Displacement     0.000401     0.001200     YES
 Predicted change in Energy=-1.228456D-08
 Optimization completed.
    -- Stationary point found.
                           ----------------------------
                           !   Optimized Parameters   !
                           ! (Angstroms and Degrees)  !
 --------------------------                            --------------------------
 ! Name  Definition              Value          Derivative Info.                !
 --------------------------------------------------------------------------------
 ! R1    R(1,2)                  1.0059         -DE/DX =    0.0                 !
 ! R2    R(1,3)                  1.0059         -DE/DX =    0.0                 !
 ! R3    R(1,4)                  1.0059         -DE/DX =    0.0                 !
 ! A1    A(2,1,3)              116.161          -DE/DX =    0.0                 !
 ! A2    A(2,1,4)              116.1555         -DE/DX =    0.0                 !
 ! A3    A(3,1,4)              116.155          -DE/DX =    0.0                 !
 ! D1    D(2,1,4,3)           -142.0359         -DE/DX =    0.0                 !
 --------------------------------------------------------------------------------
Frequency Analysis:
Summary:
Frequencies:
Low frequencies ---  -39.1033  -36.6023  -14.8553   -0.0018   -0.0016    0.0010
 Low frequencies ---  459.9351 1681.1325 1681.2065
Population Analysis:
File:NH3 POPULATION ANALYSIS.LOG
NH3 Charge Distribution
Charge distribution by color:
Charge Limits are: -0.865 to 0.865
Charge Distribution by numbers:
The NBO charges for Nitrogen are ).865 and the NBO charge for Hydrogen is 0.288
Association Energies: Ammonia-Borane
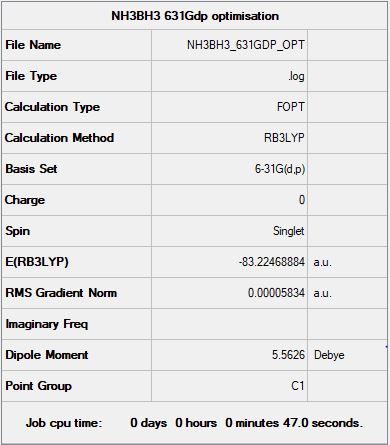
Optimization Analysis:
test molecule |
Summary:
Item               Value     Threshold  Converged?
 Maximum Force            0.000121     0.000450     YES
 RMS     Force            0.000057     0.000300     YES
 Maximum Displacement     0.000508     0.001800     YES
 RMS     Displacement     0.000294     0.001200     YES
 Predicted change in Energy=-1.611642D-07
 Optimization completed.
    -- Stationary point found.
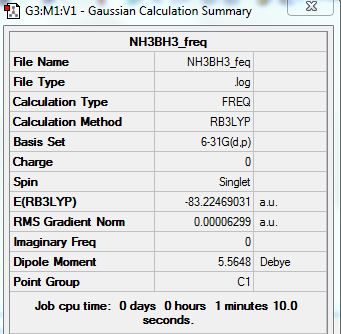
Frequency Analysis:
Summary:
 Low frequencies ---   -0.0012   -0.0009   -0.0004   18.4289   23.8632   41.9195
 Low frequencies ---  266.4197  632.3169  639.8513
Energies:
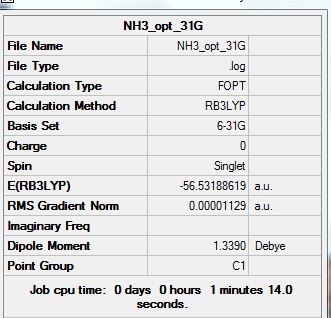
E(NH3) = -56.53188619 AU
E(BH3) = -26.61532371 AU
E(NH3BH3) = -83.22469031 AU
Energy difference = E(NH3BH3)-[E(BH3)+E(NH3)]
Energy difference = -83.22469031 + 83.1472099
Energy difference = -0.07748041 AU
Energy difference = -203.4246935 KJ/mol[2]
Ionic Liquids, designer solvents Part 1: Comparison of Selected 'Onium' Cations
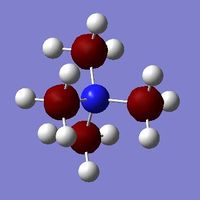
[N(CH3)4]+
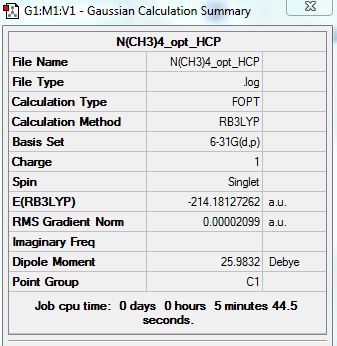
Optimization analysis:
D-Space Link: http://hdl.handle.net/10042/20929
Summary:
test molecule |
Item               Value     Threshold  Converged?
 Maximum Force            0.000074     0.000450     YES
 RMS     Force            0.000017     0.000300     YES
 Maximum Displacement     0.000605     0.001800     YES
 RMS     Displacement     0.000161     0.001200     YES
 Predicted change in Energy=-4.648848D-08
 Optimization completed.
    -- Stationary point found.
Frequencies:
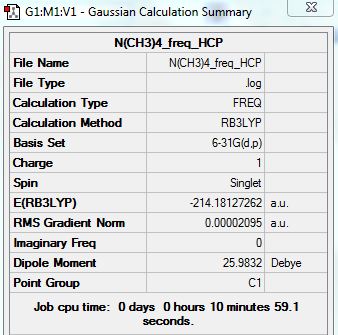
Frequency Analysis:
D-space Link: http://hdl.handle.net/10042/20933
Summary:
Low frequencies ---  -13.0246    0.0006    0.0007    0.0008    6.1520   11.9059
 Low frequencies ---  179.8775  278.8635  285.6949
[P(CH3)4]+
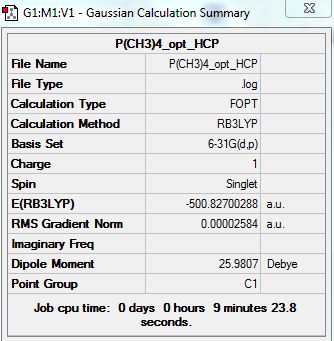
Optimization Analysis:
D-space Link: http://hdl.handle.net/10042/20931
Summary:
test molecule |
 Item               Value     Threshold  Converged?
 Maximum Force            0.000148     0.000450     YES
 RMS     Force            0.000033     0.000300     YES
 Maximum Displacement     0.000960     0.001800     YES
 RMS     Displacement     0.000313     0.001200     YES
 Predicted change in Energy=-1.853525D-07
 Optimization completed.
    -- Stationary point found.
Frequencies:
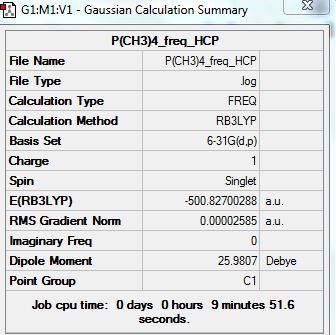
Frequency Analysis:
D-space Link: http://hdl.handle.net/10042/20934
Summary:
Low frequencies ---  -16.6401   -0.0030   -0.0019   -0.0014    4.1223   16.1794
 Low frequencies ---  153.2905  183.0706  190.9459
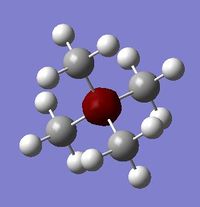
[S(CH3)4]+
Optimization Analysis:
D-space Link: http://hdl.handle.net/10042/20931
Summary:
test molecule |
Item               Value     Threshold  Converged?
 Maximum Force            0.000040     0.000450     YES
 RMS     Force            0.000009     0.000300     YES
 Maximum Displacement     0.000531     0.001800     YES
 RMS     Displacement     0.000155     0.001200     YES
 Predicted change in Energy=-1.318119D-08
 Optimization completed.
    -- Stationary point found.
Frequencies:
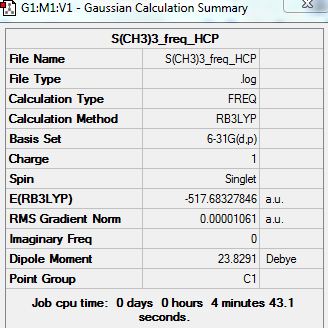
Frequency Analysis:
D-space: http://hdl.handle.net/10042/20936
Summary:
Low frequencies ---  -13.3190  -11.3800   -0.0025    0.0013    0.0015   22.9482
 Low frequencies ---  158.6053  194.1634  198.4824
MO's
Below are the MO's for [N(CH3)4]+:
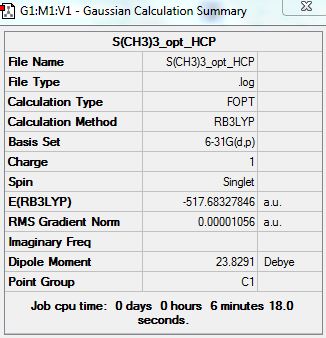
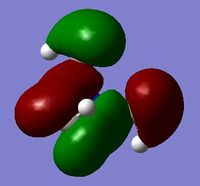
The MO's have been produced through MO analysis on HCP with the additional keywords "Full NBO". Below are a set of 5 MO's which range from highly bonding down to highly anti-bonding.
In this MO, it can be seen that most of the molecule is bonding. As such the AO's have strong orbital overlap. There is very strong through space bonding overlap. Only one node is present in the center of the molecule. The MO is strongly de-localised.
In this view we can see that anti-bonding is starting to emerge in the MO's. As such the AO's have weak bonding overlap. Through space bonding is still happening in the MO, however this is also through space anti-bonding emerging. Nodes are present on each of the 4 carbons and the central atom. The MO is still de-localised.
In this MO it can be seen that there is just as much anti-bonding as there is bonding. Through space anti-bonding has now become quite large, however there is still alot of bonding overlap. Nodes will appear between in and out of phase electron density clouds. De-localisation is has started to become less obvious.
In this MO, it can be seen that anti-bonding interactions are beginning to dominate. As such the AO's have weak anti-bonding overlap. Through space anti-bonding is dominating with nodes between each of the different phased electron density clouds. The MO is weakly de-localised.
Very strong anti-bonding is seen in this MO. As such the AO's have strong anti-bonding overlap. Through space anti-bonding is very strong with large surface area of different phased electron clouds. The nodes will be between these different sheets of electron clouds. The Mo is very weakly de-localised.
NBO's
[N(CH3)4]+ D-Space Link: http://hdl.handle.net/10042/20939
[P(CH3)4]+ D-Space Link: http://hdl.handle.net/10042/20941
[S(CH3)4]+ D-Space Link: http://hdl.handle.net/10042/20942
[N(CH3)4]+
File: File:N(CH3)4 MO.log
Charge Range: -1.000 to 1.000
[P(CH3)4]+
File: File:P(CH3)4 MO.log
Charge Range: -1.000 to 1.000
[S(CH3)4]+
File: File:S(CH3)3 MO.log
Charge Range: -1.000 to 1.000
| Number | [N(CH3)4]+ | [P(CH3)4]+ | [S(CH3)4]+ | ||
|---|---|---|---|---|---|
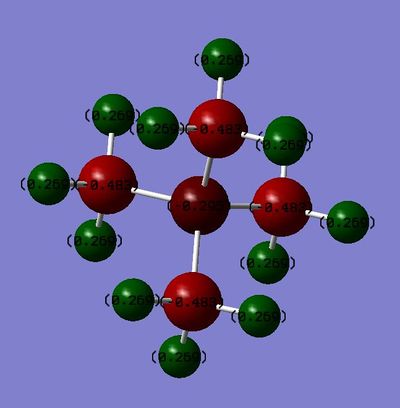
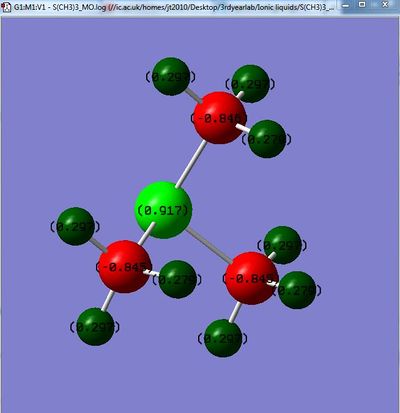
| Charge on central atom | -0.295 | 1.667 | 0.917 | ||
| Charge on Carbon | -0.483 | -1.060 | -0.846 | ||
| Charge on Hydrogen | 0.269 | 0.298 | 0.297 (0.279 for Hydrogens slightly further from Sulphur |
From the table above, it can be sen that the Nitrogen atom is most electron rich whilst Phosphorus and Sulfur are electron deficient, with Phosphorus being more electron deficient than Sulfur. Nitrogen is most electron rich as it is a very electron-negative atom, and is more electronegative than Carbon. As such electron density is donated towards the Nitrogen which is why it has a negative charge density value.
For Phosphorus and Sulfur, Sulfur is more electron negative than Phosphorus and as such has a lower charge than Phosphorus. On top of that Sulfur is more electron negative than Carbon. As such it will be electron donating towards the Sulfur. As Phosphorus is less electron negative than Carbon it will be opposite in this case.
This is all reflected in the values for the carbon atom, where the Electron density is C(P)>C(S)>C(N). The reason for this is Phosphorus donates electron density to the carbons, whilst for Sulfur and Nitrogen this is the opposite way round with Nitrogen withdrawing the most electron density from the carbon atoms.
The same trend is seen for the Hydrogen atoms, however they are affected less due to distance. It should be noted though that for the Hydrogen's which are furthest from the Sulfur atom on [S(CH3)4]+ electron density on these hydrogen's is higher. This means that less electron density is being withdrawn by the Sulfur and it also shows that the Sulfur still has significant impact at 2 bond lengths distance. [3]
| Number | [N(CH3)4]+ | [P(CH3)4]+ | [S(CH3)4]+ | ||
|---|---|---|---|---|---|
| Contribution of Carbon | ( 33.65%) s( 20.76%)p 3.81( 79.07%)d 0.01( 0.16%) | ( 59.56%)s( 25.24%)p 2.96( 74.68%)d 0.00( 0.08%) | ( 48.67%)s( 19.70%)p 4.07( 80.16%)d 0.01( 0.14%) | ||
| Contribution of Hetero atom | ( 66.35%) s( 25.00%)p 3.00( 74.97%)d 0.00( 0.03%) | ( 40.44%) s( 25.01%)p 2.96( 74.14%)d 0.03( 0.85%) | ( 51.33%)s( 16.95%)p 4.86( 82.42%)d 0.04( 0.63%) |
The results from the table above relate to the charge distribution just studied as from the table it is possible to see that the more positive charged the hetero atom the greater contribution from the Carbon atom towards the bond. This is in the order of C-P>C-S>C-N and from the charge distribution table we can see the positive P>S>N. From this trend it is possible to see how the 2 results relate.
[NR4]+
Based on the results for [N(CH3)4]+, the description that there is a full positive charge placed on the Nitrogen is invalid. As from the table for charge distribution, we can clearly see there should be a slight negative charge on the Nitrogen atom, and the positive charge is actually distributed across all the Hydrogen atoms. However the reason why the positive charge is placed on the Nitrogen normally is for ease of depiction. It is the central point for where the excess charge is.
Ionic Liquids, designer solvents Part 2: Influence of Functional Groups
{N(CH3)3(CH2OH)]+
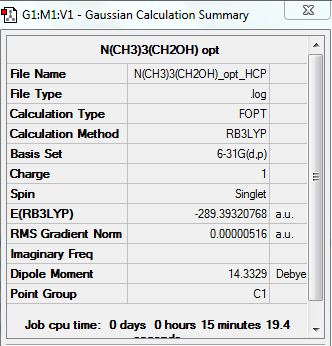
Optimization Analysis:
File:N(CH3)3(CH2OH) opt HCP.log
D-space Link: http://hdl.handle.net/10042/20946
Summary:
test molecule |
Item               Value     Threshold  Converged?
 Maximum Force            0.000008     0.000450     YES
 RMS     Force            0.000002     0.000300     YES
 Maximum Displacement     0.000422     0.001800     YES
 RMS     Displacement     0.000081     0.001200     YES
 Predicted change in Energy=-3.067229D-09
 Optimization completed.
    -- Stationary point found.
Frequencies:
Frequency Analysis:
File:N(CH3)3(CH2OH) freq HCP.log
D-space Link: http://hdl.handle.net/10042/20950
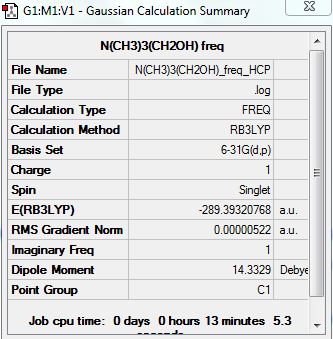
Summary:
Low frequencies --- -125.8305  -18.9294   -7.7264    0.0005    0.0006    0.0008
 Low frequencies ---    6.8058  124.4789  210.3464
{N(CH3)3(CH2CN)]+
Optimization Analysis:
File:N(CH3)3(CH2CN) opt HCP.log
D-space: http://hdl.handle.net/10042/20948
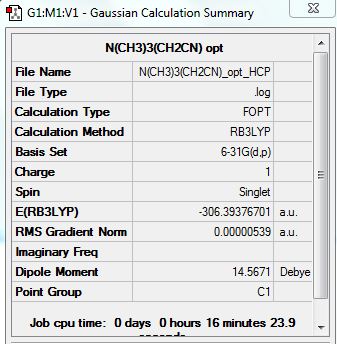
Summary:
test molecule |
Item               Value     Threshold  Converged?
 Maximum Force            0.000021     0.000450     YES
 RMS     Force            0.000005     0.000300     YES
 Maximum Displacement     0.001212     0.001800     YES
 RMS     Displacement     0.000292     0.001200     YES
 Predicted change in Energy=-1.366537D-08
 Optimization completed.
    -- Stationary point found.
Frequencies:
Frequency Analysis:
File:N(CH3)3(CH2CN) freq HCP.log
D-space Link: http://hdl.handle.net/10042/20951
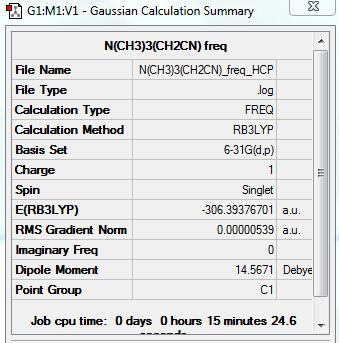
Summary:
Low frequencies ---   -4.1918   -0.0003    0.0005    0.0007    6.2330   14.0866
 Low frequencies ---   91.1099  153.8131  210.7761
MO's and NBO's {N(CH3)3(CH2OH)]+
MO Population Analysis:
File:N(CH3)3(CH2OH) MO HCP.log
Summary:
NBO
{N(CH3)3(CH2OH)]+ D-space Link: http://hdl.handle.net/10042/20952
{N(CH3)3(CH2CN)]+ D-space Link: http://hdl.handle.net/10042/20953
Charge Range: -1.000 to 1.000
MO's and NBO's {N(CH3)3(CH2CN)]+
MO Population Analysis:
File:N(CH3)3(CH2CN) MO HCP.log
Summary:
NBO
Charge Range: -1.000 to 1.000
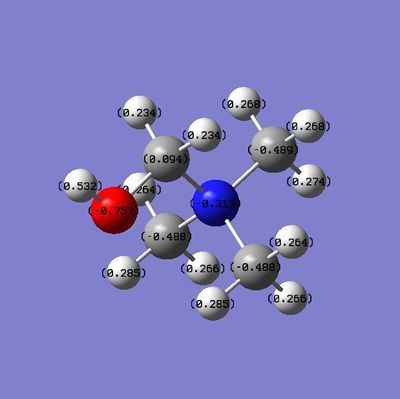
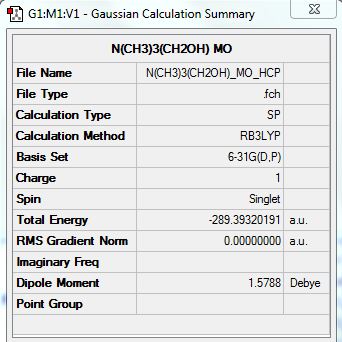
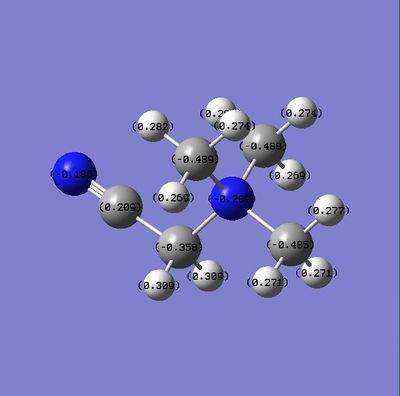
Compare charge Distribution {N(CH3)3(CH2CN)]+ & {N(CH3)3(CH2OH)]+
| Number | {N(CH3)3(CH2OH)]+ | [N(CH3)3(CH2CN)]+ | ||
|---|---|---|---|---|
| Charge on central atom | -0.313 | -0.289 | ||
| Charge on O/N | -0.757 | -0.186 | ||
| Charge on adjacent Carbon | 0.094 | 0.209 |
From what can be determined from the diagrams and table above, the OH is an electron donating group and he CN is an electron withdrawing group. The Oxygen atom has is a very electron negative group but has lone pairs which i can donate into the system. As such The electron negativity on the adjacent carbon is increased a lot. Also if we compare the value of the central atoms between {N(CH3)3(CH2OH)]+ (-0.313) and [N(CH3)4]+ (-0.295). This proves that OH is an electron donating group as it has pushed electron density onto the central atom.
For [N(CH3)3(CH2CN)]+, CN is a electron withdrawing and this can be seen as the central atom has had some electron density withdrawn from it.
Compare and Contrast HOMO and LUMO of [N(CH3)4]+, {N(CH3)3(CH2CN)]+ & {N(CH3)3(CH2OH)]+
| Number | [N(CH3)4]+ | {N(CH3)3(CH2OH)]+ | [N(CH3)3(CH2CN)]+ | ||
|---|---|---|---|---|---|
| HOMO | 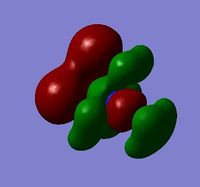 |
 |
| ||
| LUMO | 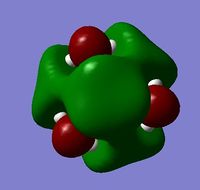 |
 |
| ||
| HOMO Energy | -0.57929 | -0.46627 | -0.50048 | ||
| LUMO Energy | -0.13305 | -0.11995 | -0.18184 |
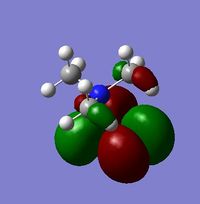
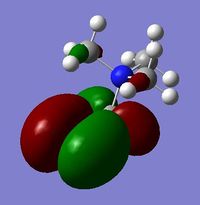
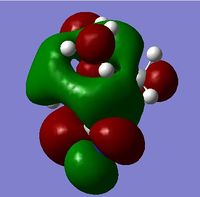
For the HOMO levels the shape of the MO's have not changed much for {N(CH3)3(CH2CN)]+ & {N(CH3)3(CH2OH)]+. However the shape is completely different for [N(CH3)4]+. This is because the different ligands which the other 2 molecules have. However we can see that they are all distinctly strong anti bonding. For the LUMO all the molecules exhibit strong anti-bonding.
The relative energies of the HOMO and LUMO have moved with the different molecules. This is due to the nature of the electron negative substituents. This has huge chemical impact as if the LUMO is lower in energy it will be easier for the system to accept an electron and therefore will be more reactive. If it is higher in energy then it will be harder to accept and electron and therefore less reactive. As such, {N(CH3)3(CH2OH)]+ is more reactive than [N(CH3)4]+!, but [N(CH3)3(CH2CN)]+ is less reactive.
References
- ↑ M. Wyart et al 2005 Europhys. Lett. 72 486
- ↑ Morrison, C. A. and M. M. Siddick (2004). "Dihydrogen Bonds in Solid BH3NH3." Angewandte Chemie International Edition 43(36): 4780-4782.
- ↑ Porezag, D. and M. R. Pederson (1999). "Optimization of Gaussian basis sets for density-functional calculations." Physical Review A 60(4): 2840-2847

