User:Js8712
EX3
Geometry Specifications - Distances/Bond Angles
| BH3 | BBr3 | GaBr3 | |
|---|---|---|---|
| r(E-X) (Ao) | 1.19 | 1.93 | 2.35 |
| θ(X-E-X) (degrees) | 120.0 | 120.0 | 120.0 |
Borane
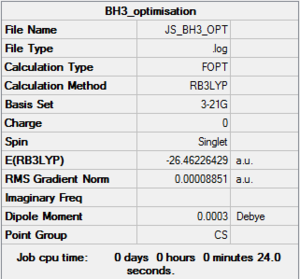
B3LYP/3-21G level
Optimisation log file here
B3LYP/6-31G(d,p) level, an improved basis set
Optimisation log file here
| summary data | convergence | Jmol | |||
|---|---|---|---|---|---|

|
Item Value Threshold Converged? Maximum Force 0.000203 0.000450 YES RMS Force 0.000098 0.000300 YES Maximum Displacement 0.000867 0.001800 YES RMS Displacement 0.000415 0.001200 YES |
|
GaBr3
B3LYP/LanL2DZ
Optimisation log file DOI:10042/143662
| summary data | convergence | Jmol | |||
|---|---|---|---|---|---|

|
Item Value Threshold Converged? Maximum Force 0.000000 0.000450 YES RMS Force 0.000000 0.000300 YES Maximum Displacement 0.000003 0.001800 YES RMS Displacement 0.000002 0.001200 YES |
|
BBr3
B3LYP/GEN
Optimisation log file DOI:10042/143663
| summary data | convergence | Jmol | |||
|---|---|---|---|---|---|

|
Item Value Threshold Converged? Maximum Force 0.000008 0.000450 YES RMS Force 0.000005 0.000300 YES Maximum Displacement 0.000035 0.001800 YES RMS Displacement 0.000023 0.001200 YES |
|
Questions
Compare and contrast the data you have obtained. Your analysis should be 2-3 paragraphs long. Some leading questions you should consider are:
What difference does changing the ligand have?
How are H and Br similar, how are they different?
What difference does changing the central element make?
How are B and Ga similar, how are they different?
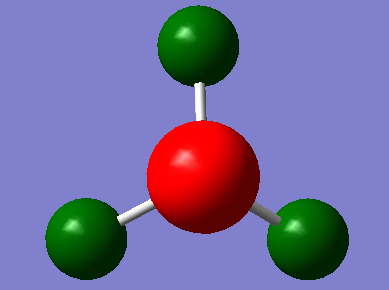
Three EX3 systems were studied up to this point. All three systems had had a trigonal planar geometry, with a D3H point group upon imposing symmetry. The three systems therefore by definition had X-E-X bond angles which approached 120 oC. It should be noted that all three systems while similar in the sense that they all contain a central group 13 element, and are inherently electron deficient on the central atom (they are lewis acids). They are noticeably different with regards to E-X bond lengths/bond strengths. All bond lengths of the EX3 systems to be discussed and analysed further will be based on the individual covalent radii of the atoms, which make up the constituent bonds. It should be noted that the use of covalent radii, makes the assumption that bonding is purely covalent. This, of course is an oversimplified model. Any deviations from covalency in the E-X bonds of the EX3 species will be discussed and explained on their own merit.
From adding the individual covalent radii of the respective E and X in each system, literature predicts the bond length of B-H to be 119 ppm. This value closely correlates to the value predicted for the B-H bond length after optimisation with the 6-31G(d,p) basis set (119.243 ppm). This correlation predicts that B-H bonding within BH3 is almost strictly covalent, with minor contributions from other possible interactions differences in electronegativity (H ~ 2.1, B ~2.0). Similar analysis can be conducted on the BBr3 system. Assuming interactions are purely covalent, the bond length of BBr3 can be derived from the sum of the individual covalent radii of B and Br, which gives 196 ppm. The value obtained for the B-Br bond length after optimisation using the GEN basis set was determined to be 193 ppm. It should be immediately evident that there is a larger deviation from pure covalency compared to BH3. This can be attributed to the electron deficient nature of the BX3 systems. Due to their Sp2 nature, all systems have an unhybridised p orbital in line with the C3 principle access. In the BH3 system, the ligands are simple H atoms, containing 1 electron in their respective 1s orbitals. It is because of this lack of available orbitals that H is only able to make a single bonding interaction with B. This stands in sharp contrast to the bromine ligands present in BBr3. In both systems the central atom remains constant, meaning that any deviation from “ideal covalency” can be attributed to a change of ligand. The first immediate difference between the two systems already described, is the bigger difference in electronegativity between B (~2.0) and Br (~2.8) than the borane species (H ~ 2.1, B ~2.0). Another factor to take into account is the extra available lone pairs present on the bromine, which cannot be found on hydrogen. Due to the planar geometry of the molecule, the 3p orbitals on each of the bromines are able to interact with the empty 2p orbital on the boron. The partial pi bonding interactions, cause an increase in the B-Br bond order, generating partial double bond character. Aside from the differences in the nature of the bonding between B-Br and B-H, it should be noted that they are also similar in the sense that both H and Br form a single bond with Boron.
The final system that was analysed was GaBr3, through optimisation with a LanL2DZ basis set, the bond length was determined to be 2.35. Once again, assuming a purely covalent interaction, the sum of the respective Ga and Br covalent radii, gives 240 ppm. The difference in bond length is again minor, this can be explained by the change of central atom. Gallium, like boron is a group 13 element. However because it is lower down the group, it is less lewis acidic than boron. As a result there is less of a driving force for the Br ligands to donate electron density into the empty Ga p-orbital. This pi donation is also significantly weaker, due to poorer overlap between in the 3p-3p interaction compared to the 2p-3p interaction present in BBr3. The decrease in overlap between X-Br when moving down the group is clearly noticeable because of the increase in bond length.
It should be noted that BH3 would in standardised conditions exist in the dimeric form. Describing the bonding in such a system is even more complex because apart from the standard 2c-2e bonds, the bridging bonds are 3c-2e.
What is a bond?
A bond can be described as a build up of the total electron density between two nuclei. From an molecular orbital theory perspective, totally bonding orbitals exhibit maximum in-phase overlap. Not all bonding orbitals are completely bonding, but if there are more in-phase interactions than out of phase interactions, the MO can be classified as "bonding." Even by using MO theory, the definition of a bond is very broad. We must distinguish between primary and secondary orbital overlap. Natural bonding orbitals, result from primary orbital overlap, while secondary orbital overlaps result from stereoelectronic interactions. In our discussion we will focus on primary orbital overlap when we describe "bonds." By using the Born-Oppenheimer approximation it is possible to separate the overall wavefunction into the constitutive nuclear and electronic wavefunctions. This approximation assumes that the position of the nuclei remains constant. As the nuclei change position, the electrons will rearrange accordingly immediately. A bond is a very vague description of this overall concept, especially considering that a bond can be manipulated (stretched, compressed etc). Usually when I hear the word "bond" I consider it to be the location of electrons with respect to the two nuclei, which minimises the overall energy, which is often called the equilibrium bond length, to find the optimum length for a given "bond" we need to take into account various interactions. Electrons are negatively charged particles, which sit in between the two positively charged nuclei, holding the 2 nuclei together. Various types of bonding are present, in some cases such as diatomics, the electrons are equally shared between the two nuclei. However, in other cases, the electrons are polarised more to one of the two nuclei involved in the bond (the more electronegative one).
How much energy is there in a strong, medium and weak bond? Give examples of each type of bond (strong, medium and weak)
The strength of a bond is a very relative concept. It should first be noted that there are several forms of bonding, ionic being the strongest (coulombic interactions), covalent, metallic, electron deficient bonding, and intermolecular bonding such as hydrogen bonding (can also be intramolecular). Ionic bonding is based on charge-charge coulombic interactions. Ionic bonding is often reported in terms of lattice energies, where the smaller the ion pair, the stronger the corresponding lattice energy (the Li-F bond is stronger than the Cs-I bond). In covalent bonding, there are also varying degrees in strength. As expected, triple bonds are stronger than double bonds which are consequently stronger than single bonds (for the same elements involved). The N-N bond is a good example of this, where the N-N single bond has a bond energy of ~160 kJ/mol1, N=N has a bond energy of ~418 kJ/mol1, and N≡N has a bond energy of ~941 kJ/mol1 (strong bond). Orbital overlap and electronegativity also have an effect on the bond energy. H-X (where X = halogen) shows a decreasing strength as the difference in electronegativity is decreased (going down the group). Halogen-halogen bonds are purely covalent in nature and are thus inherently weak compared to the N≡N bond. Their weakness is in part due to the lone pair-lone pair repulsion, which are especially notable in the F-F bond (158 kJ/mol). However, compared to electron deficient bonds, these halogen-halogen bonds still have a relatively high bond energy, we can therefore assign them as “medium strength bonds.” Electron deficient bonds are constitutionally quite weak, because the electron density is spread over a larger area (more nuclei). There are examples within this subset of bonding, 3c-2e (diborane) and 4c-2e to ([MeLi]4) to name just a few. Hydrogen bonds are another class of bonding, which are often classified as “weak.” However this is again relative, considering that bond energy of hydrogen bonds depends mainly on the type of hydrogen bond present. Hydrogen bonds involving fluorine have been reported to have a similar bond energy as the N-N single bond, while there have also been “hydrogen bonds” reported as weak as 2 kJ/mol.2
In some structures gaussview does not draw in the bonds where we expect, why does this NOT mean there is no bond?
Gaussview does not have the chemical intuition of a chemist. Therefore it is unable to reason whether to draw a bond or not in certain occasions. Gaussian expects a bond length for a certain type of bond between two atoms (with a certain uncertainty). If however for whatever reason (a bad optimisation for example, or forcing a wrong point group upon the molecule), the atoms will be too far apart for Gaussview to recognise the presence of a bond. Borane, for example, usually exists as a dimer (diborane), however the bonding in the dimeric form of borane is very different from the bonding of its monomer counter part. As a result, Gaussview might not recognise the presence of the weak 3c-2e bond, because it expects the B-H bond to have a distance on the order of a regular 2c-2e bond B-H bond. In conclusion, Gaussview is a very useful tool in determining optimised structures, as well as predicting various properties. However, a computer program is only as intelligent as its user, without any chemical intuition, Gaussview will not produce accurate results.
BH3 B3LYP/6.21G(d,p)
Frequency file here
| Summary Data | Low modes |
|---|---|
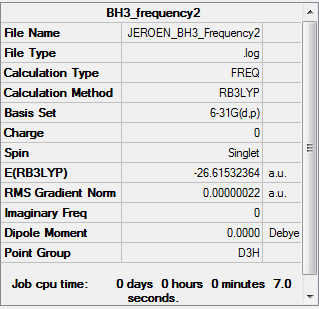 |
Low frequencies --- -9.6311 -9.6170 -0.1740 0.0008 0.5207 1.0594 Low frequencies --- 1162.9886 1213.1485 1213.1487 |
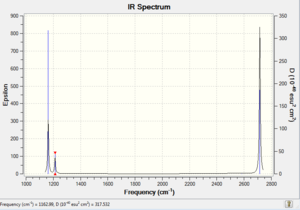
Vibrational spectrum for BH3
| wavenumber | Intensity | IR active? | type |
| 1163 | 93 | yes | bend (wagging) |
| 1213 | 14 | very slight | bend (rocking) |
| 1213 | 14 | very slight | bend (scissoring) |
| 2583 | 0 | no | stretch (symmetric) |
| 2716 | 126 | yes | stretch (anti-symmetric) |
| 2716 | 126 | yes | stretch (anti-symmetric) |
There are six vibrations for BH3, however upon analysis of the obtained IR spectrum, only 3 peaks are observed. The peak size is proportional to the peak intensity, which is proportional to the change in dipole moment. Upon investigation, it can be noted that the anti-symmetric stretches reported at 2716 cm-1 are the modes of vibration which cause the greatest change in dipole. In comparison the degenerate rocking and scissoring modes of vibration cause the smallest change in dipole moment. The symmetric stretch found at 2583 cm-1 has an intensity of zero, it is IR forbidden. This is because, overall there is no change in dipole moment. Since one of the IR selection rules states that there needs to be a change in dipole moment, it can be concluded that this symmetric stretch is not IR active. There are 6 modes of vibrations in the BH3 molecule, whereof one is inactive (symmetric stretch), 2 pairs are doubly degenerate (1213 cm-1 (rocking/scissoring), and 2716 cm-1), and one which does not have a degenerate counterpart (1163 cm-1 (wagging)).
GaBr3 B3LYP/LanL2DZ
Frequency file DOI:10042/143688
| Summary Data | Low modes |
|---|---|
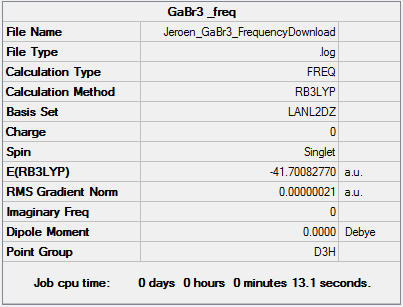 |
Low frequencies --- -1.4877 -0.0015 -0.0002 0.0096 0.6540 0.6540 Low frequencies --- 76.3920 76.3924 99.6767 |
Vibrational spectrum for GaBr3
| wavenumber | Intensity | IR active? | type |
| 76 | 3 | very slight | bend (scissoring) |
| 76 | 3 | very slight | bend (rocking) |
| 100 | 9 | very slight | bend (wagging) |
| 197 | 0 | no | stretch (symmetric) |
| 316 | 57 | yes | stretch (anti-symmetric) |
| 316 | 57 | yes | stretch (anti-symmetric) |
Now compare and contrast the vibrational spectra for BH3, and GaBr3
Comparison: It is expected that both GaBr3 and BH3 will have an equal amount of peaks. Both molecular systems are not linear, and thus the number of normal modes of vibration can be calculated by 3N-6, where N is the amount of atoms in the system. Both molecules are thus predicted to have 6 modes of vibration, which as can be seen from the frequency analysis, is the case. Another similarity between the two molecules is that both molecules have 2 sets of degenerate modes of vibration, and one peak of zero intensity. As a result both vibrational spectra show 3 peaks. The similar nature of both vibrational spectra can be reasoned by the fact that both molecules are trigonal planar, both containing a group 13 central atom. Any differences within the vibrational spectra, due to a change of ligand, and due to the introduction of a different group 13 central atom, will be investigated next.
Contrast: One of the immediately obvious differences between the two vibrational spectra is the energy of the peaks. It is immediately obvious that the nature of the BH3 vibrations are of higher energy than their counterparts in GaBr3. Note that we are not comparing the total energies here, this would not be allowed because a different set was used to optimise the respective molecules. Another notable difference in both vibrational spectra is the intensity of the peaks. Upon analysing both vibrational frequency tables, it is immediately obvious that the intensities of the peaks in BH3 are significantly greater than in GaBr3. This observation suggests that BH3 vibrations are accompanied by a greater change in dipole moment than are the vibrations present in GaBr3. The nature as to why this change in dipole is greater will be further explained below. Another notable difference between the two spectra is the relative vibrational energies of the degenerate pairs within each molecule. For BH3, the degenerate pairs are those of the 2nd lowest and highest energy respectively. In contrast for GaBr3, it is evident that this pattern is not the same. Here, the lowest and highest energy vibrational modes are the degenerate pairs.
What does the large difference in the value of the frequencies for BH3 compared to GaBr3 indicate?
Upon classical treatment, the vibrational frequency is proportional v ∝ (K/μ)1/2 where K is the force constant, which is the second derivative of the potential energy, and μ is the reduced mass. K is thus proportional to the bond strength, upon analysis it can be seen that while GaBr3 has a pi contribution (due to the lone pairs on the Br being in the right orientation to be able to donate into the empty p-orbital on Ga), this “pi donation” is not present in BH3, where bonding is strictly due to sigma bonding interactions between B, and the 1s orbitals of H. However, from previous calculations it was evident that despite this pi contribution of Br in GaBr3, GaBr3 was shown to have a longer bond length than BH3. This phenomenon can be explained by the orbital overlap. Galium’s orbitals and Br’s orbitals are of greater size difference the overlapping orbitals between B and H. This decrease in overlap in GaBr3, results in longer bonds. As a result of this elongation, the force constant in GaBr3’s vibrations is lower than the force constant in BH3, resulting in lower energy vibrations.
There been a reordering of modes! This can be seen particularly in relation to the A2" umbrella motion. Compare the relative frequency and intensity of the umbrella motion for the two molecules. Looking at the displacement vectors how has the nature of the vibration changed? Why?
Upon analysis of the A2 "umbrella motion" of both BH3 and GaBr3 it is immediately evident that the vibrational frequency of this mode is substantially larger in BH3 than it is in GaBr3 (1163 cm-1 vs 100 cm-1). Also the intensity of this vibrational mode is much lower in the GaBr3 molecule, than it is in BH3. The vibrational frequency of the bond has decreased from BH3 to GaBr3, because as described earlier the reduced mass of GaBr3 is much greater than that of BH3, the bond strength is also greater for BH3. The intensity of the umbrella motion of GaBr3 is significantly lower because a smaller change in dipole is observed in its umbrella motion, compared to the umbrella motion of BH3. Upon visualising the A2 umbrella motion, it can be seen that the nature of this vibration is different for BH3 than for GaBr3. The motion is different in the sense of the displacement vectors. For BH3 it is clearly the H atoms (the outer ligands) which show the greatest displacement in the vibrational mode in question. In contrast in Ga3 it is the Ga atom (the central atom) which shows the greatest displacement within the "umbrella motion." We can attribute this difference by looking at the size of the individual atoms. In BH3, the hydrogens have a relatively lower mass than B, when looking at GaBr3 the opposite trend is observed. In this molecule, the Br's are heavier than the Ga. Overall it can be concluded that the lower the molecular mass of an atom the larger its displacement vector.
Why must you use the same method and basis set for both the optimisation and frequency analysis calculations?
By obtaining the second derivative with respect to Cartesian nuclear coordinates, we can determine the vibrational frequencies of a molecule. Doing such a calculation is only valid and correct if it performed on a fully optimised molecule, where the slope in the energy = 0 (a stationary point). This can be at the zero point energy, or at a transition state. The same basis set needs to be used for both the optimisation and frequency analysis calculations because failing to do so will produce meaningless and incorrect data.3 To explain this, one needs to understand the effects of changing the basis set. In previous calculations of BH3 we noticed that using a different basis set can result in a different point group (or loss of symmetry). These basis sets were clearly not accurate enough to find the lowest point energy with a high enough accuracy; as a result the predicted energy exhibited a significant error. If the frequency analysis uses a different basis set, then the error of the resulting analysis will be much higher, and the uncertainty of your results will not lie in line with the obtained optimised structure. It is also for this reason that every time we do an optimisation and a corresponding frequency analysis that the results summary should be checked for any discrepancies in energy. To prevent the use of a different basis set, one could set the job selection as “opt and freq.” (however this is only suitable for smaller molecules, for larger systems, these should be carried our separately).
What is the purpose of carrying out a frequency analysis?
The purpose of an optimisation is to find the lowest energy point (the zero-point energy). However, the method Gaussian uses to find a zero-point energy, is by analysing where there is a gradient of zero in energy. However this does not necessary lead to the zero-point energy. Analysing a standard energy curve illustrates that transition states or intermediates (in a reaction) also have a gradient of zero on an energy curve. This is why we carry out a frequency analysis, which allows us to determine whether the structure represents an energy minimum, or an energy maximum. By analysing the “low frequencies,” one can determine the nature of the optimisation. If any imaginary low frequencies (denoted as negative) are present, it can be concluded that the structure is not optimised to a minimum but instead represents a transition state (an energy maximum).4
What do the "Low frequencies" represent?
The frequencies near zero represent rotations and translations3, if an imaginary (denoted as negative) low frequency is found, this could be an indication that the molecule was not optimised to the equilibrium state (lowest energy), but instead to a transition state (saddle point). These low frequencies must be kept as low as possible (usually below 10), this can done by applying tighter optimisation. If this is not done then the other determined frequencies will carry a significant error. This was seen when carrying out the first frequency calculation on BH3, where applying the tight convergence criteria clearly lowered the low frequencies closer to zero. Carrying out calculations where the low frequencies deviate significantly from zero, especially on molecules with low vibrational modes will lead to significant error. This is because the low frequencies essentially describe slight changes in the centre structure. These minor deviations will have a greater influence on low energy vibrations than on higher energy vibrations.
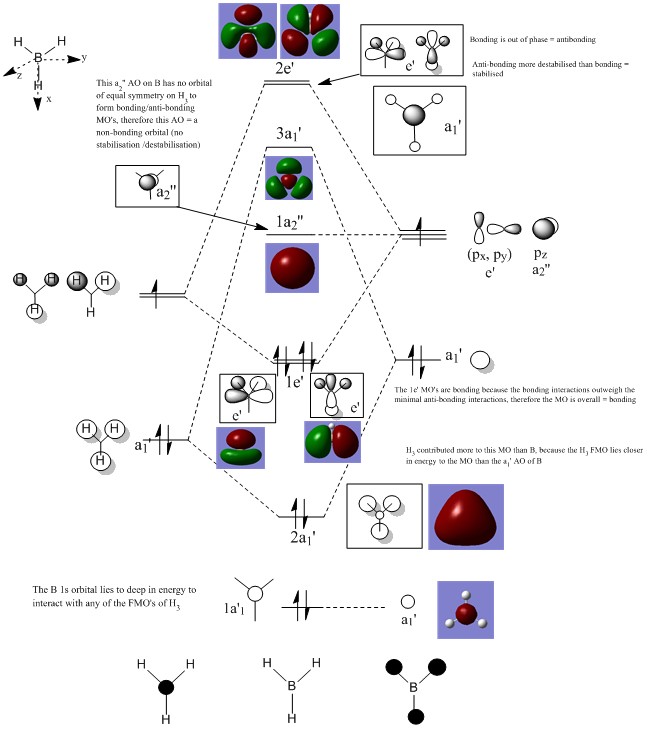
BH3 MO Diagram B3LYP/6-31G
Are there any significant differences between the real and LCAO MOs?
Analysing the lower energy MO’s of BH3 which are occupied, it is evident that the LCAO approximation, while qualitative, is very accurate at mimicking the nature of the real MO’s. This is evident from looking at the phases of the MO’s. LCAO illustrates clearly where a change in phase is observed, this is also evident amongst the real MO’s. To analyse the accuracy of LCAO, it would probably be more appropriate to study the molecular orbitals of more complex systems, where perhaps the electron density is less evenly distributed, and more polarised to one end of the molecule. This will not only affect the distribution of the electrons within the MO’s but will also establish how a change in the overlap integral might cause a deviation between the LCAO approach compared to the real MO’s. Although not visible amongst the lower energy MO’s of BH3, it should be noted that amongst the higher energy MO’s which do not carry any significant electron density, the real MO’s structure starts to significantly deviate from the structures predicted by LCAO. This is because Gaussian doesn’t optimise the MO’s which are high in energy and non-bonding in nature. Beyond the first MO’s (the bonding, anti-bonding orbitals, and the non-bonding orbitals in between), Gaussian tries to limit the calculation time, by not optimising the orbitals which are of less significance to the bonding of the molecule. Another notable difference between the real MO's and LCAO MO's that the coefficients of the AO's are overlapped in the population analysis, while in classic LCAO, the AO's coefficients are treated separately, for symmetry purposes.
What does this say about the accuracy and usefulness of qualitative MO theory?
LCAO theory relies on the sum of the constituent atomic orbitals, making the assumption that only atomic orbitals with the same symmetry, and similar energy can interact. For small molecules such as BH3 there are only a limited amount of atomic orbitals which can take part in bonding. Qualitative MO theory is a good visual tool to help in understanding what the actual MO’s will look like, however, upon analysis of the “virtual MO’s”, it can be seen that the MO’s become more diffuse and therefore, this is where qualitative MO theory starts to break down.
NH3
B3LYP/6-31G(d,p) Optimisation
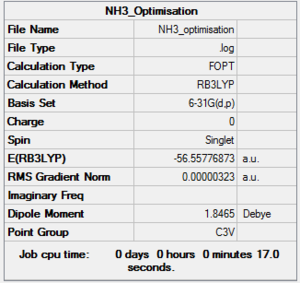
Optimisation log file here
| summary data | convergence | Jmol | |||
|---|---|---|---|---|---|
|
Item Value Threshold Converged? Maximum Force 0.000006 0.000015 YES RMS Force 0.000004 0.000010 YES Maximum Displacement 0.000012 0.000060 YES RMS Displacement 0.000008 0.000040 YES |
|
NH3
B3LYP/6-31G(d,p) Frequency calculation
Frequency Log file here
| Summary Data | Low modes |
|---|---|
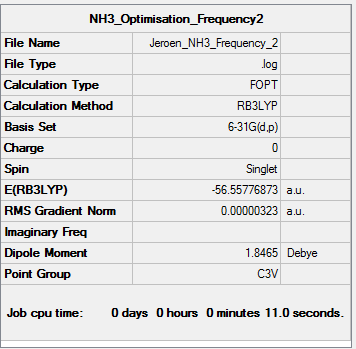 |
Low frequencies --- -0.0129 -0.0027 0.0005 7.0724 8.1020 8.1023 Low frequencies --- 1089.3849 1693.9369 1693.9369 |
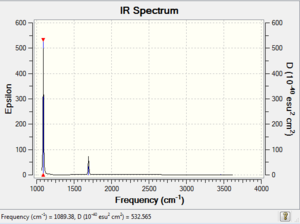
Vibrational spectrum for NH3
| wavenumber | Intensity | IR active? | type |
| 1089 | 145 | yes | bend (wagging) |
| 1694 | 14 | very slight | bend (rocking) |
| 1694 | 14 | very slight | bend (scissoring) |
| 3461 | 1 | no | stretch (symmetric) |
| 3590 | 0 | no | stretch (anti-symmetric) |
| 3590 | 0 | no | stretch (anti-symmetric) |
Population Analysis for NH3
NBO Analysis for NH3
Specific NBO Charges
| Atom | N | H |
|---|---|---|
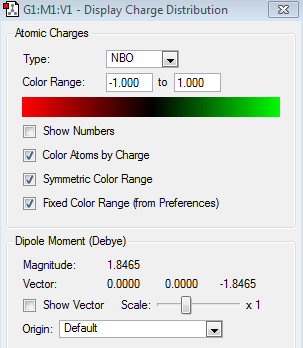
| Charge | -1.125 | 0.375 |
NH3BH3
B3LYP/6-31G(d,p) Optimisation
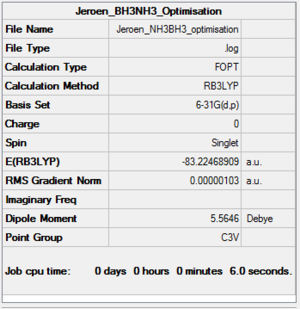
Optimisation log file here
| summary data | convergence | Jmol | |||
|---|---|---|---|---|---|
|
Item Value Threshold Converged? Maximum Force 0.000002 0.000015 YES RMS Force 0.000001 0.000010 YES Maximum Displacement 0.000006 0.000060 YES RMS Displacement 0.000002 0.000040 YES |
|
What is the energy of the dative bond?
NH3BH3
B3LYP/6-31G(d,p) Frequency calculation
Frequency Log file here
| Summary Data | Low modes |
|---|---|
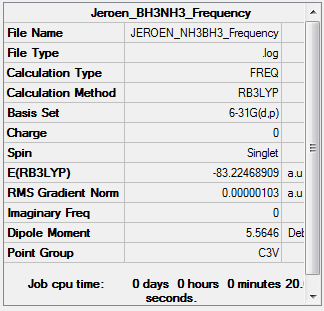 |
Low frequencies --- -5.2223 -0.3293 -0.0488 0.0006 1.1063 1.1936 Low frequencies --- 263.2984 632.9555 638.4578 |
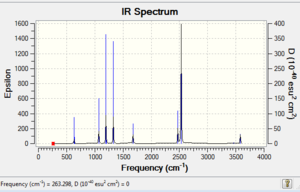
Vibrational spectrum for NH3BH3
| wavenumber | Intensity | IR active? | type |
| 263 | 0 | no | bend |
| 633 | 14 | very slight | stretch |
| 638 | 4 | no | bend |
| 638 | 4 | no | bend |
| 1069 | 41 | yes | bend |
| 1069 | 41 | yes | bend |
| 1196 | 109 | yes | bend |
| 1204 | 3 | no | bend |
| 1204 | 3 | no | bend |
| 1329 | 114 | yes | bend |
| 1676 | 28 | yes | bend |
| 1676 | 28 | yes | bend |
| 2472 | 67 | yes | stretch |
| 2532 | 231 | yes | stretch |
| 2532 | 231 | yes | stretch |
| 3464 | 3 | no | stretch |
| 3581 | 28 | yes | stretch |
| 3581 | 28 | yes | stretch |
Energy of the NH3BH3 Bond
E(NH3) = -56.5577687 a.u.
E(BH3) = -26.6153236 a.u.
E(NH3BH3) = -83.2246891 a.u.
Dissociation Energy
ΔE = E(NH3BH3)-[E(NH3)+E(BH3)]
ΔE = -0.0515968 a.u.
ΔE =-135.47 kJ/mol
Questions
Is the association of NH3 and BH3 to form a B-N bond within NH3BH3 weak, medium or strong?
The interaction between NH3 and BH3 is clearly strong enough to be considered a bond, based on the calculated value (-135.47 kJ/mol). However as described earlier, bond strengths are relative, compared to weak hydrogen bond interactions, the NH3BH3 bonding interaction is stronger. However it should be noted that this bond strength is similar to the F-F (weakly covalent) bond strength, which was reported previously to be of "medium strength." We therefore classify NH3BH3 bonding interaction as "medium", because although it does not compare in strength to previously discussed ionic interactions (LiF), or strong covalent bonds (N≡N). Similarly the NH3BH3 bonding interaction is significantly stronger than interactions which were previously described as "weak," such as electron deficient bonds, or weak hydrogen bonds.The reason we don't expect a strong bond is because on the periodic table, nitrogen and boron are not adjacent within the period. The 2S AO's of B and N do not interact because of this particular reason, as a result there is no additional stabilisation.
Is the calculated bonding energy value sensisble? How do you know what a sensible value is?
Yes it is a sensible value. The bonding energy is expected to not be extremely weak, because the BH3 is electron deficient (6 ve), and the nitrogen lone pair is readily available for donation.On the other hand, the bonding energy will not be extremely strong, because it is an adduct, in this case there are no coulombic interactions. We expect the bonding energy to be between 100-1000 kJ/mol, the calculated value lies within this range, and therefore we can classify the value as sensible.
Lewis Acids and Bases Week 2 Mini-Project
Introduction
Borane is a lewis acid, which due to its electron deficiency, readily forms dimers. Similarly to borane, group 13 lewis acids, such as the aluminium based species, are also able to form dimers, where the halogens make up the bridging atoms. This experiment will analyse various different isomers with the chemical formula Al2Cl4Br2, paying particular attention to their relative energies, as well as the driving force which allows these moieties to favourably form dimers. Additionally the importance of a change in the point group will be investigated, where close attention will be paid to any changes in the vibrational spectra, as a result of this change. All changes and their origins between the different isomers will be explained. Furthermore a detailed MO analysis will be conducted on the lowest energy isomer.
In addition to the required outlined experiments of the "mini project," additional experiments will be carried out, in order to gain a deeper understanding of some of the phenomena. Additional experiments to be conducted will include, the investigation of two enantiomers of Al2Cl4Br2, which were initially treated as a single isomer, investigating the importance of pseudopotentials, as well the the formation of a InCl2Me dimer. In particular, close attention will be paid to any changes in physical properties (in theory there should be none). According to the guidelines of the experiment, analysis needs to be done on 4 different isomers, however upon analysis of the structure and upon consultation of last year's "Main Group Chemistry" module, it is evident that a 5th isomer is possible (labeled as isomer 6). This isomer forms through intramolecular exchange. A bridging bond breaks, allowing rotation to take place, which results in a terminal and bridging ligand switching their respective positions.
Note: All total energies illustrated in the summary snapshots are quoted to 8 decimal places, this is wrong, and all analysis described as a result of relative energies will be based on energies given up to 7 decimal places. Additionally only molecules which were optimised under the same basis set conditions will be compared with regards to their relative energies. All optimisation, and frequency data of the individual isomers will be given from the start. Any specific analysis, or answers to specific questions will be given below this data.
Al2Cl4Br2 Optimisation/Frequency Analysis
All Al2Cl4Br2 isomers were constructed on Gaussview, from the initial cyclobutane moiety. Consequently the first isomer was optimised (using SCAN, and published on DSPACE) according to the 6-31G(d,p) basis set, where the symmetry was imposed, and the correct point group was set as a default. The resulting molecule was checked to be intact (correct number of bonds, bond angles, bond lengths, geometry, point group, conversion, gradient, etc). The molecule was then reoptimised with a GEN basis set, a GJF file was saved, which was edited with applying the LANL2DZdp pseudopotentials to the Br atoms, while a full electron analysis with 6-31G(d,p) basis set was applied to Cl and Al respectively. Upon changing the GJF file, this file was submitted to SCAN, and published to DSPACE. The LOG file was downloaded, and checked for any disreptancies (as was done for the first optimisation). The corresponding optimised isomer was then once again symmetry imposed for the correct point group. A frequency analysis with the same basis set was then run using SCAN, and published on DSPACE. A frequency analysis was applied to all molecules, making sure the low frequencies gave realistic values. The corresponding vibrational frequencies were quantised, and a resulting vibrational spectrum was produced.
Isomer 1
B3LYP/6-31G(d,p)/ PP LANL2DZdp
Optimisation DOI:10042/149693
| summary data | convergence | Jmol | |||
|---|---|---|---|---|---|

|
Item Value Threshold Converged? Maximum Force 0.000002 0.000015 YES RMS Force 0.000001 0.000010 YES Maximum Displacement 0.000031 0.000060 YES RMS Displacement 0.000011 0.000040 YES |
|
B3LYP/6-31G(d,p) Frequency calculation
Frequency DOI:10042/149736
| Summary Data | Low modes |
|---|---|
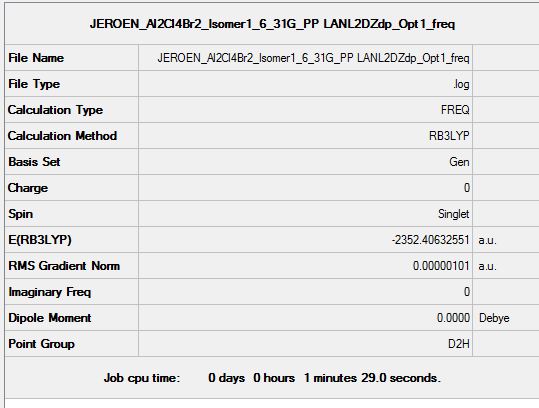 |
Low frequencies --- -0.7423 0.0024 0.0028 0.0036 1.3553 1.4531
Low frequencies --- 16.0780 63.6252 86.1130 |
Vibrational spectrum for Al2Cl4Br2 Isomer 1
| wavenumber | Intensity | IR active? | type |
| 16 | 0 | no | bend |
| 64 | 0 | no | bend |
| 86 | 0 | no | bend |
| 87 | 0 | no | bend |
| 108 | 5 | very slight | bend |
| 111 | 0 | no | bend |
| 126 | 8 | very slight | bend |
| 135 | 0 | no | bend |
| 138 | 7 | very slight | bend |
| 163 | 0 | no | bend |
| 197 | 0 | no | stretch |
| 241 | 100 | yes | stretch |
| 247 | 0 | no | stretch |
| 341 | 160 | yes | stretch |
| 468 | 346 | yes | stretch |
| 494 | 0 | no | stretch |
| 609 | 0 | no | stretch |
| 617 | 332 | yes | stretch |
Isomer 2
B3LYP/6-31G(d,p)/ PP LANL2DZdp
Optimisation DOI:10042/149786
| summary data | convergence | Jmol | |||
|---|---|---|---|---|---|

|
Item Value Threshold Converged? Maximum Force 0.000000 0.000015 YES RMS Force 0.000000 0.000010 YES Maximum Displacement 0.000012 0.000060 YES RMS Displacement 0.000004 0.000040 YES |
|
B3LYP/6-31G(d,p) Frequency calculation
Frequency DOI:10042/149841
| Summary Data | Low modes |
|---|---|
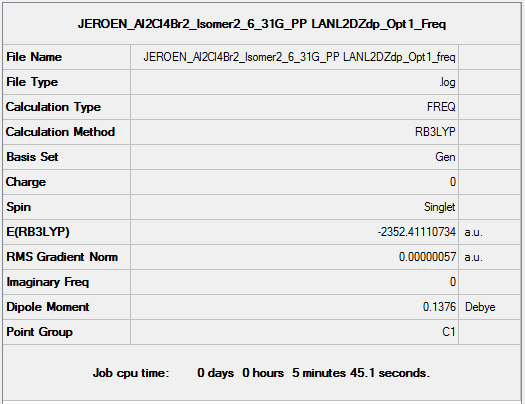 |
Low frequencies --- -0.0023 -0.0021 -0.0015 0.0801 1.1112 1.8126 Low frequencies --- 16.9440 55.9196 80.0644 |
Vibrational spectrum for Al2Cl4Br2 Isomer 2
| wavenumber | Intensity | IR active? | type |
| 17 | 0 | no | bend |
| 56 | 0 | no | bend |
| 80 | 0 | no | bend |
| 92 | 0 | no | bend |
| 107 | 0 | no | bend |
| 110 | 5 | very slight | bend |
| 121 | 8 | very slight | bend |
| 149 | 5 | very slight | bend |
| 154 | 6 | very slight | bend |
| 186 | 1 | no | bend |
| 211 | 21 | very slight | stretch |
| 257 | 10 | very slight | stretch |
| 289 | 48 | yes | stretch |
| 384 | 153 | yes | stretch |
| 424 | 274 | yes | stretch |
| 493 | 107 | yes | stretch |
| 575 | 122 | yes | stretch |
| 615 | 197 | yes | stretch |
Isomer 3
B3LYP/6-31G(d,p)/ PP LANL2DZdp
Optimisation DOI:10042/149903
| summary data | convergence | Jmol | |||
|---|---|---|---|---|---|

|
Item Value Threshold Converged? Maximum Force 0.000002 0.000015 YES RMS Force 0.000001 0.000010 YES Maximum Displacement 0.000059 0.000060 YES RMS Displacement 0.000022 0.000040 YES |
|
B3LYP/6-31G(d,p) Frequency calculation
Frequency DOI:10042/149938
| Summary Data | Low modes |
|---|---|
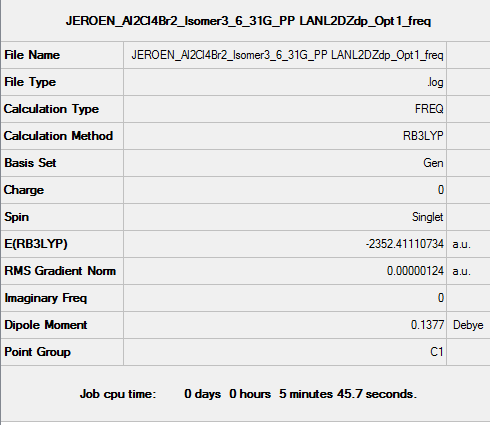 |
Low frequencies --- Low frequencies --- -0.0018 -0.0014 -0.0010 0.1616 1.1019 1.7944
Low frequencies --- 16.9437 55.9195 80.0649
|
Vibrational spectrum for Al2Cl4Br2 Isomer 3
| wavenumber | Intensity | IR active? | type |
| 17 | 0 | no | bend |
| 56 | 0 | no | bend |
| 80 | 0 | no | bend |
| 92 | 0 | no | bend |
| 107 | 0 | no | bend |
| 110 | 5 | very slight | bend |
| 121 | 8 | very slight | bend |
| 149 | 5 | very slight | bend |
| 154 | 6 | very slight | bend |
| 186 | 1 | no | bend |
| 211 | 21 | very slight | stretch |
| 257 | 10 | very slight | stretch |
| 289 | 48 | yes | stretch |
| 384 | 153 | yes | stretch |
| 424 | 274 | yes | stretch |
| 493 | 107 | yes | stretch |
| 575 | 122 | yes | stretch |
| 615 | 197 | yes | stretch |
Isomer 4
B3LYP/6-31G(d,p)/ PP LANL2DZdp
Optimisation DOI:10042/149998
| summary data | convergence | Jmol | |||
|---|---|---|---|---|---|

|
Item Value Threshold Converged? Maximum Force 0.000001 0.000015 YES RMS Force 0.000000 0.000010 YES Maximum Displacement 0.000013 0.000060 YES RMS Displacement 0.000004 0.000040 YES |
|
B3LYP/6-31G(d,p) Frequency calculation
Frequency DOI:10042/150033
| Summary Data | Low modes |
|---|---|
 |
Low frequencies --- -0.4865 -0.4844 -0.0042 -0.0033 0.0005 2.3896
Low frequencies --- 18.3299 49.2229 72.9036
|
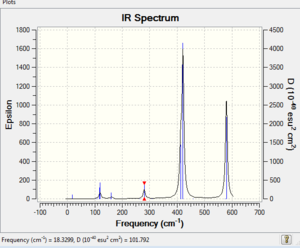
Vibrational spectrum for Al2Cl4Br2 Isomer 4
| wavenumber | Intensity | IR active? | type |
| 18 | 0 | no | bend |
| 49 | 0 | no | bend |
| 73 | 0 | no | bend |
| 105 | 0 | no | bend |
| 109 | 0 | no | bend |
| 117 | 9 | very slight | bend |
| 120 | 13 | very slight | bend |
| 157 | 0 | no | bend |
| 159 | 6 | very slight | bend |
| 192 | 0 | no | bend |
| 263 | 0 | no | stretch |
| 280 | 29 | yes | stretch |
| 308 | 0 | no | stretch |
| 413 | 149 | yes | stretch |
| 421 | 438 | yes | stretch |
| 459 | 0 | no | stretch |
| 575 | 0 | no | stretch |
| 580 | 316 | yes | stretch |
Isomer 5
B3LYP/6-31G(d,p)/ PP LANL2DZdp
Optimisation DOI:10042/150145
| summary data | convergence | Jmol | |||
|---|---|---|---|---|---|

|
Item Value Threshold Converged? Maximum Force 0.000001 0.000015 YES RMS Force 0.000000 0.000010 YES Maximum Displacement 0.000022 0.000060 YES RMS Displacement 0.000007 0.000040 YES |
|
B3LYP/6-31G(d,p) Frequency calculation
Frequency DOI:10042/150160
| Summary Data | Low modes |
|---|---|
 |
Low frequencies --- -1.5353 -0.8949 0.0025 0.0031 0.0041 1.8383
Low frequencies --- 17.4582 51.1305 78.5238
|
Vibrational spectrum for Al2Cl4Br2 Isomer 5
| wavenumber | Intensity | IR active? | type |
| 17 | 0 | no | bend |
| 51 | 0 | no | bend |
| 79 | 0 | no | bend |
| 99 | 0 | no | bend |
| 103 | 3 | no | bend |
| 121 | 13 | very slight | bend |
| 123 | 6 | very slight | bend |
| 157 | 0 | no | bend |
| 158 | 5 | very slight | bend |
| 194 | 2 | no | bend |
| 263 | 0 | no | stretch |
| 279 | 26 | yes | stretch |
| 308 | 2 | no | stretch |
| 413 | 149 | yes | stretch |
| 420 | 410 | yes | stretch |
| 461 | 35 | yes | stretch |
| 571 | 33 | yes | stretch |
| 583 | 277 | yes | stretch |
Isomer 6
B3LYP/6-31G(d,p)/ PP LANL2DZdp
Optimisation DOI:10042/150346
| summary data | convergence | Jmol | |||
|---|---|---|---|---|---|

|
Item Value Threshold Converged? Maximum Force 0.000002 0.000015 YES RMS Force 0.000001 0.000010 YES Maximum Displacement 0.000017 0.000060 YES RMS Displacement 0.000006 0.000040 YES |
|
B3LYP/6-31G(d,p) Frequency calculation
Frequency DOI:10042/152805
| Summary Data | Low modes |
|---|---|
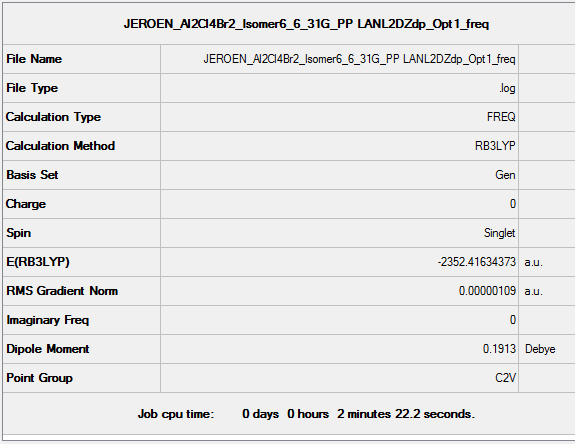 |
Low frequencies --- -0.7633 -0.5691 -0.0040 -0.0037 -0.0032 2.0583
Low frequencies --- 18.6322 51.2096 72.2021
|
Vibrational spectrum for Al2Cl4Br2 Isomer 6
| wavenumber | Intensity | IR active? | type |
| 19 | 0 | no | bend |
| 51 | 0 | no | bend |
| 72 | 1 | no | bend |
| 98 | 0 | no | bend |
| 112 | 0 | no | bend |
| 112 | 8 | very slight | bend |
| 120 | 11 | very slight | bend |
| 160 | 1 | no | bend |
| 166 | 7 | very slight | bend |
| 187 | 2 | no | bend |
| 263 | 0 | no | bend |
| 271 | 14 | very slight | stretch |
| 323 | 41 | yes | stretch |
| 413 | 150 | yes | stretch |
| 418 | 309 | yes | stretch |
| 495 | 134 | yes | stretch |
| 503 | 105 | yes | stretch |
| 616 | 177 | yes | stretch |
AlCl2Br Monomer
B3LYP/6-31G(d,p)/ PP LANL2DZdp
Optimisation DOI:10042/152961
| summary data | convergence | Jmol | |||
|---|---|---|---|---|---|
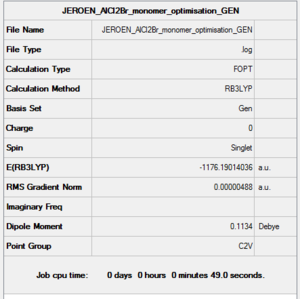
|
Item Value Threshold Converged? Maximum Force 0.000009 0.000015 YES RMS Force 0.000005 0.000010 YES Maximum Displacement 0.000049 0.000060 YES RMS Displacement 0.000027 0.000040 YES |
|
B3LYP/6-31G(d,p) Frequency calculation
Frequency DOI:10042/152966
| Summary Data | Low modes |
|---|---|
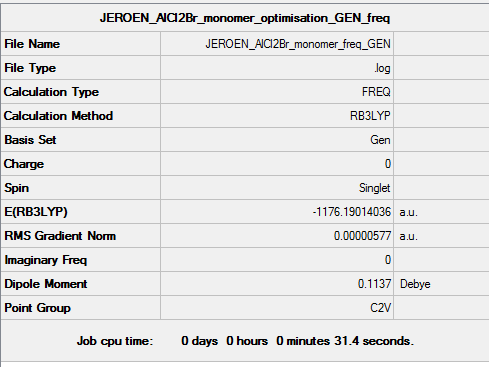 |
Low frequencies --- Low frequencies --- -0.0058 -0.0050 -0.0040 1.7832 1.9234 3.4200
Low frequencies --- 120.7373 133.8406 185.7585 |
Vibrational spectrum for AlCl2Br
| wavenumber | Intensity | IR active? | type |
| 121 | 5 | very slight | bend |
| 134 | 6 | very slight | bend |
| 186 | 33 | yes | bend |
| 314 | 7 | very slight | stretch |
| 552 | 174 | yes | stretch |
| 614 | 186 | no | stretch |
Energies of the Isomers
| Isomer 1 | Isomer 2 | Isomer 3 | Isomer 4 | Isomer 5 | Isomer 6 | |
|---|---|---|---|---|---|---|
| Etot | -2352.4063255 a.u. | -2352.4111073 a.u. | -2352.4111073 a.u. | -2352.4163010 a.u. | -2352.4162785 a.u. | -2352.4163437 a.u. |
As stated before absolute energies have very little meaning, and it is the relative energies between these isomers which we are interested in. The lowest energy conformer will be given an energy of 0 kJ/mol, all other isomer energies will be relative to this figure.
Isomer 1: 26.30 kJ/mol
Isomer 2: 13.75 kJ/mol
Isomer 3: 13.75 kJ/mol
Isomer 4: 0.11 kJ/mol
Isomer 5: 0.17 kJ/mol
Isomer 6: 0.00 kJ/mol
From the data given above it seems straightforward as to which isomer has the lowest energy, and which has the highest. However as stated, for the methods we are using the error in energy can be as high as 10 kJ/mol, as a result any differences near this value cannot be taken as accurate. From initial inspection, we thus expect isomer 6 to be the lowest energy isomer, however, with the previously stated error in mind, we cannot draw any conclusions from the differences energies between isomers 4, 5, and 6. The only conclusions we can draw from these relative energy values, is that isomer 4, 5, and 6 are lower in energy than isomer 1, 2, and 3, where isomer 1 has the highest energy. It should also be noted that isomers 2 and 3 are enantiomers. As a result they differ in the sense in how they rotate plane-polarised light, but in terms of their physical properties as well as their energies they are predicted to be identical. From the results we have obtained it is clear that the energies are in fact the same.
Discuss the position of the Br atoms with respect to the stability of the different conformers
Upon analysing the relative energies of the different isomers, it became evident that isomers 1, 2, and 3 were the highest in energy. From observing the structures of these isomers, it is immediately obvious that substituting a bridging chlorine for a bridging bromine invokes an increase in energy. Both isomer 2 and 3 (enantiomeric pair) exhibit an energy which is 13.75 kJ/mol higher than that of the most stable isomer. This increase in energy seems to be caused by a replacement of one of the chlorine bridging atoms for a bridging bromine. The reason that we expect the change in the nature of the bridging atoms is the main contribution to the rise in energy, and not the changes in position of the terminal halogens, is because, upon replacing the second bridging chlorine with a bromine, the energy rises with a similar amount, giving isomer 1. It should be noted that the difference in energy between isomer 1 and isomers 2/3 is not exactly 13.75 kJ/mol. This deviation might prove that the rise in energy is not solely caused by the bridging bromines, but can also be affected by the relative positions of the terminal halogens. However as stated before, the error of the Gaussian energy calculations can be up to ~10 kJ/mol, therefore assigning the cause of these minor deviations is purely speculative. It is all good and well to experimentally prove that bridging bromines amongst these Al2Cl4Br2 isomers raises the energy, but a theoretical approach is needed to understand, conceptually, why this is the case.
Is it Electronegativity?
Differences in electronegativity of a halogen can affect the nature of the availability of its lone pairs. In this we must compare the difference between the chlorine and bromine electronegativities, and how these differences could potentially affect their ability to act as a bridging atom. Al is electron deficient, similarly to Boron, as a result dimerisation needs to relieve this deficiency more than the monomers do (there needs to be a stabilisation). Chlorine is more electronegative and therefore less likely to donate one of its lone pairs to Al, we thus expect that the more bridging chlorines there are compared to bridging bromines, the energy would increase. As a result of this argument we would expect isomers 4, 5 and 6 to have the highest relative energies, clearly this is not the case, in fact the opposite is observed. We cannot conclude that electronegativity does not affect the relative energies of the isomers, however it is undoubtable that there must be another factor that has not yet been taken into account?
Orbital Overlap?
As discussed in previous arguments with regards to bond strengths, orbital overlap plays a key role in qualitatively determining the strength of a bond. From MO theory we know that the stronger the overlap between the FO's the greater the stabilisation/destabilisation in the resulting MO's. To determine the overall energy of the molecule it is essential that we look at the MO's and in particular the occupancy of these orbitals. It is now obvious, orbital overlap can have a significant effect on the overall energy of a molecule, but is it a plausible explanation for the patter we observe amongst the Al2Cl4Br2 isomers? Taking a look at the relative positions of chlorine and bromine in the periodic table, it can be seen that while chlorine is in period 3, bromine is in period 4. This in itself doesn't say much, not until we look at the position of aluminium! From the periodic table, it can be seen that aluminium is in the same period as chlorine. As a result of this the orbitals that need to be taken into account for bonding, are more similar in size than the contributing orbitals from Br. The similarity in orbital size will lead to a bigger stabilisation effect, leading to a more stable isomer in the case of the isomers which contain a bridging chlorine. The fact that similar orbital sizes causes a greater stabilisation, is a direct result of the Klopman-Salem equation which states, that Estab α S2/ΔEi. Assuming that orbital overlap is the principle factor which determines the relative energies of the isomers, we would expect isomer 1 to have the greatest energy, followed by isomer 2/isomer 3, followed by isomers 4, 5, and 6. This appears to be the case, even more so using the orbital overlap approach also assumes isomers 4, 5, and 6 to be degenerate (because we assume relative energies are only affected by the number of bromine bridging atoms). This also nicely matches our previous discussion, where it was stated that due to a possible error of ~10 kJ/mol, any small differences in energy must be disregarded, and so we assumed 4, 5, and 6 to be degenerate. It is clear that while hard to prove that orbital overlap is the only contributing factor to the observed pattern in relative isomers, it definitely is the dominating factor. Whether there are other factors that affect the differences in energy amongst the isomers, is hard to prove. To provide more clarity on this matter, a more accurate calculation would need to be done, which would reduce the error margins of the energy calculations. With a more refined calculation, it would be possible to determine which of the isomers 4, 5, or 6 was the most stable. This data could then be used to see how the position of the terminal (non-bridging) ligands have an effect on the relative energies. However due to the longer calculation times, and the nature of this project it is not viable to do a more precise calculation.
Is the product more or less stable than the isolated monomers?
To determine whether the lowest energy product dimer is more stable than its constituent monomers, we need to determine the bond dissociation energy. To do this the same basis set/pseudopotentials were applied to a AlCl2Br monomer, as was applied to the lowest energy isomer. This allows us to compare their relative energies, which will allow us to determine the dissociation energy. Before we carry out the calculation, we expect the the dimer to be more stable than its constituent monomers. We expect this because of knowledge of previous main group courses, where we learned that AlCl3 prefers to exist as a Al2Cl6 dimer as opposed to its AlCl3 monomeric form. Nonetheless to be absolutely certain, we have carried out a dissociation energy calculation based on the previously determined energies.
Note: Any calculations or investigations conducted on the so called "lowest energy conformer" will be conducted on isomer 6.
Determining the dissociation energy for the lowest energy conformer into 2AlCl2Br
The total energies of the molecule and its respective fragments are listed below.
E(AlCl2Br)= -1176.1901404 a.u.
E(Al2Cl4Br2)= -2352.4163437 a.u.
From these energies listed above, it is now possible to determine the dissociation energy of the molecule in its constituent fragments.
ΔE=E(Al2Cl4Br2)-[E(AlCl2Br)+E(AlCl2Br)]
ΔE= -0.0360629 a.u.
ΔE= -94.68 kJ/mol
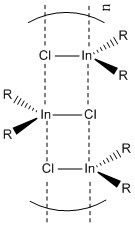
From this calculation it is evident that the isomer 6 dimer is 94.68 kJ/mol more stable than its constituent AlCl2Br monomer. In previous discussion where we made a direct comparison between the bond lengths and the effects of pi stabilisation between GaBr3 and BBr3 we concluded that pi stabilisation decreases in GaBr3 compared to BBr3. Knowing that this is the case, and knowing that Aluminium also lies further down the periodic table than B, we can predict by induction that the pi stabilisation in AlBr3 and thus probably also in AlCl2Br will be lower that that of BBr3 and BCl2Br. It is for this reason that we expect AlCl2Br to exist as a dimer. The limited pi stabilisation is not strong enough to prevent the electron deficiency relief present upon dimerisation. The dimerisation changes the characteristic trigonal planar geometry, into a more tetrahedral geometry. As a result of this we expect that the lone pairs will not be of the right orientation to cause any inherent pi stabilisation. There are now other stabilisation factors (as discussed earlier) which relieve the electron deficiency on Al. Size is another factor we have not discussed, knowing that BCl2Br is not likely to dimerise, but AlCl2 can also be attributed to size. Al is bigger than B and can therefore, more readily accompany a higher coordination number. While this argument is not necessarily a strong argument to explain the dimerisation of AlCl2Br, it is a strong explanation to explain the nature of other lewis acids, with a larger group 13 element. As was learned in 2nd year Main Group Chemistry [R2InCl]n for example does not form a dimer structure, instead it forms a staircase structure as seen in the figure below. As can be seen from the figure below, the coordination number of In, in such a staircase like polymeric structure is 5 as opposed to 4 or 3 in the dimer and monomer structures described earlier. We can therefore conclude that it is not a single factor which affects the nature of a group 13 lewis acids structure.
Discuss the IR spectra with respect to the symmetry of each conformer, why do some spectra have more bands than others?? What is the requirement for an IR band to be active?
To answer this question, we must first make ourselves aware of the selection rules in vibrational spectroscopy. The selection rule we must consider to determine whether a vibrational mode is active (has a visible intensity) or not, is whether the vibrational mode is accompanied by a change in dipole moment. If this selection rule is abided by, the vibrational mode will be active, if no change in dipole moment is observed, the vibrational mode will be inactive. From this, we can immediately imagine, the importance of how symmetrical a molecule is. Upon analysing the point groups of the Al2Cl4Br2 isomer, we notice a variety of differences. Keeping in mind the selection rule described above, and calculations described in previous simpler molecules (where symmetrical stretches were often inactive), we can predict that the less symmetry a molecule has, the more modes of vibration will become active. So looking at the specific situation of Al2Cl4Br2, it is immediately obvious that we expect isomer 2, and its enantiomer, isomer 3 to have the greatest number of active vibrational modes, due to the lack of symmetry (point group = C1). Indeed compared to the more symmetrical isomers, isomer 1, isomer, 4, isomer 5, and isomer 6, isomers 2/3 have more active vibrational modes (12 for isomers 2/3, 7 for isomers 1, and 4, 9 for isomer 5, and 10 for isomer 6). Noticeable about isomers 2/3 is that all stretches are active. This is because stretches are defined by the fact that bond lengths change in size. If there is a plane of symmetry, then the change in dipole within the stretching bonds would simply cancel each other out. However if there is no symmetry, the nature of the stretching bonds is not the same, we therefore do see a change in overall dipole, and therefore the symmetrical stretches are observed.
Discuss the position and nature of Al-Br stretching vibrations with respect to the terminal or bridging position of the Br atom. Placing images of the spectra side by side is not sufficient, tabulate the key vibrational frequencies (remember that they can reorder, so be sure you are comparing similar modes). The key word here is "discuss" just presenting images and tables is not sufficient, you must interpret your results.
| Isomer | Frequency | Intensity | Mode | Type |
| 1 | 241 | 100 | Anti-symmetric stretch (12) | Bridging |
| 1 | 247 | 0 | Symmetric stretch (13) | Bridging |
| 2 | 257 | 10 | Anti-Symmetric stretch (12) | Bridging/terminal |
| 2 | 289 | 48 | Symmetric stretch (13) | Bridging/terminal |
| 4 | 421 | 438 | Anti-symmetric stretch (12) | Terminal |
| 4 | 459 | 0 | Symmetric stretch (13) | Terminal |
| 5 | 420 | 410 | stretch (anti-symmetric) (15) | Terminal |
| 5 | 461 | 35 | Symmetric stretch (16) | Terminal |
| 6 | 418 | 309 | stretch (symmetric) (15) | Terminal |
| 6 | 495 | 134 | stretch (anti-symmetric) (16) | Terminal |
The first thing to notice is the difference in bridging Al-Br stretching and terminal Al-Br stretching frequencies. From just a brief observation, it can be seen that the terminal stretching frequencies are accompanied by a much larger wavenumber. This can be easily explained upon analysing the nature of the respective bonds. Vibrational frequency is proportional to the square root of the force constant. The bridging bonds are all 3c-2e in nature, while the terminal bonds are all 2c-2e in nature. We therefore expect the latter to be stronger bonds, and thus have a greater vibrational frequency accompanied with them. Another interesting observation we will discuss is the fact that there are two types of stretches (symmetric and anti-symmetric), both these types of stretches are present among the respective bridging and terminal Al-Br modes. Which of these stretches in the respective isomers has a higher vibrational frequency accompanied with it, is different for each isomer. Looking at the totally terminal bromine isomers (4, 5, and 6), it can be seen that these vibrational frequencies (symmetric/anti-symmetric) are all very similar, especially when these are compared to the bridging Al-Br vibrations (large difference in vibrational frequency). As a result we could argue that moving around the bromines in different terminal positions (relative to one another) does not affect the overall stretching frequencies as much as when changes are made to the amount of bridging bromines within the isomer.
After having previously postulated that it is the nature of the bridging atoms which determines the overall stability of the molecule. We can make an accurate analysis on the influence of vibrational frequencies on stabilities. We can make a direct comparison between isomer 6's bridging Al-Cl stretching frequencies, and isomer 1's Al-Br stretching frequencies. For isomer 6 we find that the anti-symmetric stretching frequency lies at 271 cm-1 (intensity = 14) while the corresponding symmetric stretching frequency lies at 323 cm-1. For isomer 1, the Al-Br bridging stretching frequencies lie at 241 cm-1 (anti-symmetric, intensity = 100), while the symmetric bridging stretching frequency lies at 247 cm-1. Immediately evident from these values is the decrease in vibrational frequency for isomer 1. This can be explained by the fact that the bridging Al-Cl bridging bonds are stronger than the Al-Br bridging bonds. The reason why this is the case has to do with orbital overlap, and was discussed earlier.
Upon analysis of the intensities of these stretching frequencies, it can be seen that isomers 1, and 4 have symmetric stretching frequencies which are inactive. These are the result of no change in dipole being accompanied with the vibrational mode in question. In contrast the asymmetric stretching frequencies (in all isomers) are IR active. It should also be noted that the terminal Al-Br stretching frequencies show a much greater intensity than do the bridging Al-Br stretches. This must mean by deduction that the terminal stretches have associated with them a greater change in dipole. We will now investigate why there is a greater change in dipole amongst these stretches. This can be explained by visualising the terminal and bridging stretching frequencies. The greater change in dipole can clearly be attributed to the greater movement of the aluminium in the terminal stretches. In the bridging stretches, it is evident that the aluminium in question is anchored into place. As a result, there is less overall movement of electrons in the molecule, and therefore we can conclude that there is a smaller change in dipole amongst these bridging stretches, compared the terminal stretches.
Another comparison we can make is the Al-Br bridging frequencies of isomers 1 and 2. As can be seen from the table above, isomer 2's bridging stretches are accompanied by a higher wavenumber than the ones associated with isomer 1. This can again be explained using an argument similar to the one before, isomer has one of the bridging bromines substituted for a chlorine, and therefore a corresponding rise in vibrational frequency is expected.
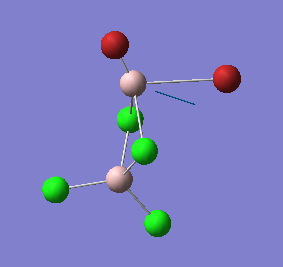
|
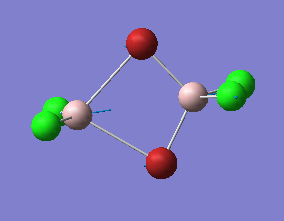
|
Molecular Orbital Analysis
An MO calculation (population analysis) was carried out on isomer 6. Upon visualising the non-core MO's, a selection of 5 MO's was made (differing in bonding nature), and correspondingly analysed
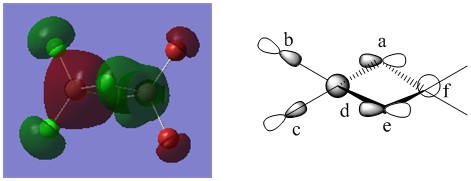
The MO illustrated above is "MO 37" from the population analysis. It is the lowest energy MO which is not classified as a so-called "core MO." From this we could predict that the MO is likely to be bonding in nature, however we will prove this with a detailed analysis that this prediction is in fact correct.
Which atomic orbitals dominate this MO?
MO 37
The first thing to notice is the phase change at the bridging chlorines. By analysing the nature of this phase change, we notice a planar node in e and a, we can therefore predict this can be represented by a p orbital (to be specific, a 3p orbital, located on the bridging chlorines). In diagram B, the planar node is also visible, there is clearly zero electron density at the nucleus. AO's labelled B and C respectively, are also assumed to be 3p orbitals (this time on the terminal chlorines). This can be explained by using a similar argument as before, there is clearly a nodal plane which runs through the centre of the respective chlorine nuclei. D and F are represented by 3s orbitals (on Al, notice that both aluminium's are represented by 3s orbitals, despite having a different phase). The reasoning behind this assignment is that no planar nodes are observed (this is only the case among s orbitals). Another reason why D and F were labelled as s orbitals is due to the slightly spherical nature of the electron density, as can be seen on both diagrams A and B. One can imagine that the superposition of an s orbital and a p orbital can generate the electron density shape observed in the real MO. At first sight the Br atoms do not have any atomic orbitals which contribute to this MO, from the real MO's one could say that some sort of electron density is observed (4p orbital on bromine), but upon closer inspection we can also see that this density is relatively low. Additionally there is a lack of interaction with any of the other AO's. As a result, it could be predicted that in fact any electron density illustrated in the real MO on Br, is due to artifacts, resulting from a population analysis which is not 100% accurate (an inaccuracy in the gaussian calculation). However it should be noted that although I previously classified these as "aritfacts," even this cannot be said with certainty, because we would expect these artifacts to be present in most MO's if this were the case. This however is not the case. Therefore I conclude that these are probably not artifacts but instead minor contributions to the MO, which have no real significance in their contribution to the overall energy of the MO.
Interactions and their nature
One of the first interactions we should discuss is the interaction between the 3p orbital located on the terminal chlorine, and the 3s orbital on the aluminium labelled as d. We predict that this interaction will be strong in nature, due to the strong s-p overlap. The 3s and 3p are close in energy, that and the fact that they are in close proximity, leads to an overall strong stabilising (same phase overlap) interaction. Another significant bonding interaction that is present is the one between the 3s orbital on aluminium d and the bridging chlorine labelled a. There once again is a strong in phase overlap between a 3s and 3p orbital in close proximity, suggesting a strong bonding interaction. Similar bonding interactions are observed between the 3p orbital labelled as A, and the aluminium's 3s orbital labelled as f, again the interaction is expected to be strongly bonding. Similar strongly bonding interactions are observed between A and e (3p orbital of bridging chlorine), and between e and f. In terms of weaker interactions, we expect a weak through space interaction bonding interaction between b and c. We classify this interaction as "weak" mainly due to the large distance that exists between these two orbitals. In terms of direction, the green phases of the 3p orbitals are pointing away from each other. There is also a weak through space bonding interaction between 3p orbitals labelled A and E. The presence of 4 nodal planes in A, B, C, and E should also be noted, however since these nodes are located on atomic centres, they are of less significance, in terms of how much they contribute to the overall energy of the MO. It can thus be concluded that the MO is overall "strongly bonding" in nature.
Which atomic orbitals dominate this MO?
MO 40
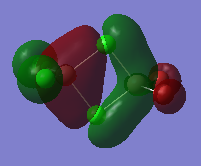
Upon analysing the real MO, denoted in diagram C, it becomes evident that all atoms within this molecule contribute to the overall nature of the MO. Upon close inspection it is easy to see that all contribution AO's to this MO are in fact p orbitals. The bridging chlorine 3p orbitals, labelled D and H lie perpendicular to the bridge. Looking at the in phase overlap between C, D, E, and H, we can conclude that C and E's 3p orbitals must be in the same orientation as D and H. Due to the fact that the terminal bonds lie in a plane which lies perpendicular to the bridging bonds. The terminal 3p (Cl), and 4p (Br) AO's lie in line with the bond, which allow them to interact with the aluminium 3p orbitals.
Interactions and their nature
Upon analysing the "real MO" it is evident that there is strong 3p-3p-3p 3c-2e pi bonding. The reason, we have classified this as pi bonding is because of the nature of the phases. As can be observed from the MO, we can see a nodal plane which cuts right through the centre of the molecule. This is again evidence that C, D, E, and H are p orbitals which overlap in a pi fashion. There is also a strong through bonding interaction (in phase overlap) between C (3p, Al) and a/b (3p, Cl) respectively. Another through bonding in phase overlap is seen between e (3p, Al) and g/f (4p, Br) respectively. Apart from the obvious through bonding interactions, we should also take note of the less obvious through space interactions of this molecule. Maybe not so evident from the chemdraw sketch, but definitely evident from the real MO, is the very weakly bonding interaction between the terminal 3p orbitals of B and the 4p orbitals of F. We have labelled this very weak through space anti-bonding interaction with the number "4." A similar bonding interaction is observed between the different phases of the same AO's in question. The strength of this bonding interaction is similar as the one described above (4), and has been denoted with the number "1." So far we have only analysed the bonding interactions with the participate AO's. However upon closer inspection it can be seen that there are also anti-bonding through space interactions present. The first interaction we will discuss is the anti-bonding through space interaction between the terminal 3p chlorine orbitals (denoted a, and b, and with the number "2"). The strength of this anti-bonding interaction can be best described as "weak", it is stronger than the very weak through space interactions described earlier, due to the closer proximity of the participating orbitals. However the overall nature of this anti bonding interaction is still weak. A similar weak through space interaction exists between the 4p orbitals of Br (g and f, denoted with the number "3"). Due to the smaller contribution of the Br atomic orbitals to the overall MO, we can predict that as a result of this, the through space interaction labelled with the number 3 will be of a weaker nature than the one labelled with the number "2". P orbitals labelled as A, B, G, and F, have a nodal plane at their atomic centre. It should be noted that the nodes lie at the atomic centres and thus do not contribute much to the overall energy of the MO. Unlike the interatomic nodes described earlier as nodes at atomic centres, the nodes at C, D, E, and H can be described as internuclear, and are thus of greater significance in the sense to how much they contribute to the overall energy of the MO. Overall this orbital can be classified as "bonding" in nature, albeit it is not as strongly bonding as the previously described MO 37.
Which atomic orbitals dominate this MO?
MO 53
Upon analysing the "real MO" it is evident that this molecule is antibonding, this is based on the simple principle of size. Upon observing the real MO's it can be seen that the Br's (lower electronegativity/higher in energy) AO's contribution to the MO is larger than the AO's based on Cl. This suggests that the MO is anti-bonding in nature. The AO's based on bromine are clearly 4p orbitals (denoted F and E), this is clear due to the respective atomic nodes observed. The bridging Cl's contributions are also p orbitals (3p, denoted C and D), and lies orthogonal to the previously described 4p orbitals based on Br. Diagram E also illustrates contributions from the terminal chlorines (denoted A and b), although these are likely to be minimum. Therefore this interaction will not be discussed any further.
Interactions and their nature
In this MO there are no through bond interactions that need to be discussed. All discussions will thus be focused on atomic nodes, and through space interactions. The first through space anti-bonding interaction we will discuss is the 4p-4p interaction (F and E). This through space interaction is intermediate in strength (relatively to any other through space interactions discussed in previous MO's). The nature of this interaction is anti-bonding, because the overlap is between lobes that are out of phase. The second through-space interaction we should consider is the one between the bridging 3p chlorine fragments (denoted C and D). This interaction is weak in nature (relatively large distance, very little overlap). This interaction is just like the previous one, anti-bonding in nature, because the interacting lobes are again out of phase. The last through space interaction we will discuss is the one between C and F, and the one between D and E. The interaction is anti-bonding due to overlaps between lobes of different phases. The interaction is particularly weak because the orbitals exhibit a large difference in size, therefore there is only limited overlap. Additionally they are orientated at 90 degrees with respect to one another. Apart from through space interactions, there are C, D, E, and F also have atomic nodes, which make a small contribution to the overall anti-bonding nature of this MO.
Which atomic orbitals dominate this MO?
MO 45
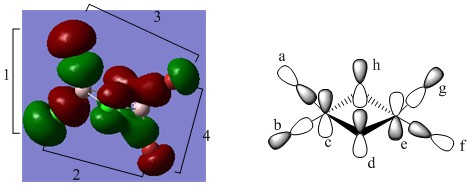
Upon analysing the "real MO" it is evident that all atoms contribute to the overall bonding nature of the molecule. It should be noted that MO 45 is higher in energy (and therefore more anti-bonding than MO 40). We will now analyse why this is the case. In terms the individual AO's which make up this MO, diagram E provides a good approximation.
Interactions and their nature
The terminal bromine 4p orbitals overlap with the 3p orbital on Al labelled "E". This interaction is "bonding" because the lobes have the same phase. Al's 3p orbital "E" in turn overlaps in a pi fashion with the bridging chlorine 3p orbitals (denoted D, and H), this overlap is bonding because the lobes in both cases have the same phase. The chlorine 3p orbitals (denoted A and B) form an unfavourable anti-bonding interaction with one another through space (weak), this interaction is illustrated by the number 1. A similar weakly antibonding interaction is observed between the bromine 4p orbitals (g,f) this interaction is illustrated by the number 4. There are also two very weak anti-bonding through space interactions, one of these is between the 3p orbital on the terminal chlorine (denoted A) and the terminal 4p orbital on the terminal bromine (denoted G), this interaction is labelled with the number "3". An identical very weak through space interaction is present between B and F. This very weak through space interaction is labelled with the number "2."It should also be noted that AO fragments which make up this MO have atomic nodes. These raise the energy of the MO, but not by an amount that is significant. Overall the MO is classified as "bonding" because the more electronegative terminal 3p chlorines are shown to have a larger contribution than the corresponding terminal 4p bromines.
Which atomic orbitals dominate this MO?
MO 50
Which atomic orbitals dominate this MO?
MO 50's nature is very similar to that of MO 53. Both MO's are similar in their appearance, but a few differences can be noted. For one MO 53 by definition is higher in energy than MO 50. in terms of contribution to the overall MO, it can be noted that the terminal chlorines (denoted A and B) are large suggesting they have a larger coefficient than the other atomic orbitals. The bridging chlorines (denoted C and D)are similar in shape to the 3p orbitals of chlorine. The terminal bromines, are likely to only provide a small contribution to the overall MO, and will therefore be ignored.
Interactions and their nature
In terms of interactions in this MO, we must first place an emphasis that there is a lack of "through bond" overlap. We are therefore restricted to discussing the through space interactions present in this MO. A and B illustrate an antibonding through space interaction. This interaction is however weak due to the fact that orbitals are not in an orientation which is very favourable for overlap. Another through space interaction, which must be noted is the one between the bridging chlorines (B and C). This interaction is stronger, because not only is the alignment of the orbitals more favourable for overlap, the interacting species are also closer in proximity. Lastly, it should also be noted that A, B, C, and D all contain atomic nodes. Upon taking all discussed interactions into account, the overall nature of the MO is believed to be "bonding."
Conclusion
This project investigated the energies, vibrational modes, and MO's of the different Al2Cl4Br2 isomers. Making use of the 6-31G(d,p) basis set on Al and Cl and a PP LANL2DZdp on Br, relative energies were quantified and explained. Frequency analyses of all isomers were carried out, and used to rationalise the effects of changing the bridging halide for a different halide. Finally a population analysis was carried out on isomer 6 to quantify the Molecular orbitals of this conformer. 5 of this isomer's MO's were analysed. The different bonding, and antibonding interactions were reported and used to determine the overall bonding nature of the MO in question. Apart from these calculations, the project was further expanded, as can be seen below.
Optional: Comment on or analyse or describe some aspect of these systems which you found interesting.
Out of interest I decided to investigate the effect of applying the pseudopotentials on Br. All the isomers were optimised under a 6-31G (d,p) basis set for Al and Cl, while the PP LANL2DZdp basis set was applied to Br. Now instead of applying these conditions to each of the isomers, I decided to simply apply a single basis set (in this case 6-31G (d,p)) on all atoms within isomer 6, and isomer 1. I wanted to see if this change would have an effect on the obtained vibrational spectrum, and whether this would change the bond lengths/angles of the final optimised molecule.
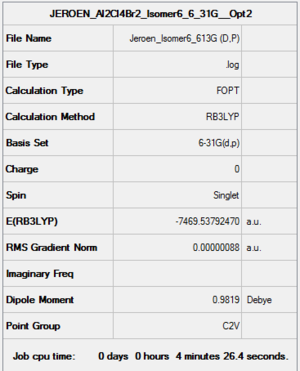
Isomer 6 Optimisation (B3LYP/6-31G(d,p))
Optimisation DOI:10042/161015
| summary data | convergence | Jmol | |||
|---|---|---|---|---|---|
|
Value Threshold Converged? Maximum Force 0.000002 0.000015 YES RMS Force 0.000001 0.000010 YES Maximum Displacement 0.000025 0.000060 YES RMS Displacement 0.000009 0.000040 YES |
|
Isomer 1 Optimisation (B3LYP/6-31G(d,p))
Optimisation DOI:10042/161023
| summary data | convergence | Jmol | |||
|---|---|---|---|---|---|

|
Item Value Threshold Converged? Maximum Force 0.000001 0.000015 YES RMS Force 0.000000 0.000010 YES Maximum Displacement 0.000005 0.000060 YES RMS Displacement 0.000002 0.000040 YES |
|
Isomer 6 B3LYP/6-31G(d,p) Frequency calculation
Frequency DOI:10042/161024
| Summary Data | Low modes |
|---|---|
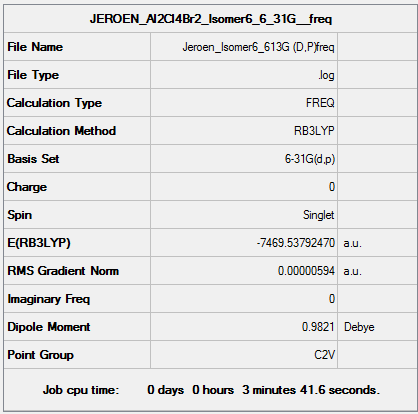 |
Low frequencies --- -0.3471 -0.0079 -0.0047 0.0076 1.1630 1.2450
Low frequencies --- 13.3951 54.4031 73.7263 |
Isomer 6 Frequency (without pseudopotentials)
| wavenumber | Intensity | IR active? | type |
| 13 | 0 | no | bend |
| 54 | 0 | no | bend |
| 74 | 0 | no | bend |
| 98 | 0 | no | bend |
| 117 | 0 | no | bend |
| 120 | 6 | very slight | bend |
| 124 | 11 | very slight | bend |
| 163 | 1 | no | bend |
| 167 | 7 | very slight | bend |
| 190 | 1 | no | bend |
| 264 | 0 | no | bend |
| 275 | 17 | very slight | stretch |
| 324 | 34 | yes | stretch |
| 413 | 138 | yes | stretch |
| 416 | 277 | yes | stretch |
| 504 | 115 | yes | stretch |
| 533 | 124 | yes | stretch |
| 610 | 183 | yes | stretch |
Isomer 6 (with pseudopotentials)
| wavenumber | Intensity | IR active? | type |
| 19 | 0 | no | bend |
| 51 | 0 | no | bend |
| 72 | 1 | no | bend |
| 98 | 0 | no | bend |
| 112 | 0 | no | bend |
| 112 | 8 | very slight | bend |
| 120 | 11 | very slight | bend |
| 160 | 1 | no | bend |
| 166 | 7 | very slight | bend |
| 187 | 2 | no | bend |
| 263 | 0 | no | bend |
| 271 | 14 | very slight | stretch |
| 323 | 41 | yes | stretch |
| 413 | 150 | yes | stretch |
| 418 | 309 | yes | stretch |
| 495 | 134 | yes | stretch |
| 503 | 105 | yes | stretch |
| 616 | 177 | yes | stretch |
Isomer 1 B3LYP/6-31G(d,p) Frequency calculation
Frequency DOI:10042/161025
| Summary Data | Low modes |
|---|---|
 |
Low frequencies --- -2.2694 -2.2626 -0.8971 0.0032 0.0091 0.0105
Low frequencies --- 11.7221 65.3801 88.4275 |
Isomer 1 frequency (without pseudopotentials)
| wavenumber | Intensity | IR active? | type |
| 12 | 1 | no | bend |
| 65 | 0 | no | bend |
| 88 | 0 | no | bend |
| 89 | 0 | no | bend |
| 110 | 7 | no | bend |
| 115 | 0 | no | bend |
| 126 | 11 | very slight | bend |
| 135 | 1 | no | bend |
| 137 | 4 | no | bend |
| 164 | 0 | no | bend |
| 222 | 0 | no | bend |
| 255 | 75 | yes | stretch |
| 262 | 0 | no | stretch |
| 366 | 144 | yes | stretch |
| 471 | 349 | yes | stretch |
| 503 | 0 | no | stretch |
| 597 | 0 | no | stretch |
| 603 | 294 | yes | stretch |
Isomer 1 frequency (with pseudopotentials)
| wavenumber | Intensity | IR active? | type |
| 16 | 0 | no | bend |
| 64 | 0 | no | bend |
| 86 | 0 | no | bend |
| 87 | 0 | no | bend |
| 108 | 5 | very slight | bend |
| 111 | 0 | no | bend |
| 126 | 8 | very slight | bend |
| 135 | 0 | no | bend |
| 138 | 7 | very slight | bend |
| 163 | 0 | no | bend |
| 197 | 0 | no | stretch |
| 241 | 100 | yes | stretch |
| 247 | 0 | no | stretch |
| 341 | 160 | yes | stretch |
| 468 | 346 | yes | stretch |
| 494 | 0 | no | stretch |
| 609 | 0 | no | stretch |
| 617 | 332 | yes | stretch |
The frequency analysis of isomer 6 and isomer 1 using pseudo potentials or not showed minor deviations. The deviations weren't of great significance, and so one could argue whether using pseudopotentials is actually necessary. That being said, pseudopotentials were used as an approximation in the first place, and their main use was reducing the calculation time. From this frequency analysis we can see that this approximation was allowed. To make an even more accurate comparison we could have also run an optimisation with the 2 original basis sets, but no pseudopotentials. To investigate whether using a 6-31G(d,p) basis set for all atoms on these isomers, we can directly compare the energies, and see if the difference between the isomer 1/6 energies is similar to the difference in energy when we used pseudopotentials.
Energies of the Isomers when using pseudopotentials
| Isomer 1 | Isomer 6 | |
|---|---|---|
| Etot | -2352.4063255 a.u. | -2352.4163437 a.u. |
Since isomer 6 was previously assumed to be the "lowest energy" isomer, we have once again assigned it with an energy of 0 kJ/mol. The reported energy of isomer 1, is relative to that of isomer 6.
Isomer 1: 26.30 kJ/mol
Isomer 6: 0.00 kJ/mol
Energies of the Isomers when not using pseudopotentials (6-31G(d,p) basis set)
| Isomer 1 | Isomer 6 | |
|---|---|---|
| Etot | -7469.5426912 a.u. | -7469.5379247 a.u. |
Isomer 1: 12.51 kJ/mol
Isomer 6: 0.00 kJ/mol
As can be seen, the relative energies are far from similar, and thus simply using the 6-31G(d,p) basis set is not justified.
Investigation of InClMe2
By using the basis set exchange website5, the appropriate basis sets were selected for each of the atomic orbitals. A full electron calculation (basis set 6-31G(d,p)) was used for for the carbons, and hydrogens, while pseudopotentials ( basis set LanL2DZ) were used for In, and Cl respectively. Notice that for the optimisation, the point group was not constrained, (this is because of the nature of the C-H bonds). Due to the readily rotation of the methyl groups, Gaussian is not able to constrain the molecule to the right point group (C2V). Upon optimisation, the In-C bond lengths were reported to be 2.13 Ao, the In-Cl bond length was reported to be 2.42 Ao. It should be noted that we are using a "medium accurate" basis set (to limit the length of the calculation time), as a result, all we can conclude is that the bond lengths are roughly of the right order. From this point on, we assume the monomer to be optimised correctly, and we will make an attempt to make a dimer similarly to the [R2InCl]n staircase polymer described in 2nd year main group chemistry.The same basis sets/pseudo-potentials were applied to the dimer, the edited GJF file was then consequently submitted to the computing portal.
InMe2Cl
B3LYP/6-31G(d,p)/ PP LANL2DZdp
Optimisation DOI:10042/160944
| summary data | convergence | Jmol | |||
|---|---|---|---|---|---|
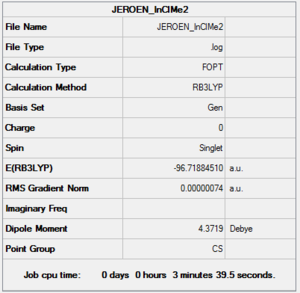
|
Item Value Threshold Converged? Maximum Force 0.000002 0.000015 YES RMS Force 0.000001 0.000010 YES Maximum Displacement 0.000017 0.000060 YES RMS Displacement 0.000006 0.000040 YES |
|
An attempt was made to generate an optimised dimer, however as can be seen from the jmol figure below, this was unsuccessful. Due to the complex nature of this staircase-like dimer, more complex computations would need to be carried out to obtain an accurate optimisation. Unfortunately due to time constraints, these calculations were not carried out.
molecule |
References
1) S. J. Blanksby and G. B. Ellison, Acc. Chem. Res., 2003, 36, 255-263.
2) M. W. Feyereisen, D. Feller and D. A. Dixon, J. Phys. Chem., 1996, 100, 2993-2997.
3) (Freq, http://www.gaussian.com/g_tech/g_ur/k_freq.htm, (accessed 12/12/14))
4) (Vibrational Analysis in Gaussian, http://www.gaussian.com/g_whitepap/vib.htm, (accessed 12/12/14))
5) (Basis Set Exchange, https://bse.pnl.gov/bse/portal, (accessed 16/12/14))

