User:Jl8913
Thermal Expansion of Magnesium Oxide Crystals Modelled using Computational Methods
Thermal expansion plays a major role in how large structures are designed such as bridges, rail tracks and concrete. Where if no measure was in place to allow for the expansion of the materials in use, cracks and imperfections can arise disrupting or nullifying the purpose of the construction. Such as cracks in road bridges or simple objects such as cup which form cracks due to uneven thermal expansion upon addition of hot water.
To be able to implement measures to prevent thermal expansion causing damages efficiently, firstly the system in question needs to be studied under the effects of temperature. One method to achieve this is to model the material used computationally and run simulations at various temperatures to ascertain certain thermal expansion properties and effects of high temperature exposure to the material.
Magnesium oxide is used as a component of cement which is later used for the bases of concrete, which can experience cracks in the surface if expose to high temperatures with no control joints to allow for expansion and contraction. As without these control joints, there will be no room for expansion and so cracks form due to the force of thermal expansion causing weaker sections to form cracks.
Introduction
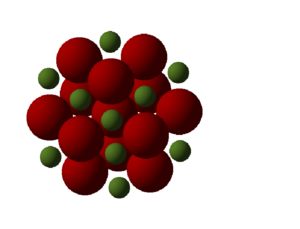
This experiment investigates the thermal expansion of magnesium oxide (MgO) crystals using computational means. By using a quasi-harmonic approximation and molecular dynamic model to simulate effects of temperature of on the crystal structure. The goal is to compare results obtained from using the previously mentioned two computational models with literature values and to understand more on how MgO undergoes thermal expansion.
Thermal Expansion
Thermal expansion occurs due to the increasing temperature causing a increase in potential energy, resulting in the average intermolecular separation to rise in an anharmonic system. This is the midpoint between the edges of the curve, that has a measurable displacement form the other atom. This means that if there was a compound that was described by a harmonic system it will not have any thermal expansion, as the average intermolecular distance would remain constant. Due to the separation having equal ratios of being compressed and expanded (Fig. 2.). However since solids typically have high bond energies, they are typically difficult to cause change in dimensions.
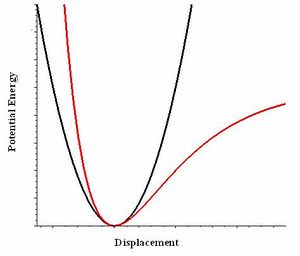
This results in the crystal motif's dimension to increase due to the increased distance between atoms in the crystal. When this is multiplied to all the motifs present in a crystal structure, expansion occurs causing the crystal to become larger in size. However a diatomic molecule with the properties of a perfectly exact harmonic potential, will have a constant average intermolecular distance between the two atoms, due to the quadratic function the potential is model on. Therefore upon increasing the temperature there would be more fluctuations between the distance between the atoms, however on average there would be no change in the intermolecular distance and thereby a constant bond lengths. However in actuality, molecules have an anharmonic factor associated with them. This gives rise to various properties such as thermal expansion. An anharmonic term gives rise to the change of intermolecular distance with changes in temperature represent the change seen in thermal expansion.
Method
Quasi-harmonic Approximation
Quasi-harmonic approximation uses the harmonic phonon model as a basis but also contains an additional anharmoic factor, which is that the frequency is dependent on the volume of the molecule in question. This changes the potential energy against intermolecular distance from being a perfect quadratic function to one that resembles the Morse Potential (Fig. 2.). This allows the model accommodate the phenomenon of thermal expansion. This is due to the quasi-harmonic expanding on the original harmonic phonon model, by including an anharmonic term which is where phonon frequencies are volume dependent.[1]. As this anharmonic term gives rise to the change of intermolecular distance with changes in temperature represent the change seen in thermal expansion.
The model uses phonons which are what quantum mechanics describes the elementary vibrations in a lattice and have particle like properties. This particular approximation says that the phonon oscillates throughout the crystal structure on one dimension, where its amplitude of the vibrational mode is proportional to the energy the molecule has. This is computed by calculating the energy over all the vibrational modes in a crystal.[1]
The accuracy of the energy is dependent on the gird size. The gird size is affects the division of the reciprocal space, which is dictated by the inverse size of the lattice constant of the crystal. Thereby increasing the gird size increases the density of sampling points in the reciprocal space, which effectively increases the number of cells in the direct space creating a pseudo larger sample size for an average. As an increase gird size increases the percentage of points sample in a set area dictated by the crystal lattice size, however increasing the gird size increases computational time so calculations must be balance between accuracy and time taken.
Molecular Dynamics
Molecular dynamics uses classical Newton's force law. The model allows the system in question to change with time by accordance of Newton's Second law.
- Newton's Second Law: F - Force; m - mass; a - acceleration
Using the second law the model then computes trajectories for the atoms and time averages are obtained. This is achieve by firstly setting up an initial conditions such as temperature, the program then assigns atoms random velocities that can be scaled to achieve a similar starting temperature. Then the program computes the force and acceleration experienced by the atoms, uses this data to update the new velocity and position. This cycle repeats till the time average properties such as the energy and temperature settle which allows measurements to be made.
Factors such as increasing cell size which allows more atoms to be sampled therefore a more accurate average but longer computational time and a balance of the time between measurements so that the calculation can be computed efficiently but short enough to sample a good proportion the atoms. Both factors involve a balance between accuracy and time of computation.
Programs
This experiment uses RedHat Linux, General Utility Lattice Program (GULP) and DLVisulaize (DLV) to model, run simulations and have a graphical interface to interact and examine results.
GULP enables simulations to be run using lattice dynamics and molecular dynamics on various systems. Giving us the tool to manipulate various conditions and extract data such as lattice constants free energy.
DLV is a visulaiser, allowing the modelling of structures due to certain changes in properties assisting in understanding how materials change under different environments which in this particular case is the changes in temperature.
RedHat Linux is an operation system used for this experiment, used due to Linux provides an excellent platform to run numerical calculations and simulations which is essential for this computation experiment.
Results and Discussion
Initial Crystal Model
Running initial calculations on the MgO crystal structure at 0K to check the computational model used. The findings where that the rhombohedron primitive cell has a lattice constant of 2.9783Å which is equivalent to a cubic size of 4.212Å, which has a good correlation with literature results of 4.211Å [2]. However this is expect due to the calculations being associated at 0K that can be assumed there to be no anharmonic factors which causes inaccuracy during this computation due to difficulties in modelling anharmonic properties.
Phonon Curves
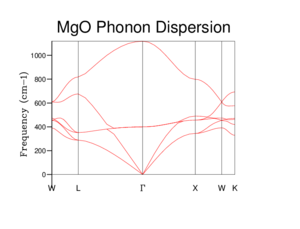
The phonon graph below the phonon modes change with different k values, a value that represents different wavelengths. What is seen is that there are firstly six different phonon modes, this is due to two phonon modes for each axis used in the simulation. This particular experiment ran the calculations using x, y, z axis so therefore there are six different modes. Reason for two phonon modes per axis is due to there being an optical and acoustical branch. Both describe phonons as lattice vibrations however optical describes a pair of phonon moving in opposite directions and vice versa for acoustical branch. This leads to two branches forming in a dispersion curve due to the different modes of vibration.
Other information that can be gathered from the graph, is the how certain vibrational modes are present and the frequency of the vibrations or what frequency creates the greatest vibration within the crystal, a pseudo harmonic resonance.
Phonon Density of States
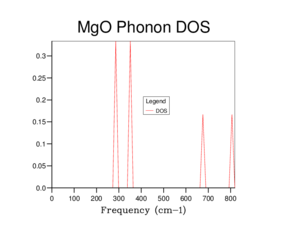
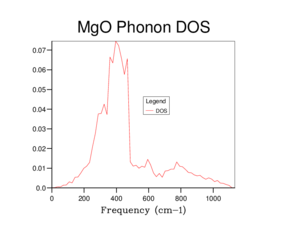
Shown in Figure 4 is a phonon density of state (DOS) graph. This uses the data form the phonon curve graph and takes a count at a certain k value of how many times a vibrational mode is seen. Then each intercept is weighted depending on the number of vibrational modes that make up the dispersion curve at the intercept associated with it and plotted against frequency to form the Phonon density of states graph. This particular phonon DOS graph uses the previous figure, Figure 3 at point K = 0.5000 0.5000 0.5000 weight = 1.000 which is represent on the phonon curve graph as L. This is known due to there being four peaks seen in an approximate 2:2:1:1 ratio which reflects the point L in Figure 3 having four phonon modes with two comprising of two phonon modes.
Figure 5 shows a more detail DOS due to the increase in gird size used to run the calculations on the crystal. As increasing the gird size forms more peaks due to the increase percentage in sample points of the reciprocal space. Calculations were ran with increasing gird size till a continuous curve is formed, the gird size is 16x16x16 was found to produce said result. Any gird smaller than this size has sections where the curve cuts the x-axis which indicates there were no vibrational modes present at certain frequencies, however it is clearly seen that this does not occur. The increase in the gird size also increases the smoothness of the curve due to the additional calculations and data sampling points possible. As the gird size is related to the percentage area sampled of the reciprocal space of a crystal. Compared to Figure 4. where the gird size is 1x1x1, Figure 5. it is smoother less sharper and is a continuum between the recorded frequencies of Figure 3.
Free energy using Quasi-harmonic Approximation
| Gird Size | Helmholtz free-energy /eV | Accuracy |
| 1x1x1 | -40.93030 | to 0.1eV |
| 2x2x2 | -40.92660 | to 0.1eV |
| 3x3x3 | -40.92643 | to 1meV |
| 4x4x4 | -40.92645 | to 0.5meV |
| 8x8x8 | -40.92647 | to 0.5meV |
| 16x16x16 | -40.92648 | to 0.1meV |
| 32x32x32 | -40.92648 | n/a |
The results from the calculation using the largest gird size recorded the Helmholtz free energy at 300K to be -40.9265eV using a primitive MgO cell. However literature values record the free energy at 300K to be 6.2341eV[3]. This is a large difference in the free energy due to the over simplicity of the model. As it over simplifies the anharmonic factor leading to the large difference in energy especially at higher temperatures where the anharmonic property of the molecule become significant.
What is seen in Table 1 the relationship with free energy and the gird size used calculations where a larger gird size gives a greater degree of accuracy. The same ideology applies form the phonon DOS graph that a large gird size increases accuracy but also increases time required to run the calculations. Table 1 also shows which gird size can be used for various degrees of accuracy, where increasing gird size increases the degree of accuracy of the calculated.
If calculations were to be run on other compounds the optimal gird size would be altered to match the size of the new compound in question. For example if the experiment was to be run on calcium oxide, a simialy sized sized crystal. The 16x16x16 grid sized used for MgO will be appropriate for CaO due to the similar crystal lattice constant of CaO, 4.211Å[2] of MgO versus 4.800Å[4] CaO. This means that the reciprocal space for the same gird size, contains a similar volume of sampling for the two crystals, thereby requiring a similar gird size regardless of the property that was being studied whatever it be the free energy of the phonon DOS.
However a Zeolites such as Faujasite have far larger lattice constants (24-25Å)[5] than MgO, which results in a much smaller reciprocal space. So for the same gird size, a zeolite will have points of sampling that cover a greater percentage area of the crystals compare to MgO which will be sampled with less resolution. Thereby the gird for a zeolite would be smaller than MgO to compensate for the difference in lattice constants to obtain a similar degree of sampling.
If we were to test on a metal for example lithium instead of a crystal structure then not only will the gird size change but so will the k point measurements. Firstly the gird size would have to be larger due to lithium having a smaller lattice constant at 3.44Å[6] compare to MgO. Due to this, lithium will have a larger reciprocal space requiring a larger gird size to obtain the same density of measurements as made with MgO. However since lithium crystals do not contain charged ions like Mg2+ and O2- in MgO crystals and instead have electrons dispersed throughout the structure, this balances out the interactions between positive charges, this result in the dispersion curve for lithium metal to have fewer variations in frequency across values of k. Due to the electrons adapting to the changes in charge density with the vibration of the lithium metal, so no matter how far or close two lithium atoms are, the electrons serves to maintain a similar Coulombic force experienced between the two atoms. This leads to less measurements required across k values. As the dispersion curve is very similar to one at another point unlike with MgO. The ions in MgO leads to fluctuations of dispersion curve causing crossovers requiring more k point sampling to achieve a more complete picture.
Thermal Expansion of MgO
- Volumetric Coefficient of Thermal Expansion: αV - thermal coefficient; V - volume; ∂V - partial derivative of volume; ∂T - partial derivative of temperature; subscript p denominates constant pressure
The volumetric coefficient of thermal expansion equation describes how a material expands due to the temperature of the molecule at a constant pressure. The constant pressure is important for systems involving gas due to the variation of gas volume with pressure, this however is not factor for this experiment involving solid MgO.
A larger volumetric coefficient of thermal expansion relates to a compound undergoes a large thermal expansion during heating. Since MgO is a solid, it is expected that a low volumetric coefficient of thermal expansion is calculated from the simulations due to the strong intermolecular bonds present in the crystal.
Quasi-harmonic Approximation
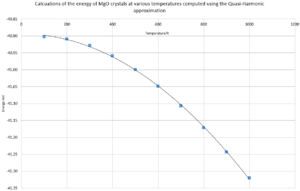
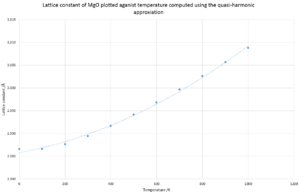
Both graphs have smooth quadratic curves where the free energy curve being a positive quadratic and lattice constant negative. Figure 6. is a negative curve due to the quasi-harmonic approximation calculates energy in the form of Helmholtz free energy. If U and S are constant then the free energy is directly proportional to the temperature in a negative fashion.
- Helmholtz free energy: A - Helmholtz free energy; U - internal energy; T - temperature; S - entropy.
Figure 7. has a positive curve due to the thermal expansion causing enlargement of the crystal structure, thereby increasing lattice constant.
If the thermal coefficient for MgO is calculated using the Quasi-harmonic approximation for the full range of 0-1000K a value of 2.568x10⁻⁵ K-1. However it is seen on the graph of volume against temperature, there is a change in gradient around 300K, so by limiting the calculation range from 0-300K gives a value 9.47x10⁻⁶ K-1, which is very similar to the literature value of 10.4x10⁻⁶ K-1[7]. The large difference between the results calculated from the two different ranges could be due to the limitations with the program in regards to the anharmonic factor implementation. Due to the quasi-harmonic being a simple model, as it can also be seen on the graph that there is a curve which is best described as a quadratic. However the equation for thermal coefficient of expansion shows a linear relationship. This difference could be due to the limitations of the model as the gradient change occurs at higher temperatures.
The program uses approximations for the calculations by using the phonon harmonic model with an addition of anharmonic factor of the frequency being volume dependent. This is a simpler way of computing anharmonic factors and as such, calculations at higher temperature will have a larger anharmonic factor therefore a variation form literature values. Since the model is mainly based around a model that treats intermolecular forces as harmonic,[1] this means the bases of the model is on a harmonic quadratic equation similar to the curves seem in Figure6&7. There are other approximations that limit the precision of the quasi-harmonic model. Such as the Born-Oppenheimer, where the nuclei are assumed as point charges and electrons instantaneously react to changes to the environment relative to the nuclei where the nuclei does not move in respects to the electrons. These approximations limit the validity of the model at high temperatures.
At even higher temperatures such around the melting point of MgO, the quasi-harmonic approximation expects that the amplitude of molecules will increase with temperature as it reaches melting point. However this leads to adjacent molecules to collide as the model permits one dimensional movement.[1] This could result in a breakdown of the quasi-harmonic approximation at high temperatures and near melting point. As the model prevents free form movement similar to the movement present in liquids, resulting in a method not adequate to model MgO near melting point.
Molecular Dynamics
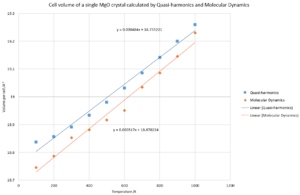
While both calculations using quasi-harmonics and molecular dynamics show a general increase in volume with increasing temperature, which is in line with thermal expansion. Also molecular dynamics obtains 2.249x10⁻⁵ K-1 which is similar to quasi-harmonic approximations. However due to the nature of the calculations used for molecular dynamic model, their results are more erratic compare to quasi-harmonics. While in very similar results were obtained for both models, quasi-harmonics consistently produced results that were larger in volume seen in Figure 8. This could be due the method of calculation for quasi-harmonic which is based around phonons while molecular dynamics is based around classical Newton’s second law of momentum on individual molecules. Due to the modelling differences, molecular dynamics results while being more sporadic have a seemly closer fit to a linear fit. This is different to quasi-harmonic which has more of a quadratic appearance, due to its bases on a harmonic model. At higher temperatures it is expected that the molecular dynamics to have results be more sporadic and more similar to an anharmonic function, so long as the cell is large enough to calculate a accurate results.
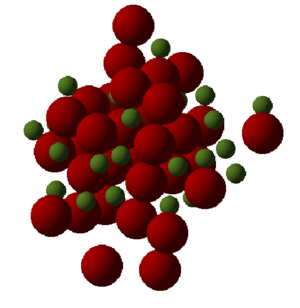
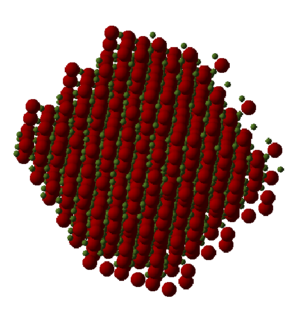
The results are sporadic due to the nature of the model which computes averages for the molecules present in the cell. Therefore a larger cell will produce a more accurate result due to the large sample size. The model also allows the molecules to undergo three dimensional movement, causing disruption of the primitive cell. The visualiser represents this by “lost” atoms in the crystal seen in Figure 9. This is due to the deformation of the cell due to thermal expansion causing a change in the geometry of the cell, this can be seen more closely when visualising multiple units on the cell. The central structure of the crystal still has a regular arrangement represented in Figure 10. While at the edges there is less of a regular arrangement and more of a jagged edge. This is how the model simulates the expansion causing a change in the lattice structure due to random movement and thermal expansion.
Conclusion
Both model show correctly how MgO expands due to temperature however they do not describe the system accurately at high temperatures.
The quasi-harmonic approximation does not describe the thermal expansion of MgO efficiently at higher temperatures due to the approximations used in the model to allow for easier calculations. This can be improve by using another model which uses fewer approximations.
The molecular dynamics while not using approximations, it requires a larger cell than the 32 unit cell used in the experiment to enable calculations at higher temperatures. As there were derivations form literature values however within the same magnitude. The reason for requiring a larger cell is due to the nature of the model that calculates averages of the properties of the molecules.
While the generally results were obtain had similarities with literature results, the simulations began to fail at higher temperature. This would require a different setup of the systems or model to be able to model MgO at higher temperatures to obtain more accurate free energy of data related to thermal expansion.
References
- ↑ 1.0 1.1 1.2 1.3 M. Dove, Introduction to lattice dynamics, Cambridge University Press, Cambridge, 2005.
- ↑ 2.0 2.1 U. Rössler and R. Blachnik, II-VI and I-VII compounds; semimagnetic compounds, Springer, Berlin, 1999, ch171.DOI:10.1007/10681719_206
- ↑ Y. Rao, Stoichiometry and thermodynamics of metallurgical processes, Cambridge Univ. Press, Cambridge, 1985, ch9, p345.
- ↑ U. Rössler and R. Blachnik, II-VI and I-VII compounds; semimagnetic compounds, Springer, Berlin, 1999. DOI:10.1007/10681719_206
- ↑ J. Weitkamp and L. Puppe, Catalysis and Zeolites, Springer Berlin Heidelberg, Berlin, Heidelberg, 1999, p311
- ↑ K. Doll, N. Harrison and V. Saunders, Journal of Physics: Condensed Matter, 1999, ch11, p5007-5019.
- ↑ C. Ho and R. Taylor, Thermal expansion of solids, ASM International, Materials Park, OH, 1998, ch11, p280.
Calculations
Quasi-harmonic approximation thermal coefficient from 0-300K
Quasi-harmonic approximation thermal coefficient from 0-1000K
Molecular dynamics thermal coefficient from 0-1000K
