User:Hc1312
Week 1: Data of the optimised molecules
BH3:B3LYP/3-21G level
Optimisation log file here
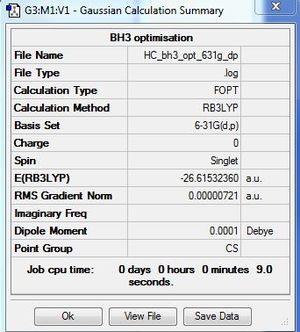
BH3:B3LYP/6-31G(d,p) level
Optimisation log file here
| summary data | convergence | Jmol | |||
|---|---|---|---|---|---|
|
Item Value Threshold Converged? Maximum Force 0.000012 0.000450 YES RMS Force 0.000008 0.000300 YES Maximum Displacement 0.000064 0.001800 YES RMS Displacement 0.000039 0.001200 YES |
|
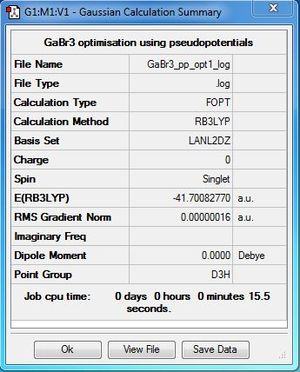
GaBr3:LANL2DZ level
Optimisation file DOI:10042/31121
| summary data | convergence | Jmol | |||
|---|---|---|---|---|---|
|
Item Value Threshold Converged? Maximum Force 0.000000 0.000450 YES RMS Force 0.000000 0.000300 YES Maximum Displacement 0.000003 0.001800 YES RMS Displacement 0.000002 0.001200 YES |
|
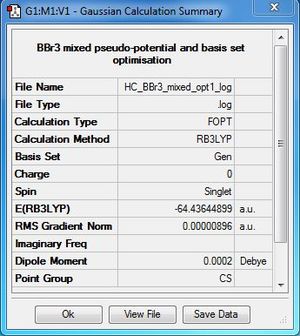
BBr3:B3LYP/6-31G(d,p)LANL2DZ level
Optimisation file DOI:10042/31122
| summary data | convergence | Jmol | |||
|---|---|---|---|---|---|
|
Item Value Threshold Converged? Maximum Force 0.000013 0.000450 YES RMS Force 0.000008 0.000300 YES Maximum Displacement 0.000061 0.001800 YES RMS Displacement 0.000036 0.001200 YES |
|
Geometry Comparison
| BH3 | BBr3 | GaBr3 | |
| r(E-X)Å | 1.19 | 1.93 | 2.35 |
| θ(X-E-X)degrees(°) | 120.0 | 120.0 | 120.0 |
When the ligands in BL3 changed from hydrogen to bromine, the bond length between boron and the ligands increases. However, the L-B-L angle has not changed. This is because the three identical ligands on the same plane has minimum repulsion by keeping an angle of 120 degree from each other.
The most significant differences between H and Br is their sizes. The size difference is caused by the extra s, p and d orbitals in Br (1s2,2s2,2p6,3s2,3p6,4s2,3d10,4p5 ), whereas the H(1s1) only has 1s orbital. Therefore the bond length increase to reduce steric hindrance and electronic repulsion between the ligands.
The electronegativities of H, B and Br are 2.20, 2.04 and 2.96 in Pauling unit, respectively. More electronegative atom has orbital lower in energy. Therefore by comparing the electronegativities, it is clear that the B and Br orbitals energy mismatch is larger than B and H, as their difference in electronegative (0.76) is larger than the difference between H and B (0.16). [1] The large energy mismatch result in poor orbital overlap, which leads to weak B-Br bond and longer bond length. Despite the differences, both H and Br require one more electron to complete a valence shell.
By changing the central atom in BBr3 to a heavier atom Ga, the bond length between the central atom and the ligand increases, but again change in the L-E-L angle is not observed due to the same reason mentioned above. Ga and B are in group 5, both require 3 more electrons to have a complete valence shell. The differences are again in size, which result in an increase in bond length to minimize steric hindrance and repulsion.
Atoms and molecules are held together by chemical bonds which arise from the electrostatic attractions between positive and negative charges. [2] Stronger the electrostatic attraction between the species leads to higher bond energy and shorter the bond length. Ionic bond, covalent bond and metallic bonds can be considered as strong bonds, but their energies can varies from 163 kJ/mol (N-N single bond) to 786 kJ/mol (NaCl), therefore depends on their energies, bonds around 200 kJ/mol can be considered as medium bond.[3] Weak bonding is often refers to dipole dipole interaction such as hydrogen bond. Hydrogen bond is generally about 10-30 kJ/mol but there are also exception such as hydrogen bonding in HF which is around 160 kJ/mol.[3]
In the animation which shows the optimization profile, the bond between the atoms are not drawn in few stages, but this doesn't means there is no bond. It is simply because the bond length has a per-defined value in Gaussian program which are based on organic molecules. Since inorganic molecules usually have longer bond length, the bond lengths which exceed the per-defined value is not shown.
Week 1: Frequency Anaylsis
BH3:B3LYP/6-31G(d,p) level
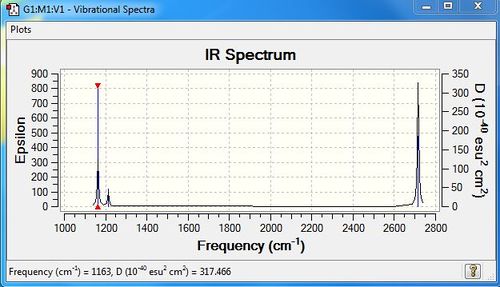
Frequency file: here
| summary data | low modes |
|---|---|

|
Low frequencies ---   -0.9385   -0.8438   -0.0054    5.8634   11.7841   11.8214
Low frequencies --- 1162.9968 1213.1829 1213.1856
|
| Wavenumber | Intensity | IR active | type |
| 1163 | 93 | yes | bend out of plane(wagging) |
| 1213 | 14 | very slight | bend in plane(Scissoring) |
| 1213 | 14 | very slight | bend |
| 2582 | 0 | no | stretch |
| 2715 | 126 | yes | stretch |
| 2715 | 126 | yes | stretch |
Analysis
Although there are six vibrational modes, only 3 peaks are observed in the IR Spectrum. This is due to the overlap of the degenerated vibrations. For example, there are two vibrations with frequencies of 1213 and two with frequencies of 2715. Moreover the peak with frequency of 2582 has zero intensity, which means IR inactive and is not shown in the spectrum.
GaBr3:LANL2DZ
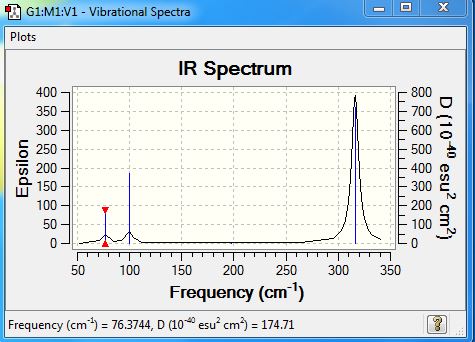
Frequency file DOI:10042/31180
| summary data | low modes |

|
Low frequencies --- -0.5252 -0.5247 -0.0024 -0.0010 0.0235 1.2010 Low frequencies --- 76.3744 76.3753 99.6982 |
| Wavenumber | Intensity | IR active | type |
| 76 | 3 | very slightly | bend |
| 76 | 3 | very slightly | bend |
| 100 | 9 | very slightly | bend |
| 197 | 0 | no | stretch |
| 316 | 57 | yes | stretch |
| 316 | 57 | yes | stretch |
Compare and contrast
What does the large difference in the value of the frequencies for BH3 compared to GaBr3 indicate? There been a reordering of modes! This can be seen particularly in relation to the A2" umbrella motion. Compare the relative frequency and intensity of the umbrella motion for the two molecules. Looking at the displacement vectors how has the nature of the vibration changed? Why?
All the vibrational frequencies of BH3 are higher than the frequencies of GaBr3, which indicates BH3 has stronger bond than GaBr3. Since frequency is directly proportional to the force constant K, higher frequencies suggest large force constant value. K is the second derivative of potential energy surface, larger K value means more energy is required for same displacement compared to those harmonic oscillator (bond) with smaller K value. Moreover, according to equation
ν = (1/2π)*(K/ų)½
smaller the reduce mass will also result in high frequency.
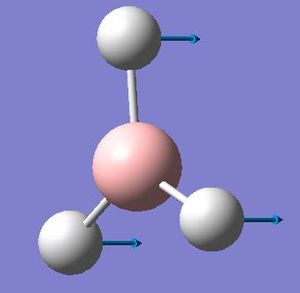
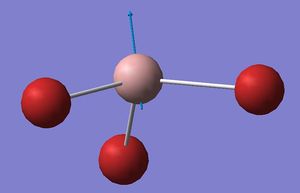
For the umbrella motion, BH3 has higher frequency and intensity than GaBr3 which showed in the table below. This is because BH3 has higher force constant (0.9986) and much lower reduce mass (1.2531). Moreover, in BH3, the umbrella motion has the lowest frequency whereas in GaBr3 this mode is reorder and being the second lowest. By looking at the displacement vectors, it is obvious that the umbrella vibration mode in BH3 corresponds to the ligand; where the vibration in GaBr3 corresponds to the central atom. This is because less energy is required vibrate the lighter atom . This result in change of vibration nature as the ligand which is H is the lightest element in BH3, whereas the central atom B is the lightest element in BBr3
BH3
| Umbrella motion | Summary Data |
|---|---|
|
                      1                      2                      3
                     A2"                    E'                     E'
 Frequencies --   1162.9968              1213.1829              1213.1856
 Red. masses --      1.2531                 1.1072                 1.1072
 Frc consts  --      0.9986                 0.9601                 0.9601
 IR Inten    --     92.5482                14.0551                14.0588
|
GaBr3
| Umbrella motion | Summary Data |
|---|---|
|
                        1                      2                      3
                     E'                     E'                     A2"
 Frequencies --     76.3744                76.3753                99.6982
 Red. masses --     77.4211                77.4212                70.9513
 Frc consts  --      0.2661                 0.2661                 0.4155
 IR Inten    --      3.3447                 3.3447                 9.2161
|
Answer to Question
Frequency analysis can be used to check the validity of the optimisation. This is because the optimisation stops when it found a turning point on the potential energy surface (PES) without confirming its nature. Since the first derivative of maxima is also equal to zero, the second derivative must be computed in order to check the turning point is indeed the energy minimum. Frequency is proportional to the second derivative of the PES which is force constant, it essentially indicates the nature of the turning point found by structural optimisation. Moreover it also provides a vibrational frequencies and Ramen mode analysis.
The same method must be used for the optimisation and frequency analysis. This is because if different methods and basis sets are used, different potential energy surfaces are build, and the frequency calculated from a different PES cannot be used to check the optimisation.
Low frequencies represent the motions of the centre of mass of the molecules.
Week 1: Population Analysis
BH3:B3LYP/6-31G(d,p)
Population file DOI:10042/31195
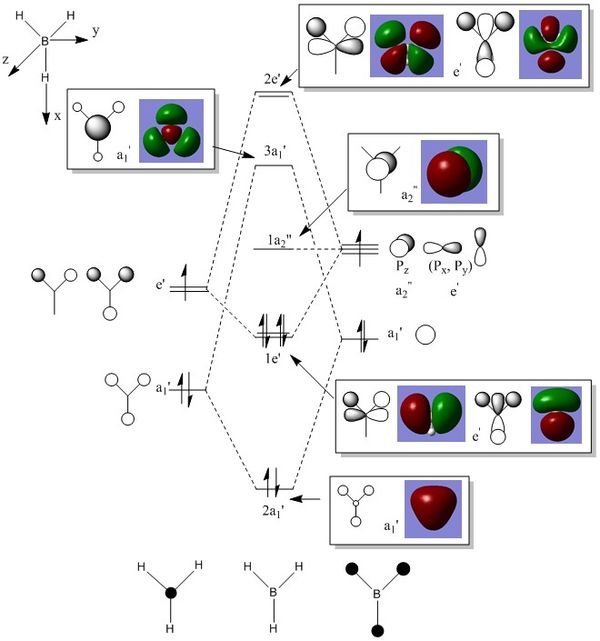
MO Diagram of BH 3
The LCAO MOs is more localised whereas the real MOs are more delocalised. The shape of MOs is generally predicted correctly by the MO theory.
Week 1: NH3:B3LYP/6-31G
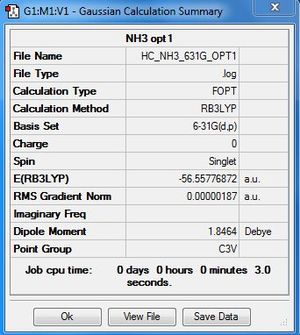
Optimisation file here
| summary data | convergence | Jmol | |||
|---|---|---|---|---|---|
|
Item Value Threshold Converged? Maximum Force 0.000003 0.000015 YES RMS Force 0.000002 0.000010 YES Maximum Displacement 0.000026 0.000060 YES RMS Displacement 0.000017 0.000040 YES |
|
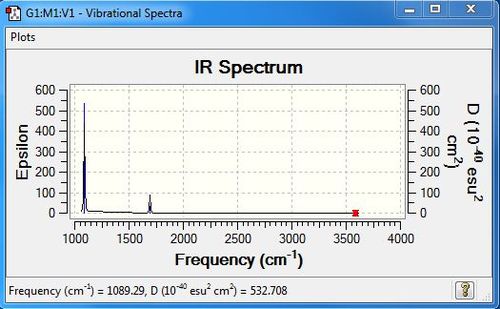
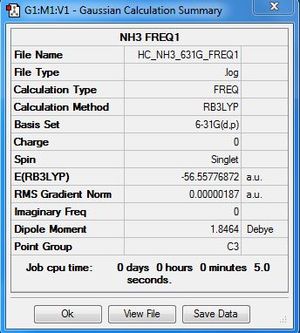
Frequency file: here
| summary data | low modes |
|---|---|
|
Low frequencies ---   -0.0410   -0.0144    0.0017    1.6412    1.6437    2.4682
Low frequencies --- 1089.2851 1693.9239 1693.9239
|
| Wavenumber | Intensity | IR active | type |
|---|---|---|---|
| 1089 | 145 | yes | bend |
| 1694 | 14 | yes | bend |
| 1694 | 14 | yes | bend |
| 3461 | 1 | no | symmetric stretch |
| 3590 | 0 | no | asymmetric stretch |
| 3590 | 0 | no | asymmetric stretch |
NBO analysis for NH3
Charge Distribution of NH3
Population file DOI:10042/31211
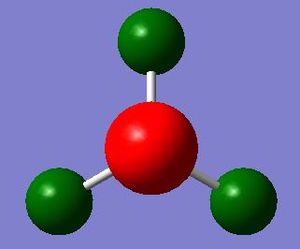
The atoms are colored with respect to their charges. The charge range is from -1.0 to 1.0. Red indicates negative charge and green indicates positive charge.
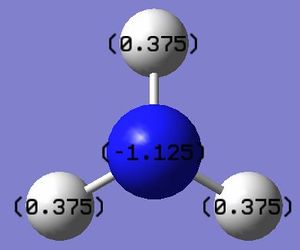
The charge numbers are indicated; Hydrogen atoms in NH3 have positive charges of 0.375, and the nitrogen atom have negative charges of -1.125.
Week 1: NH3BR3:B3LYP/6-31G
Optimisation file here
| summary data | convergence | Jmol | |||
|---|---|---|---|---|---|
|
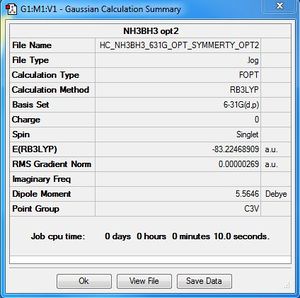
Item Value Threshold Converged? Maximum Force 0.000006 0.000015 YES RMS Force 0.000002 0.000010 YES Maximum Displacement 0.000054 0.000060 YES RMS Displacement 0.000016 0.000040 YES |
|
Frequency file: here
| summary data | low modes |
|---|---|

|
Low frequencies --- -6.2136 -0.1858 -0.0267 0.0008 2.0266 2.0573 Low frequencies --- 263.2686 632.9065 638.4482 |
| Wavenumber | Intensity | IR active | type |
|---|---|---|---|
| 263 | 0 | no | bend |
| 633 | 14 | yes | bend |
| 638 | 4 | very slight | bend |
| 638 | 4 | very slight | bend |
| 1069 | 40 | yes | bend |
| 1069 | 40 | yes | bend |
| 1196 | 109 | yes | bend |
| 1204 | 3 | very slight | bend |
| 1204 | 3 | very slight | bend |
| 1329 | 114 | yes | bend |
| 1676 | 28 | yes | bend |
| 1676 | 28 | yes | bend |
| 2472 | 67 | yes | stretch |
| 2532 | 231 | yes | asymmetric stretch |
| 2532 | 231 | yes | asymmetric stretch |
| 3464 | 2 | very slight | symmetric stretch |
| 3581 | 28 | yes | asymmetric stretch |
| 3581 | 28 | yes | asymmetric stretch |
Association energies NH3BH3
| Molecule | Energy (AU) |
| E(NH3) | = -56.55776872 |
| E(BH3) | = -26.61532360 |
| E(NH3BH3) | = -83.22468909 |
ΔE=E(NH3BH3)-[E(NH3)+E(BH3)]
ΔE= -83.22468909 - (-56.55776872 - 26.61532360)
ΔE= -0.05159677 a.u
ΔE= -135 kJ/mol
The bond formed between NH3 and BH3 is a medium bond. We can compare the dissociation energy, -135 kJ/mol with the dissociation energy of H3C-CH3 which is 368 kJ/mol.[1] Since C-C bond is much stronger than N-B bond, therefore the dissociation energy for NH3BH3 is sensible.
Week 2 Project: Lewis acids and bases
Al2Cl4Br2:B3LYP/6-31G(d,p)LANL2DZ, Isomer 1, D2h symmetry
Optimisation log file here
| summary data | convergence | Jmol | |||
|---|---|---|---|---|---|
|
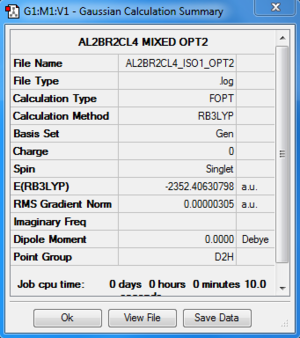
Item Value Threshold Converged? Maximum Force 0.000008 0.000450 YES RMS Force 0.000003 0.000300 YES Maximum Displacement 0.000064 0.001800 YES RMS Displacement 0.000031 0.001200 YES |
|
Al2Cl4Br2:B3LYP/6-31G(d,p)LANL2DZ, Isomer 2, C1 symmetry
Optimisation log file here
| summary data | convergence | Jmol | |||
|---|---|---|---|---|---|
|
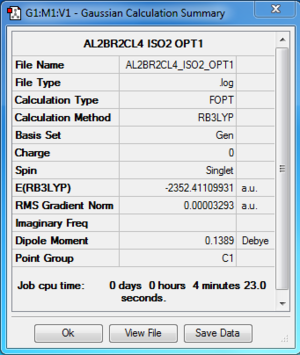
Item Value Threshold Converged? Maximum Force 0.000102 0.000450 YES RMS Force 0.000026 0.000300 YES Maximum Displacement 0.001361 0.001800 YES RMS Displacement 0.000597 0.001200 YES |
|
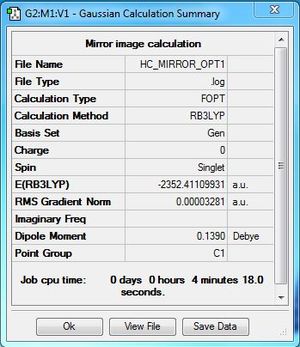
Al2Cl4Br2:B3LYP/6-31G(d,p)LANL2DZ, Enantiomer of Isomer 2, C1 symmetry
Optimisation log file here
| summary data | convergence | Jmol | |||
|---|---|---|---|---|---|
|
Item Value Threshold Converged? Maximum Force 0.000101 0.000450 YES RMS Force 0.000026 0.000300 YES Maximum Displacement 0.001374 0.001800 YES RMS Displacement 0.000596 0.001200 YES |
|
Comment
This is isomer is the mirror image of isomer 2, therefore they are enantiomer. They have the same energy which make them hard to distinguish, therefore in the rest of the sections, only isomer 2 is discussed.
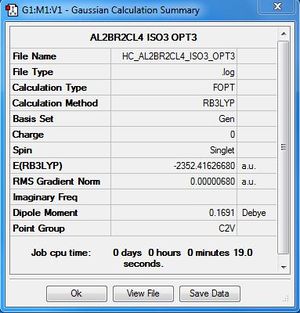
Al2Cl4Br2:B3LYP/6-31G(d,p)LANL2DZ, Isomer 3, C2v symmetry
Optimisation log file here
| summary data | convergence | Jmol | |||
|---|---|---|---|---|---|
|
Item Value Threshold Converged? Maximum Force 0.000010 0.000450 YES RMS Force 0.000006 0.000300 YES Maximum Displacement 0.001017 0.001800 YES RMS Displacement 0.000403 0.001200 YES |
|
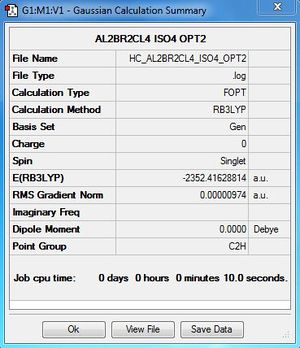
Al2Cl4Br2:B3LYP/6-31G(d,p)LANL2DZ, Isomer 4, C2h symmetry
Optimisation log file here
| summary data | convergence | Jmol | |||
|---|---|---|---|---|---|
|
Item Value Threshold Converged? Maximum Force 0.000027 0.000450 YES RMS Force 0.000011 0.000300 YES Maximum Displacement 0.000203 0.001800 YES RMS Displacement 0.000094 0.001200 YES |
|
Other possible isomer
Isomer 5 |
This is another possible isomer with both Br in the terminal position. Since in this project we only discuss the possible isomers that can be formed from AlCl2Br monomers, this isomer requires a bond breaking and rotation, therefore is not going to discuss in this project.
Analysis
| Conformer | Point group | Energy (a.u) | Relative energy(kJ/mol) |
| 1 | D2h | -2352.40630798 | 26.2029 |
| 2 | C1 | -2352.41109931 | 13.6233 |
| 3 | C2v | -2352.41626680 | 0.0560 |
| 4 | C2h | -2352.41628814 | Reference energy |
The relative energy is calculated with respect to the lowest energy conformer which is conformer 4.
Bromine is a period 4 element which has higher atomic mass and more diffused orbital than the period 3 elements such as Aluminium and Chlorine. In Al2Cl4Br2, there are two atoms bridging the two Al atoms forming 3-center-2-electron (3c2e) bonds. 3c2e bond is longer and weaker than usual bond, therefore energy difference between the interacting atoms (bridging atoms and neighbouring atoms) will make a significant effect on the total energy of the molecules. It is the reason why Br is less favourable in bridging Al atoms than Cl due to the larger energy mismatch, which result in high energy isomer such as Isomer 1 and 2. In other words, placing bromine in bridging position will result in high energy isomer. Consequently, isomer 1 which has two bridging Br is in higher energy state than isomer 2 which has only one bridging Br.
The energy calculation error in Gaussian is around 10 kJ/mol, therefore the small energy difference between isomers 3 and 4 presented in Table 6 is not valid. In order compare the energy between these two isomers, high accuracy calculation is required.
Dissociation energy
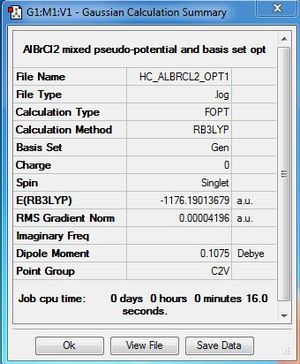
Dissociated fragment:AlBrCl2:B3LYP/6-31G(d,p)LANL2DZ level
Optimisation file here
| summary data | convergence | Jmol | |||
|---|---|---|---|---|---|
|
Item Value Threshold Converged? Maximum Force 0.000136 0.000450 YES RMS Force 0.000073 0.000300 YES Maximum Displacement 0.000681 0.001800 YES RMS Displacement 0.000497 0.001200 YES |
|
Frequency file: here
| summary data | low modes |
|---|---|
|
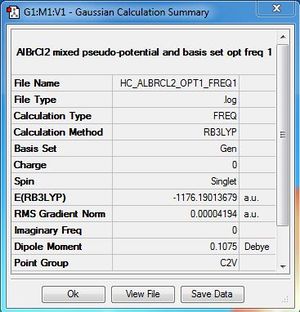
Low frequencies --- -0.0044 -0.0036 -0.0021 1.3569 3.6367 4.2604 Low frequencies --- 120.5042 133.9178 185.8950 |
Calculation
ΔE=E(Al2Cl4Br2)-[E(AlBrCl2)+E(AlBrCl2)]
ΔE= -2352.41628814 - (-1176.19013679 - 1176.19013679)
ΔE= -0.03601456 a.u
ΔE=-94.6 kJ/mol
The product is more stable than the isolated monomers. The result is expected because similar to BH3, AlBrCl2 is also electron deficient therefore favours dimerisation.
Frequency Anaylsis
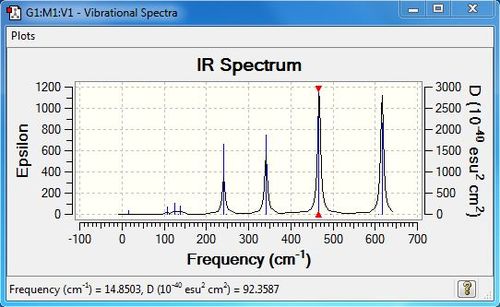
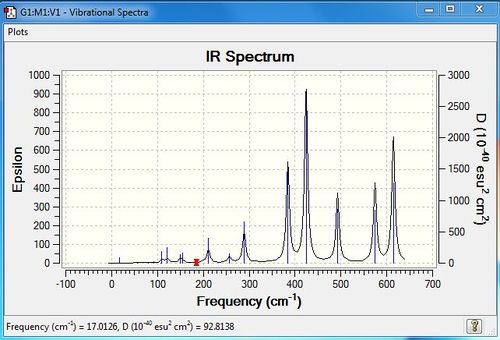
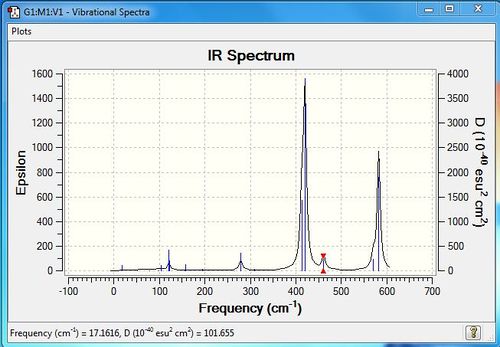
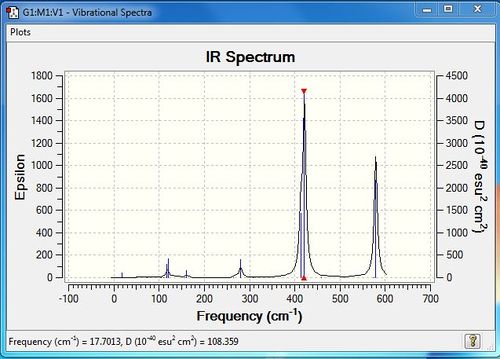
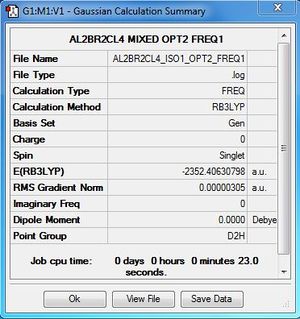
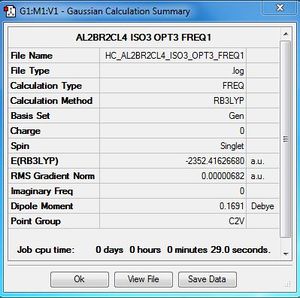
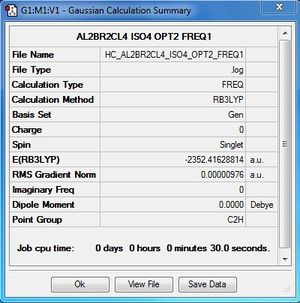
Each isomer has 18 frequencies, but some frequencies has zero intensity. Therefore the frequencies with intensity higher than 5 are presented in this section.
Al2Cl4Br2:B3LYP/6-31G(d,p)LANL2DZ, Isomer 1, D2h symmetry
Frequency file: here
| summary data | low modes |
|---|---|
|
Low frequencies --- -5.1329 -4.9644 -3.1640 -0.0011 -0.0008 0.0024 Low frequencies --- 14.8503 63.2856 86.0867 |
| Mode number | Wavenumber | Intensity | IR active | type |
|---|---|---|---|---|
| 5 | 108 | 5 | very slight | bend |
| 7 | 126 | 8 | very slight | bend |
| 9 | 138 | 7 | very slight | bend |
| 12 | 241 | 100 | yes | stretch |
| 14 | 341 | 161 | yes | stretch |
| 15 | 467 | 347 | yes | stretch |
| 18 | 616 | 332 | yes | stretch |
Al2Cl4Br2:B3LYP/6-31G(d,p)LANL2DZ, Isomer 2, C1 symmetry
Frequency file: here
| summary data | low modes |
|---|---|

|
Low frequencies --- -2.9938 -1.4775 -0.0021 -0.0012 -0.0007 3.0817 Low frequencies --- 17.0163 55.9577 80.0481 |
| Mode number | Wavenumber | Intensity | IR active | type |
|---|---|---|---|---|
| 6 | 110 | 5 | very slight | bend |
| 7 | 121 | 8 | very slight | bend |
| 8 | 149 | 5 | very slight | bend |
| 9 | 154 | 6 | very slight | bend |
| 11 | 211 | 21 | very slight | stretch |
| 12 | 257 | 10 | very slight | stretch |
| 13 | 289 | 48 | yes | stretch |
| 14 | 384 | 154 | yes | stretch |
| 15 | 424 | 274 | yes | stretch |
| 16 | 493 | 107 | yes | stretch |
| 17 | 574 | 122 | yes | bend |
| 18 | 615 | 197 | yes | bend |
Al2Cl4Br2:B3LYP/6-31G(d,p)LANL2DZ, Isomer 3, C2V symmetry
Frequency file: here
| summary data | low modes |
|---|---|
|
Low frequencies --- -4.2591 -2.3977 -0.0043 -0.0032 -0.0026 1.2815 Low frequencies --- 17.1616 50.9090 78.5490 |
| Mode number | Wavenumber | Intensity | IR active | type |
|---|---|---|---|---|
| 6 | 120 | 13 | very slight | bend |
| 7 | 123 | 6 | very slight | bend |
| 9 | 158 | 5 | very slight | bend |
| 12 | 279 | 25 | very slight | stretch |
| 14 | 413 | 149 | yes | stretch |
| 15 | 420 | 411 | yes | stretch |
| 16 | 289461 | 35 | yes | stretch |
| 17 | 570 | 32 | yes | stretch |
| 18 | 582 | 277 | yes | stretch |
Al2Cl4Br2:B3LYP/6-31G(d,p)LANL2DZ, Isomer 4, C2h symmetry
Frequency file: here
| summary data | low modes |
|---|---|
|
Low frequencies --- -4.2854 -2.5168 0.0040 0.0041 0.0048 0.5919 Low frequencies --- 17.7013 48.9852 72.9510 |
| Mode number | Wavenumber | Intensity | IR active | type |
|---|---|---|---|---|
| 6 | 117 | 9 | very slight | bend |
| 7 | 120 | 13 | very slight | bend |
| 9 | 160 | 6 | very slight | bend |
| 12 | 280 | 25 | yes | stretch |
| 14 | 413 | 149 | yes | stretch |
| 15 | 421 | 439 | yes | stretch |
| 18 | 579 | 316 | yes | stretch |
Frequency analysis
For a vibrational mode to be IR active, there must be a change in dipole moment. For symmetrical isomer, such as 1, 3 and 4, many vibrational frequencies have zero intensity result in less peak in the IR spectrum. This is because in those vibration, the individual change in dipole moment cancelled each other out and there is no net change in dipole moment. Isomer 2 has no symmetry, therefore it has the largest number of peaks in the IR spectra as individual change in dipole moment is less likely to cancel each other out.
Discussion: Al-Br stretching vibrations
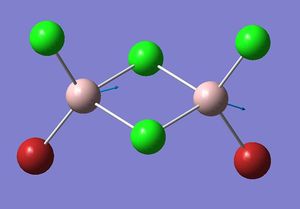
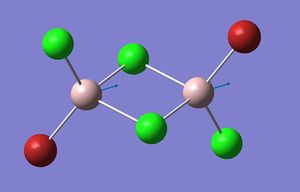
Mode A
| Coordinates | Isomer 1: Mode 15 |
|
|
| Isomer 2: Mode 15 | Isomer 2: Mode 16 |
|
|
| Isomer 3: Mode 15 | Isomer 4: Mode 15 |
|
|
| Isomer | Mode | Frequency | Intensity | Reduce masses | Force constant | Al-Br stretch? |
|---|---|---|---|---|---|---|
| 1 | 15 | 467 | 347 | 30.5923 | 3.9342 | 4 Al-Br stretch |
| 2 | 15 | 424 | 274 | 30.3745 | 3.2191 | 2 Al-Br stretch |
| 2 | 16 | 493 | 106 | 29.9258 | 4.2828 | 1 Al-Br stretch |
| 3 | 15 | 420 | 411 | 30.2077 | 3.1393 | 2 Al-Br stretch |
| 4 | 15 | 421 | 439 | 30.1831 | 3.1577 | 2 Al-Br stretch |
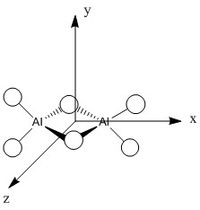
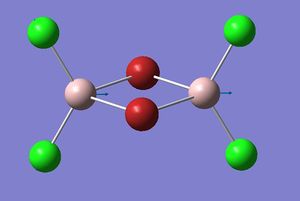
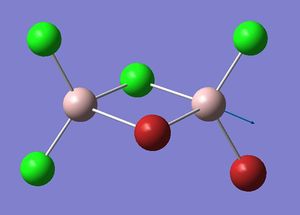
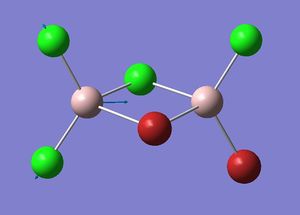
The figures presented above Table 11 are grouped together and are refered as the vibrational mode A. They all showed at least one displacement vector pointing in x direction in the giving coordinates. Their detail character are summarised in Table 11.
Firstly, the most obvious difference between isomer 2 and the others is that it has two vibrational frequencies (15 and 16) correspond to mode A. This is because isomer 2 has no symmetry; each Al displacement gives a unique vibrational frequency. Whereas in isomers 1, 3 and 4, the displacement movements of the two Al atoms are identical due to D2h, C2v and C2h symmetries, respectively.
For diatomic oscillation, we know that
ν = (1/2π)*(k/μ)½
For polyatomic vibration, as force constant increase, frequency increases; as reduce mass decreases, frequency increases. Therefore, mode 16 of isomer 2 has the highest vibrational frequency due its low reduce mass (29.9258) and large force constant (4.2828) which all showed in Table 11. Mode 15 of isomer 4 has the highest vibration intensity as the result of large change in dipole moment. It is worth noting that Al-Br stretching are found in all these modes, but placing Br in bridging position will result in more Al-Br bond stretching.
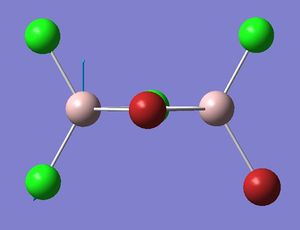
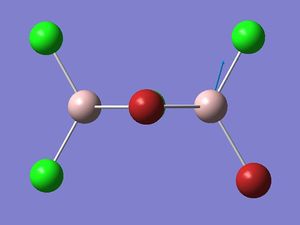
Mode B
| Coordinates | Isomer 1: Mode 18 |

|

|
| Isomer 2: Mode 18 | Isomer 2: Mode 17 |
|
|
| Isomer 3: Mode 18 | Isomer 4: Mode 18 |
|

|
| Isomer | Mode | Frequency | Intensity | Reduce mass | Force constant | Al-Br stretch? |
|---|---|---|---|---|---|---|
| 1 | 18 | 616 | 323 | 29.0949 | 6.5118 | No |
| 2 | 18 | 614 | 197 | 29.1092 | 6.4771 | No |
| 2 | 17 | 574 | 122 | 29.4077 | 5.7173 | 1 Al-Br stretch |
| 3 | 18 | 582 | 278 | 29.3166 | 5.8571 | 2 Al-Br stretch |
| 4 | 18 | 579 | 316 | 29.3559 | 5.7987 | 2 Al-Br stretch |
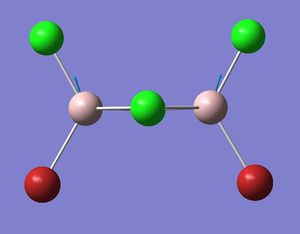
The figures presented above Table 12 are grouped together and are refered as the vibrational mode B. They all showed at least one displacement vector pointing in y direction in the giving coordinates. Their detail character are summarised in Table 12.
Mode B separates into two vibrational frequencies in isomer 2. This is because unlike the other isomers, isomer 2 has no symmetry. Detailed reasoning has been discussed earlier.
In mode B, the bonds between the bridging atoms and the Al atoms bend in y direction, whereas the bond between the terminal atoms and the Al atoms exhibit asymmetric stretching. Therefore if all the Br atoms occupy the bridging position, such as isomer 1, no Al-Br stretch can be observed. In isomer 2, mode 17 indicates Al-Br stretching between the Al and the terminal Br.
Mode 18 in isomer 1 has the highest frequency; this is because it has the lowest reduce mass (29.0949) and the largest force constant (6.5118) among all the modes. It also has the largest intensity due to a large change in dipole moment during vibration.
MO analysis
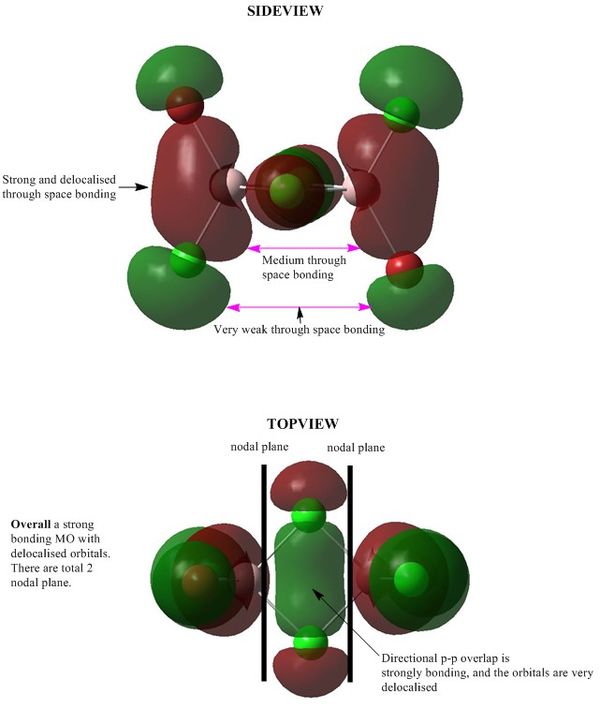
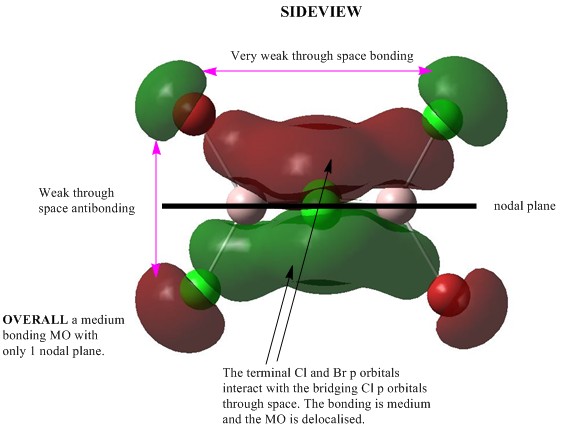
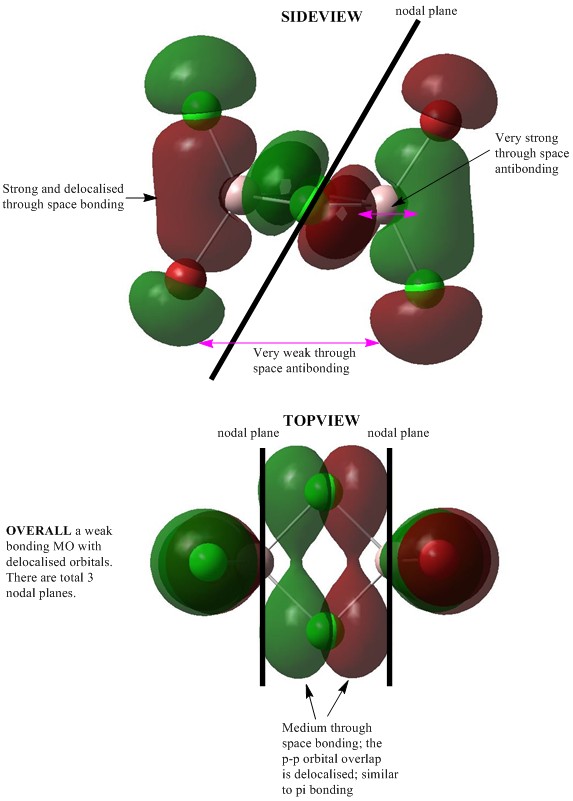
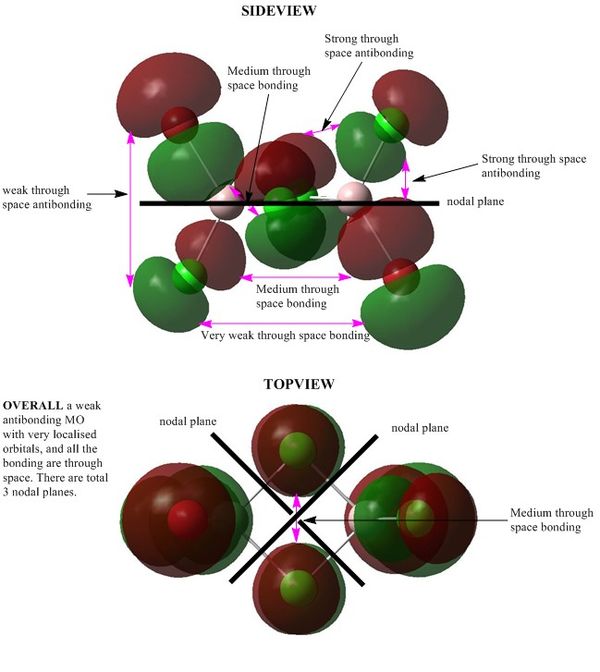
5 MOs analysis of the lowest energy conformer (isomer 4) are presented in this section. The selected MOs range from strong bonding to strong antibonding.
Population file here
MO 41:Strong bonding
MO 40:Medium bonding
MO 43:Weak bonding
MO 46:Weak antibonding
MO 53:Strong antibonding
References
- ↑ 1.0 1.1 P. Atkins and J. De Paula,Atkins's Physical Chemistry, Oxford University Press, United States, 9th edn.,2010
- ↑ IUPAC GOLD BOOK, 2.3.3
- ↑ 3.0 3.1 P. Atkins, T. Overton, J. Rourke, M. Weller and F. Armstrong,Shriver & Atkins's Inorganic Chemistry, Oxford University Press, United States, 5th edn.,2010


