User:Ak7317
Year 2 Physical Lab - Molecular Reaction Dynamics
Exercise 1ː H + H2 system
On a potential energy surface diagram, how is the transition state mathematically defined? How can the transition state be identified, and how can it be distinguished from a local minimum of the potential energy surface?
Transition state structure is defined as a maximum at the saddle point (on minimum energy path) ie the maximum between two energy minima which links reactants and products.To distinguish a transition state from a normal local minimum that point has to be both a minimum and a maximum in orthogonal direction on the energy surface matrix. Using the program that can be estimated if (in the Hessian matrix parameters) the 2nd derivative (ω2) has the maximally positive and negative values in both orthogonal directions (1 and 2), as well as the forces values acting along both AB and BC equal to 0.
Good, you have explained a saddle point well. What about the local minimum? Sw2711 (talk) 13:41, 10 May 2019 (BST)
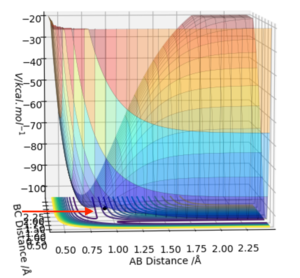
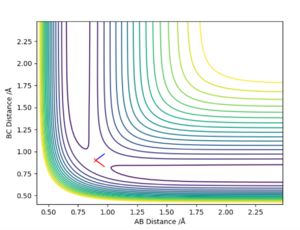
Report your best estimate of the transition state position (rts) and explain your reasoning illustrating it with a “Internuclear Distances vs Time” plot for a relevant trajectory.
So, in a particular reaction 3 identical atoms are basically interchanged (ie H2 + H -> H + H2). According to Hammond's postulate, as the structures of the reactants and product are the same, the transition state will resemble both of them at the same time ie the transition state will be symmetrical, and distances AB and BC will be equal (ie AB = BC); the force acting along AB and BC = 0; The two 2nd derivatives (ie the curvature) in orthogonal directions (along orthogonal vectors on the energy matrix) has to show the minimum and maximum values.
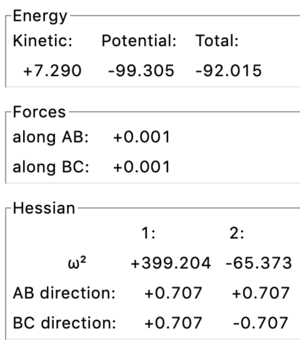
Firstly, to estimate the approximate position of the transition state, scientific judgement was used to pick a point near to the maximum of the saddle point ie r = 0.9 (Fig. 1). The initial geometry information box showed both positive and negative values for the 2nd derivative (ie point is close to the saddle point), and forces acting along AB & BC = ̟3.165
To be more precise, the MEP calculation type (an algorithm used to identify the transition point) was used. This calculation creates a line on a (contour) plot which follows the path from the position given to the energy minimum along the path of the steepest decreasing gradient. During MEP calculations no forces are acting upon the particles. Therefore effectively at the transition state the molecules will be stationary (as a saddle point has gradient equals to zero, and there are no forces acting either). As the graph was zoomed in, the minimum point was identified around r = 0.90774 (r = 0.908 to 3 sf), which gives the best estimated results for forces/max/min values (Fig. 3)
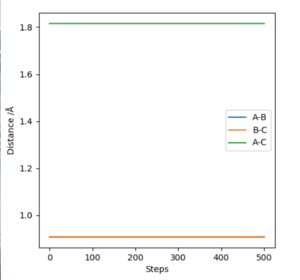
The internuclear distance vs time is showing almost completely linear relationship, representing the constant internuclear distance (as is at the transition state), but there is a slight gradual decrease in A-C distance (Fig. 4).
Good, very detailed explanation of your approach. Sw2711 (talk) 13:44, 10 May 2019 (BST)
Comment on how the mep and the trajectory you just calculated differ
r(TS) = 0.90774
r(AB) = r(TS) + 0.01 = 0.91774; r(BC) = 0.90774
Animation similarities: Same approach and collision; in both cases the reaction takes place
Animation difference: Upon A & BC separation, in MEP calculation - no BC bond stretching/contraction, which can be seen in the dynamic calculation. This can be seen in the contour plot as well, which shows a straight line trajectory in MEP calculation vs wave (alternating) path in dynamic approach.
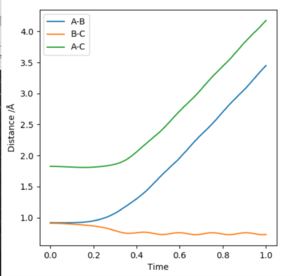
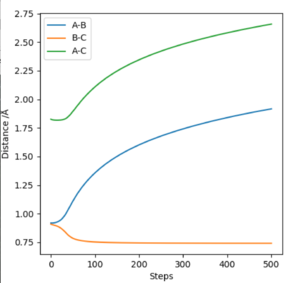
Internuclear distance vs time plot: Dynamic calculation graph (Fig. 5) contains two parallel straight lines with increasing gradient for A-B & A-C increase in internuclear separation, whereas B-C separation shows a sine-wave type (alternating around a constant value), reflecting the stretching-contracting bond behaviour. On the MEP calculation plot (Fig. 6), the A-B & A-C internuclear separations increase in a non-linear manner (two relatively parallel curved lines), with a straight line at a constant value reflecting a constant B-C separation (ie no bond stretching-contraction).
Good observation. But why is it? Sw2711 (talk) 13:47, 10 May 2019 (BST)
Complete the table above by adding the total energy, whether the trajectory is reactive or unreactive, and provide a plot of the trajectory and a small description for what happens along the trajectory. What can you conclude from the tableʔ
*S/C = stretching-contracting bond motion Do you mean oscillation? Sw2711 (talk) 13:51, 10 May 2019 (BST)
| P1 | P2 | Etot | Reactive? | Dynamics |
|---|---|---|---|---|
| -1.25 | -2.5 | -99.018 | Yes | Relatively fast approach, slow reaction (atom transfer), increase in speed as A & BC move apart; small amount of s/c after reaction in BC, no s/c in AB |
| -1.5 | -2.0 | -100.619 | No | Slow approach with decrease in speed, no collision, hence AD & C move apart; small s/c in AB |
| -1.5 | -2.5 | -99.119 | Yes | Quicker approach, atom transfer and separation. No s/c in AB, small amount of s/c in BC |
| -2.5 | -5.0 | -85.119 | Yes | Quick approach, followed by AB separation, then B collision B->C, B->A, BC association and separation from A; s/c in BC --> Bond is formed between BC, but then the system reverts back to the reactants; BARRIER RECROSSING |
| -2.5 | -5.2 | -83.579 | No | Quickest AB approach to C, AB-C collision, AB slow separation from C with largest AB s/c |
Conclusion: There is a specific range of momenta acting upon AB and BC (hence the total energy values) for which the reaction will proceed. Good observation. It would be better if you could talk about the TS point at bit more. Do systems pass their TS point in all cases? Sw2711 (talk) 13:51, 10 May 2019 (BST)
State what are the main assumptions of Transition State Theory. Given the results you have obtained, how will Transition State Theory predictions for reaction rate values compare with experimental valuesʔ
Transition state theory - theory used to calculate a more detailed rate constant, which is based on the consideration of events which are happening during the reaction; its formula includes a steric factor, which eliminates the need for its additional consideration. (1; atkins reference).
Assumptions: (2; Chemical bonding at surfaces and interfaces reference)
0. Quantum tunnelling is assumed to be negligible; The reactants have to collide with enough activation energy in order to react. It has been shown that for the reaction with very low activation energy - it can proceed even without a collision.
- Reactants are in equilibrium with the transition state structure.
- Reactant's energy follow the Boltzmann distribution. (This assumption is not always fulfilled)
- Once the transition state is attained, moving towards the products configuration, it will not reform the initial state anymore. (Leads to sever constraints on TS position)
The experimental reactions' rate value will be larger than the one predicted using the Transition State theory. In the reaction tested the activation energy barrier is low, thus the reaction can proceed even without the collision, hence under given momenta the reaction proceeds with a higher rate experimentally.
Good background research on TS theory. But I am not sure what you meant in the last paragraph. 'The experimental reactions' rate value will be larger than the one predicted using the Transition State theory.' Do you mean the last 5 trials? Is that your conclusion? If so, you probably have to take a closer look at the previous experiment. Does the previous experiment support or against the TS theory, and in what way? Are all the assumptions in the TS theory relevant to our case? For example, we only studied 3 atoms in total, where is the Boltzmann distribution? Sw2711 (talk) 13:57, 10 May 2019 (BST)
Exercise 2ː F - H - H system
By inspecting the potential energy surfaces, classify the F + H2 and H + HF reactions according to their energetics (endothermic or exothermic). How does this relate to the bond strength of the chemical species involvedʔ
F =A; H(1) = B, H(2) = C
F + H2 --> Exothermic; goes down in energy (ie releases energy) on a potential energy surface (PES)
FH + H --> Endothermic; goes up in energy (ie requires more energy for initial bond breaking) on a PES
From that information it can be concluded that F-H bond is stronger than H-H (as the formation of F-H bond releases more energy, resulting in exothermic reaction).
Good. Sw2711 (talk) 22:11, 10 May 2019 (BST)
Locate the approximate position of the transition state.
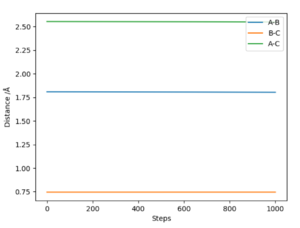
Location of the TS using MEP calculation and visualisation through internuclear distance-steps plots (based on A-B B-C A-C lines being straight, of 0 gradient ie of constant internuclear separation). (Fig. 7)
According to Hammond's postulate, during Exothermic reaction - the transition state structure resembles the reactants, and during Endothermic reaction - the TS resembles the products.
F + H2 --> FH + H Therefore we are trying to find the transition state for forward and backwards reactions of essentially the same products/reactants. Thus the transition state (ie its structure - bond lengths) will be the same, just the reactions will go either forwards or backwards.
F + H2: r(AB) = 1.808 ; r(BC) = 0.7450 (to 4 sf)
FH + H: r(AB) = 1.808 ;r(BC) = 0.7450 (to 4 sf)
Good. Sw2711 (talk) 22:11, 10 May 2019 (BST)
Report the activation energy for both reactions.
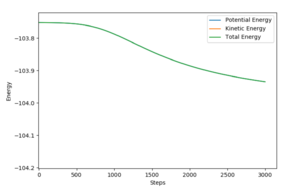
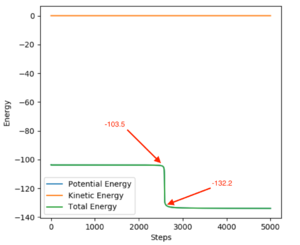
Using the MEP calculation and visualisation using Energy vs Time profile, the Activation energy was estimated through the investigation of near-TS structures. When the bond distance is changed just a little bit from the transition state, it will tilt the transition state structure either towards the product or the reactant, so the structure will 'fall' by itself either to one side or the other, folowing the path of the exothermic or the endothermic reactions. Hence, the energy change (ie energy released) during that travel will indicate the energy produced during bond making of the exothermic or endothermic products.
The energy change for the exothermic product corresponds to the Activation energy of the endothermic reaction (greater value), whereas the energy change for the formation of the endothermic product corresponds to the activation energy for the exothermic reaction (smaller value).
The profile showed a S-shaped total energy line, from which the difference of the top and bottom of the 'S' shape represents the energy released during the exo/endo product formation, hence the activation energies (AE) can be deduced.
It took ridiculously long time to complete. Sorry to hear that. Sw2711 (talk) 22:11, 10 May 2019 (BST)
F + H2 {AE}: -103.75 - (-103.9) = 0.15 (Fig. 8)
FH + H {AE}: -103.5 - (-132.2) = 28.7 (Fig. 9)
Good. Sw2711 (talk) 22:11, 10 May 2019 (BST)
In light of the fact that energy is conserved, discuss the mechanism of release of the reaction energy. Explain how this could be confirmed experimentally.
Where is your answer? Sw2711 (talk) 13:58, 10 May 2019 (BST)
Discuss how the distribution of energy between different modes (translation and vibration) affect the efficiency of the reaction, and how this is influenced by the position of the transition state.
Where is your answer? Sw2711 (talk) 13:58, 10 May 2019 (BST) You should have at least completed the lab. You were doing very well until the last two questions. Sigh ~. Sw2711 (talk) 22:11, 10 May 2019 (BST)
References
- P. Atkins, J. de Paula, J. Keeler, Physical chemistry, 7th edition, Oxford University Press, Chapter 18.
- T. Bligaard, J.K. Nørskov, in Chemical Bonding at Surfaces and Interfaces, 2008, Chapter 4, section 8.1 (Transition state theory)
