User:Ag3210
Introduction to computational Labs, Module 2, Part 1
The first part of this computational lab module involves using the Gaussian program to predict properties of simple structures such as; optimizing structures, measuring bond lengths / angles, predicting bond frequency's and predicting orbitals. From this it will then be possible to study and compare three molecules, BH3, TlBR3 and BBR3.
Optimization of BH3
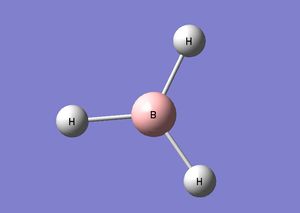
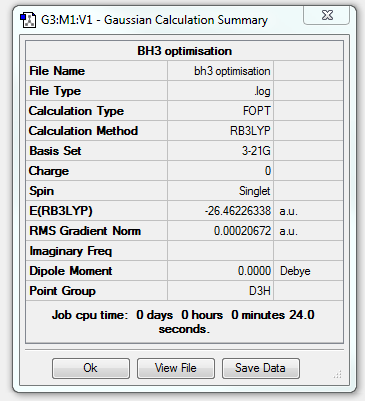
An optimized BH3 molecule was prepared by using the pre-made BH3 fragment, the bond lengths where then increased to 1.5Â as a starting point for the optimisation. After this the molecule was optimized using the B3LYP method and a basis set of 3-21G. The bond angle for the molecule was found to be 120.000 degrees and the bond length of all 3 B-H bonds was 1.19349 A. The optimization file can be found here: center
The program was confirmed to have worked by looking in the log file and finding that a stationary point had been found, a copy of this section can be seen below, a stationary point means that the software has found an energy minimum for the molecule.
        Item               Value     Threshold  Converged?
Maximum Force            0.000413     0.000450     YES
RMS     Force            0.000271     0.000300     YES
Maximum Displacement     0.001610     0.001800     YES
RMS     Displacement     0.001054     0.001200     YES
Predicted change in Energy=-1.071764D-06
Optimization completed.
   -- Stationary point found.
The summary of results for this initial optimization was displayed by Gaussian in this summary table:
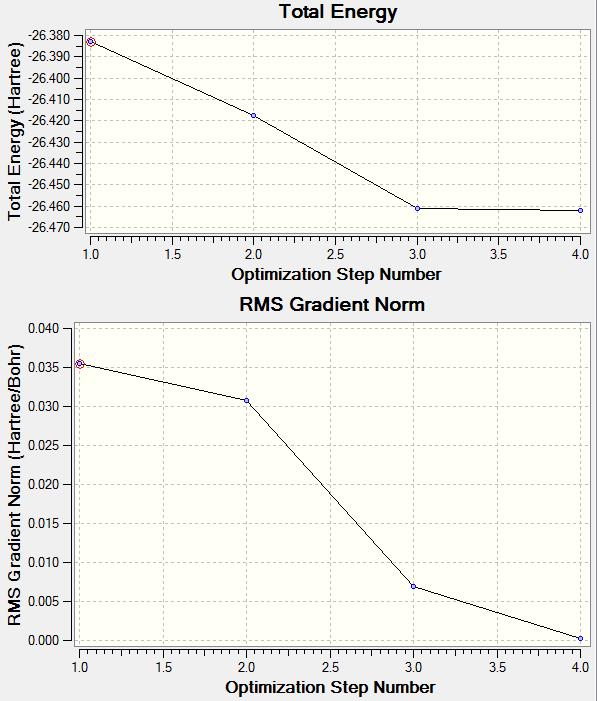
From the LOG file obtained it is also possible to obtain information about each individual step of the optimization, this has been displayed in the graphs below. The top graph shows the total energy, this decreases as would be expected for a molecule that is being stabilized. The bottom graph shows the RMS Gradient Norm, this shows whether the geometry of the molecule has been converged successfully after optimization. The value by the 4th optimization is very near to zero and so can be said to have completed.
The next step was to improve the quality of the optimization by running a further optimization of the BH3 molecule. This was done using the same method as before but using a more precise basis set: 6-31G(d,p). This resulted in a bond length of 1.19143 and a bond angle of 29.99999 degrees. The LOG file for this calculation is located here:Log file here.
Again the log file was checked to confirm that the optimization has worked successfully, this can be seen below and will be included after every optimization without explanation from now on (unless a second optimization is run straight after with no analysis, it will still have been checked to show that the molecule had been fully converged).
        Item               Value     Threshold  Converged?
Maximum Force            0.000433     0.000450     YES
RMS     Force            0.000284     0.000300     YES
Maximum Displacement     0.001702     0.001800     YES
RMS     Displacement     0.001114     0.001200     YES
Predicted change in Energy=-1.189019D-06
Optimization completed.
   -- Stationary point found.
The summary table from this optimization can be seen below, it can be seen that the basis set has indeed been changed but key facts like the point group have remained the same.

The new optimized energy for this file was -26.61532252 au. This has changed from the previously optimized bond energy of -26.46226338 au. this energy is lower by 0.15305914 a.u. (401.85677207 KJ mol-1) which implies that the new molecule is more stable however these can not be compared, as stated by Professor Hunt "You can only compare energies for molecules with exactly the same number of atoms and with exactly the same basis-set used on every atom". The reason you cant compare the two results is because the total energy is very dependent on the basis set used and so will vary accordingly.
| Basis set | Energy (a.u.) |
|---|---|
| 3-21G | -26.46226338 |
| 6-31G(d,p) | -26.61532252 |
Optimization of TlBr3
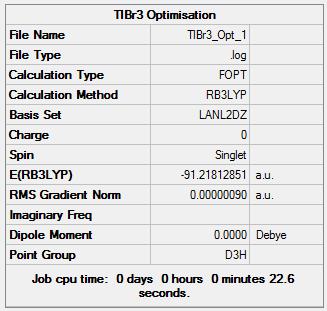
TlBr3 was created on Gaussview using a molecule fragment of TlH3 then substituting the hydrogen atoms for bromine atoms. The next step was to restrict the symmetry of the by assigning it the point group of D3h, the tolerance for this was set to "Very Tight" in an attempt to improve the accuracy. The molecule was then optimized using the HPC, the conditions of the optimization where a method of DFT, B3LYP and a basis set of LanL2DZ. This optimization is shown in the log file TlBr3 optimization
        Item               Value     Threshold  Converged?
Maximum Force            0.000002     0.000450     YES
RMS     Force            0.000001     0.000300     YES
Maximum Displacement     0.000022     0.001800     YES
RMS     Displacement     0.000014     0.001200     YES
Predicted change in Energy=-6.084083D-11
Optimization completed.
   -- Stationary point found.
The Bond length obtained from this optimization was 2.65095Å and the bond angle was 120.000 degrees, this bond length was close to the literature value of 2.564 Å[1] although there is still a definite difference most likely due to the basis set used and the fact that Gaussian treats all molecules as though they are in the gas phase and this reference is not.
Optimization of BBr3
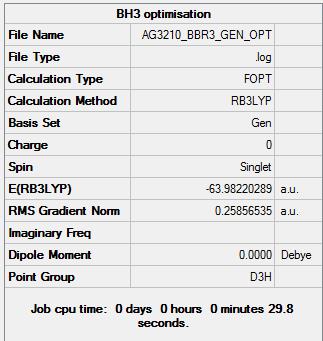
The initial approach to this molecule was to take the previously optimized BH3 molecule and substitute the hydrogen atoms for bromine atoms, this molecule was then optimized with a different basis set. GEN was used to allow different basis for each type of atom, the command that was used with GEN was "pseudo=read gfinput" which allowed the pseudo-potentials to be specified for each different atom. The specifications where made by editing the input file to include the following commands:
B 0
6-31G(d,p)
****
Br 0
LanL2DZ
****
Br 0
LanL2DZ
This states that the Boron atom would be optimized using the 6-31G(d,p) basis and the bromine atoms would be optimized using the LanL2DZ basis.
The log file for this optimisations is here: BBr3 Optimization
        Item               Value     Threshold  Converged?
Maximum Force            0.000246     0.000450     YES
RMS     Force            0.000161     0.000300     YES
Maximum Displacement     0.001151     0.001800     YES
RMS     Displacement     0.000754     0.001200     YES
Predicted change in Energy=-4.716288D-07
Optimization completed.
   -- Stationary point found.
The optimized bond length for this molecule is 1.93333Å and the optimum bond angle is 120.000 degrees.
Results and Discussion for Bond lengths
The Gaussian program can not definitively tell if a bond is present or not, it compares the distance between the atoms to its database and if they are within an acceptable distance it draws a bond there . This is different to how chemists look at bonds but is an efficient way for a machine to do so. A chemical bond is formed by the attractive electrostatic force exerted by the oppositely charged electrons and neutrons in the case of covalent bonds, oppositely charged ions in the case of ionic bonds and the differences of charge distribution on a molecule in the case of dipole dipole interactions.
In this module we are focusing on covalent bonds where an energy minimum is achieved by the sharing of a pair or multiple pairs of electrons. This minimum is achieved by balancing the attractive electron-proton interactions with the repulsive electron-electron and proton-proton interactions. The distance at which this is achieved is known as the bond length, it is important to note that in different conditions this value can vary. It is often the case that a molecule will form at least one bond thereby gaining electrons to the point where its outer shell is complete, this stabilizes the molecule lowering its energy. It is important to note that for some molecules it is more stable for them to lose a small number of electrons (normally 1 or 2) and form a stable ion which is stabilized by a counter ion of the opposite charge.
If looking at a preformed bond from a physical perspective it is seen as an area with a probability of high electron density, this therefore also implies that if an area has a probability of little or no electron density there is unlikely to be a bond present.
The Table below contains the calculated bond lengths obtained:
| Molecule | Bond Length (Â) |
|---|---|
| BH3 | 1.19143 |
| BBr3 | 1.93333 |
| TlBr3 | 2.65095 |
If we first compare BH3 with BBr3 the bond length increases by 0.7419Â. As boron is the central atom for both molecules the effect lies solely with the differences between hydrogen and bromine. Both atoms require 1 electron to complete there outer shell however for hydrogen this is the 1S shell and for bromine it is the 4P shell, the most obvious difference is that bromine is much larger than hydrogen. Bromine has an covalent radius of approximately 120±3 pm[2] where as hydrogen is only 31±5 pm[3] , this however would account for a difference of 0.89±8 Â . The larger difference is most likely due to the bromine atom, which is very diffuse compared too the hydrogen atom and so it is expected that the overlap area will be more for the bromine atom. This may make up the difference between the two values.
The second comparison that can be made is that of BBr3 and TlBr3, here the central atom has been changed rather than the outer 3. The bond length has increased by 0.71762Â when boron was changed to thallium, boron and thallium are both group 3 elements and so have the same number of valence electrons. If we apply the same addition of covalent atomic radii approach as before; thallium = 145±7 Â[4] and boron = 84±3 pm[5] then the expected change in bond length is 0.61±10 Â. This value is less than the calculated result (although the upper limit is close to the value obtained), this is probably due to both thallium and bromine having diffuse outer orbitals, resulting in a weaker, longer bond than the covalent radius would predict.
Frequency analysis for BH3
The previously optimized BH3 molecule was taken and a vibrational frequency analysis was run, the log file for which is below: Frequency analysis for BH3 LOG
To confirm that the optimization values where correct the frequency analysis should show the low frequencies within a range of ±15 cm-1
Low frequencies ---   -0.9432   -0.8611   -0.0054    5.7455   11.7246   11.7625
Low frequencies --- 1162.9963 1213.1826 1213.1853
The summary table for the vibrational frequency analysis is shown below:
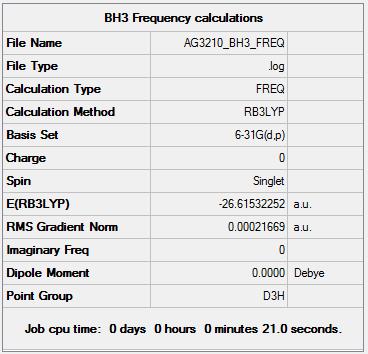
From the vibrational frequency analysis it is possible to view the predicted bond vibrations and there associated energy's. These have been tabulated below. The table also contains a description of the motion of the molecules, the frequency at which the molecule is vibrating and the symmetry label for that vibration:
Below is the predicted IR spectrum for BH3:
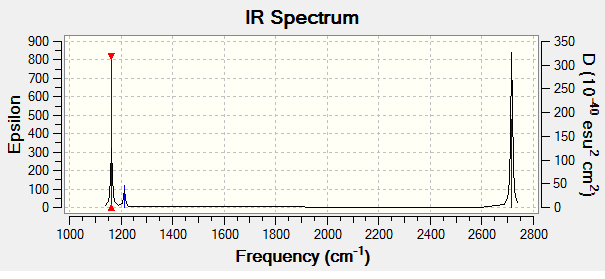
As can be seen from the successful frequency analysis there are 6 vibrational modes for the BH3 molecule, this is in good agreement with the degrees of freedom analysis which takes the form of an equation: 3n-6 where n is the number of atoms in the molecule. For BH3 this gives a result of 6 and so all the expected vibrations are present.
The predicted IR spectrum contains only peaks despite there being 6 vibrations, this is in part due to the nature of IR spectroscopy, if a vibration does not result in a change in dipole then it is not IR active and so would not show up on an IR spectrum. As can be seen on the spectrum, there is no peak at 2582.28 cm-1 this is because this vibration does not involve a change in dipole moment. The other "missing" peaks are due to the vibrations have degenerate energy (frequency) with another vibration, this means that although they cant be distinguished on an IR spectrum they are indeed still present. The peaks containing 2 different vibrations are the ones at 2715.45 cm-1 and 1213.19 cm-1.
Frequency analysis for TlBr3
A vibrational frequency analysis was run on the previously optimized TlBr3 molecule, the file for this can be found here:DOI:10042/23448
The low frequency's for this calculation are shown below and are within the acceptable range of ±15 cm-1. There are also no negative frequency's which could indicate that the calculation had not worked properly.
Low frequencies ---   -3.4213   -0.0026   -0.0004    0.0015    3.9367    3.9367
Low frequencies ---   46.4289   46.4292   52.1449
A similar table to that prepared for BH3 is shown below containing the same information but for TlBr3:
There are again 6 vibrational frequencies for the same reasons there where 6 for BH3, the predicted IR spectrum for TlBr3 is shown below:

There are 3 visible peaks in this IR spectrum, like that of BH3, This is due to the same reasons as before with the vibrations at 210.69 cm-1 and 46.43 cm-1 being degenerate and the vibration at 165.27 cm-1 having non change in dipole. The peaks in this IR spectrum appear broader than for the BH3 spectrum due to the different scale.
Comparison and analysis of vibrational frequency
The results from the vibrational analysis of BH3 and TlBr3 have been collated below for easier comparison:
| BH3 Frequency (cm-1) | Intensity | Symmetry label | TlBr3 Frequency (cm-1) | Intensity | Symmetry label |
|---|---|---|---|---|---|
| 1163.00 | 92.548 | A2" | 46.43 | 3.6867 | E' |
| 1213.19 | 14.0551 | E' | 46.43 | 3.6867 | E' |
| 1213.19 | 14.0587 | E' | 52.14 | 5.8466 | A2" |
| 2582.28 | 0.0000 | A1' | 165.27 | 0.0000 | A1' |
| 2715.45 | 126.3302 | E' | 210.69 | 25.4830 | E' |
| 2715.45 | 126.3206 | E' | 210.69 | 25.4797 | E' |
The most obvious difference between the two sets of results is that the TlBr3 frequency's are much lower than that of BH3, this is due to the TlBr3 molecule being much larger than the BH3 and the orbitals being more defuse. The frequency of a bond vibration is due to both the length of the bond and the mass of the atom on each end of the bond. Poorer orbital overlap as discussed before relates to longer, weaker bonds and so the frequency can be used to discuss bond strength, where lower frequencies imply longer, weaker bonds. Thallium and bromine are both also a lot heaver than boron and hydrogen again relating to the lower frequency.
Both molecules have the same point group symmetry and also have the same number of vibrations with the same symmetry labels, this is as would be expected. It can be seen that the order of the vibrations when ordered by frequency are not the same, these however are all bending frequencies and are in a similar range so the difference is not very significant. The general trend is that the lower frequency vibrations are due to bending motions where as the high frequency vibrations are due to bond stretches, bond stretches also tend to have larger intensities.
Natural Bond Orbital analysis for BH3
The previously optimized BH3 molecule was opened as a checkpoint file and a energy calculation was run using the DFT, B3LYP method with a 6-31G(d,p) basis set. The file for this calculations can be found at:DOI:10042/23492
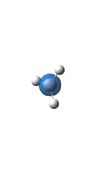
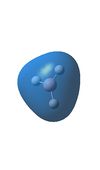
The Table below shows the orbitals that have been calculated:
| MO Image | Energy | Occupancy | MO Image | Energy | Occupancy |
|---|---|---|---|---|---|
 |
-6.77140 | 2 |  |
-0.06605 | 0 |
 |
-0.51254 | 2 | 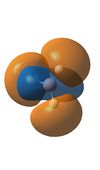 |
0.16839 | 0 |
 |
-0.35079 | 2 |  |
0.17929 | 0 |
 |
-0.35079 | 2 | 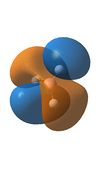 |
0.17929 | 0 |
The molecular orbital diagram below is for a molecule of BH3, it contains the molecular orbitals obtained from the energy calculations run before. The diagram also shows the corresponding orbitals that make up each of the molecular orbitals, there is no consistency in bonding and anti bonding orbitals between each separate molecular orbital sketch. Molecular orbitals that are degenerate have been shown slightly above and below each other as per the normal convention, all symmetry labels have also been added, the point group of the BH3 molecule is D3h.

NH3 NBO analysis
A molecule of NH3 was generated using the appropriate fragment from the database, it was then optimized using the DFT, B3LYP method with a 6-31G(d,p) basis set. The initial NH3 molecule was optimized as shown in the log file: NH3 optimization file
Below is the summary table from the optimization:
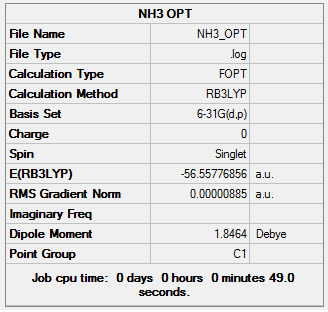
Item               Value     Threshold  Converged?
Maximum Force            0.000024     0.000450     YES
RMS     Force            0.000012     0.000300     YES
Maximum Displacement     0.000079     0.001800     YES
RMS     Displacement     0.000053     0.001200     YES
Predicted change in Energy=-1.629678D-09
Optimization completed.
   -- Stationary point found.
Next a frequency analysis was run on the molecule using the same method and basis set.The Frequency log file can be found using the following link: NH3 Frequency file
Low frequencies ---  -30.8069   -0.0010   -0.0009   -0.0006   20.2226   28.2150
Low frequencies --- 1089.5530 1694.1234 1694.1863
NBO Analysis of NH3
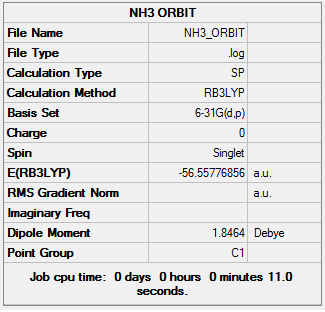
The previously optimized NH3 molecule was run through a energy calculation using the same method and basis set as before. The file for this can be found here:NH3 energy calculations The summary table for this calculation is shown below:
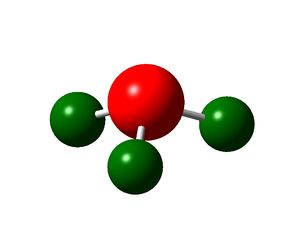
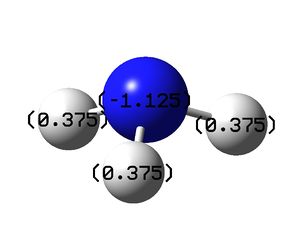
Charge Distribution of -1.125 to +1.25 where green is positive charge and red is negative charge, this is shown on the left. The image on the right shows the molecule with the charges on each atom labeled. The analysis shows that as would be expected all the negative charge density is located on the nitrogen atom while all of the hydrogen atoms are positively charge. To ensure that the calculation has been successful the charges should total zero as the molecules is neutral, this is the case here.
The below table shows the percentage makeup of the bonds,
(Occupancy)   Bond orbital/ Coefficients/ Hybrids
---------------------------------------------------------------------------------
    1. (1.99909) BD ( 1) N   1 - H   2
               ( 68.83%)   0.8297* N   1 s( 24.87%)p 3.02( 75.05%)d 0.00(  0.09%)
                                          -0.0001 -0.4986 -0.0059  0.0000 -0.2910
                                           0.0052  0.8155  0.0277  0.0000  0.0000
                                           0.0281  0.0000  0.0000  0.0032  0.0082
               ( 31.17%)   0.5583* H   2 s( 99.91%)p 0.00(  0.09%)
                                          -0.9996  0.0000  0.0072 -0.0289  0.0000
    2. (1.99909) BD ( 1) N   1 - H   3
               ( 68.83%)   0.8297* N   1 s( 24.86%)p 3.02( 75.05%)d 0.00(  0.09%)
                                           0.0001  0.4986  0.0059  0.0000  0.2910
                                          -0.0052  0.4078  0.0138  0.7062  0.0240
                                           0.0140  0.0243  0.0076  0.0033  0.0031
               ( 31.17%)   0.5583* H   3 s( 99.91%)p 0.00(  0.09%)
                                           0.9996  0.0000 -0.0072 -0.0145 -0.0250
    3. (1.99909) BD ( 1) N   1 - H   4
               ( 68.83%)   0.8297* N   1 s( 24.87%)p 3.02( 75.05%)d 0.00(  0.09%)
                                           0.0001  0.4986  0.0059  0.0000  0.2909
                                          -0.0052  0.4077  0.0138 -0.7062 -0.0239
                                           0.0140 -0.0243 -0.0076  0.0033  0.0031
               ( 31.17%)   0.5583* H   4 s( 99.91%)p 0.00(  0.09%)
                                           0.9996  0.0000 -0.0072 -0.0145  0.0250
    4. (1.99982) CR ( 1) N   1           s(100.00%)
                                           1.0000 -0.0002  0.0000  0.0000  0.0000
                                           0.0000  0.0000  0.0000  0.0000  0.0000
                                           0.0000  0.0000  0.0000  0.0000  0.0000
    5. (1.99721) LP ( 1) N   1           s( 25.38%)p 2.94( 74.53%)d 0.00(  0.10%)
                                           0.0001  0.5036 -0.0120  0.0000 -0.8618
                                           0.0505  0.0000  0.0000  0.0000  0.0000
                                           0.0000  0.0000  0.0000 -0.0269  0.0155
It can be read from this that 68.83% of the N-H bond is made up of the nitrogen atoms orbitals with 75.05% of that being from the 2p orbital and 24.87% from the 1s orbital. 31.17% of the N-H bond is from the hydrogen atoms orbitals 99.91% of which is from the 1s orbital.
Natural Bond Orbitals (Summary):
                                                           Principal Delocalizations
          NBO                        Occupancy    Energy   (geminal,vicinal,remote)
====================================================================================
Molecular unit  1  (H3N)
    1. BD (   1) N   1 - H   2          1.99909    -0.60417
    2. BD (   1) N   1 - H   3          1.99909    -0.60417
    3. BD (   1) N   1 - H   4          1.99909    -0.60416
    4. CR (   1) N   1                  1.99982   -14.16768
    5. LP (   1) N   1                  1.99721    -0.31756  24(v),16(v),20(v),17(v)
                                                   21(v),25(v)
    6. RY*(   1) N   1                  0.00000     1.20799
    7. RY*(   2) N   1                  0.00000     3.73005
    8. RY*(   3) N   1                  0.00000     0.73750
    9. RY*(   4) N   1                  0.00000     0.77341
   10. RY*(   5) N   1                  0.00000     0.77342
   11. RY*(   6) N   1                  0.00000     2.29040
   12. RY*(   7) N   1                  0.00000     2.29041
   13. RY*(   8) N   1                  0.00000     2.40939
   14. RY*(   9) N   1                  0.00000     2.16324
   15. RY*(  10) N   1                  0.00000     2.32730
   16. RY*(   1) H   2                  0.00112     1.11323
   17. RY*(   2) H   2                  0.00045     1.84850
   18. RY*(   3) H   2                  0.00034     2.31981
   19. RY*(   4) H   2                  0.00000     2.94718
   20. RY*(   1) H   3                  0.00112     1.11322
   21. RY*(   2) H   3                  0.00045     1.84851
   22. RY*(   3) H   3                  0.00034     2.31980
   23. RY*(   4) H   3                  0.00000     2.94717
   24. RY*(   1) H   4                  0.00112     1.11348
   25. RY*(   2) H   4                  0.00045     1.84826
   26. RY*(   3) H   4                  0.00034     2.31978
   27. RY*(   4) H   4                  0.00000     2.94712
   28. BD*(   1) N   1 - H   2          0.00000     0.48620
   29. BD*(   1) N   1 - H   3          0.00000     0.48619
   30. BD*(   1) N   1 - H   4          0.00000     0.48616
      -------------------------------
             Total Lewis    9.99429  ( 99.9429%)
       Valence non-Lewis    0.00000  (  0.0000%)
       Rydberg non-Lewis    0.00571  (  0.0571%)
      -------------------------------
           Total unit  1   10.00000  (100.0000%)
          Charge unit  1    0.00000
NH3BH3
The initial optimization file can be found at DOI:10042/23523
Item               Value     Threshold  Converged?
Maximum Force            0.000124     0.000450     YES
RMS     Force            0.000057     0.000300     YES
Maximum Displacement     0.000660     0.001800     YES
RMS     Displacement     0.000304     0.001200     YES
Predicted change in Energy=-1.649845D-07
Optimization completed.
   -- Stationary point found.
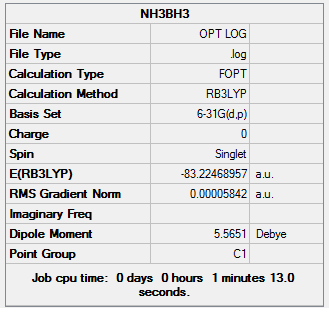
The frequency calculations can be found at DOI:10042/23525
Low frequencies ---   -0.0001    0.0002    0.0011   15.1784   21.2873   42.3165
Low frequencies ---  266.9099  632.2595  638.6232
| Molecule | Energy (a.u.) |
|---|---|
| E(NH3) | -56.55776856 |
| E(BH3) | -26.61532252 |
| E(NH3BH3) | -83.22468957 |
The energy difference between the the final BH3NH3 molecule and the two reactants is calculated to be: -0.05159849 a.u. This is equivalent to -135.47 KJ[6] mol-1 and can be recorded as the bond association energy, the inverse being the bond dissociation energy.
PART 2 Investigating aromaticity

This project will be looking at the aromatic compound benzene, in it the conformers, vibrations, bond energy's and MO's of benzene will be analyzed as well as its analogues.
Benzene
The first step in this project is to make a fully optimized benzene molecule. This was done using first the 3-21G basis set, followed by the 6-31G(d,p). The final optimization can be found here DOI:10042/23542 .
Item               Value     Threshold  Converged?
Maximum Force            0.000090     0.000450     YES
RMS     Force            0.000024     0.000300     YES
Maximum Displacement     0.000337     0.001800     YES
RMS     Displacement     0.000103     0.001200     YES
Predicted change in Energy=-4.743663D-08
Optimization completed.
   -- Stationary point found.
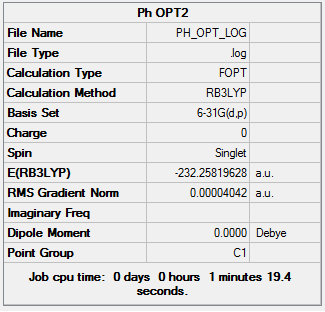
A frequency analysis was then run of the optimized benzene molecule to confirm the success of the optimization. DOI:10042/23547
Low frequencies ---  -16.8786  -16.7630   -4.0197   -0.0008   -0.0003    0.0008Ä
Low frequencies ---  414.2728  414.5526  620.8179
Optimization with the correct point group of D6hcan be found here: DOI:10042/23670
Item               Value     Threshold  Converged?
Maximum Force            0.000084     0.000450     YES
RMS     Force            0.000029     0.000300     YES
Maximum Displacement     0.000182     0.001800     YES
RMS     Displacement     0.000075     0.001200     YES
Predicted change in Energy=-4.892354D-08
Optimization completed.
   -- Stationary point found.

The corrected frequency analysis can be found here: DOI:10042/23687
Low frequencies ---   -0.0088   -0.0043   -0.0042   11.3041   11.3041   15.5388
Low frequencies ---  414.2825  414.2825  621.2723
The energy for benzene was then calculated using Gaussian, this is to allow for the orbitals to be generated so that they can be analyised. The files for this calculation can be found here: DOI:10042/23792
Boratobenzene
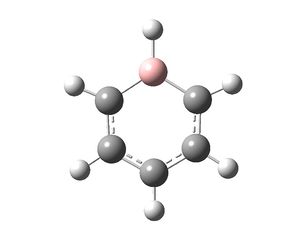
Borobenzene: DOI:10042/23583
Bromobenzene optimization 2 can be found at DOI:10042/23651
Item               Value     Threshold  Converged?
Maximum Force            0.000061     0.000450     YES
RMS     Force            0.000018     0.000300     YES
Maximum Displacement     0.000279     0.001800     YES
RMS     Displacement     0.000089     0.001200     YES
Predicted change in Energy=-3.759470D-08
Optimization completed.
   -- Stationary point found.

Frequency analysis DOI:10042/23658
Low frequencies ---  -12.4140   -0.0006   -0.0003    0.0011   13.9794   18.0409
Low frequencies ---  371.3803  404.1484  565.1933
A new optimization was then run with the correct C2v symmetry group applied, this is found here: DOI:10042/23677
Item               Value     Threshold  Converged?
Maximum Force            0.000061     0.000450     YES
RMS     Force            0.000019     0.000300     YES
Maximum Displacement     0.000244     0.001800     YES
RMS     Displacement     0.000077     0.001200     YES
Predicted change in Energy=-3.516770D-08
Optimization completed.
   -- Stationary point found.
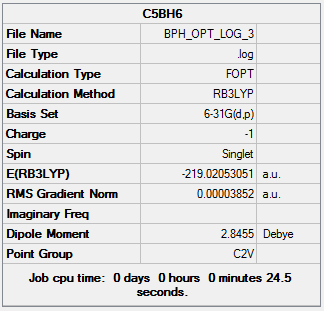
The frequency analysis to go with this corrected optimization can be found here: DOI:10042/23695
Low frequencies ---  -12.2218    0.0007    0.0009    0.0011   13.8250   18.0448
Low frequencies ---  371.3707  404.1615  565.1983
The energy calculation files can be found here: DOI:10042/23798
Pyridinium

Initial optimization of C5NH6 DOI:10042/23655
The second optimization of this molecule can be found here: DOI:10042/23699
        Item               Value     Threshold  Converged?
Maximum Force            0.000102     0.000450     YES
RMS     Force            0.000032     0.000300     YES
Maximum Displacement     0.000835     0.001800     YES
RMS     Displacement     0.000253     0.001200     YES
Predicted change in Energy=-1.440721D-07
Optimization completed.
   -- Stationary point found.
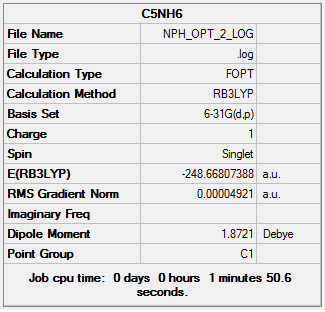
A frequency analysis was then run: DOI:10042/23713
Low frequencies ---   -6.6364   -0.0011    0.0004    0.0005   17.2484   18.1501
Low frequencies ---  392.4863  404.0340  620.5135
A third optimization was then run to account for the symmetry of the molecule this can be found here: DOI:10042/23711
Item               Value     Threshold  Converged?
Maximum Force            0.000141     0.000450     YES
RMS     Force            0.000049     0.000300     YES
Maximum Displacement     0.000829     0.001800     YES
RMS     Displacement     0.000235     0.001200     YES
Predicted change in Energy=-1.935802D-07
Optimization completed.
   -- Stationary point found.

The frequency to go with the corrected point group optimization is here: DOI:10042/23715
Low frequencies ---   -6.7182   -0.0008   -0.0007    0.0003   17.2697   18.1753
Low frequencies ---  392.5279  404.0317  620.5193
The energy calculation files can be found here: DOI:10042/23799
Borazine

The initial optimization of borazine can be found here: DOI:10042/23743
The second optimization can be found here: DOI:10042/23754
       Item               Value     Threshold  Converged?
Maximum Force            0.000152     0.000450     YES
RMS     Force            0.000053     0.000300     YES
Maximum Displacement     0.000800     0.001800     YES
RMS     Displacement     0.000251     0.001200     YES
Predicted change in Energy=-4.537932D-07
Optimization completed.
   -- Stationary point found.
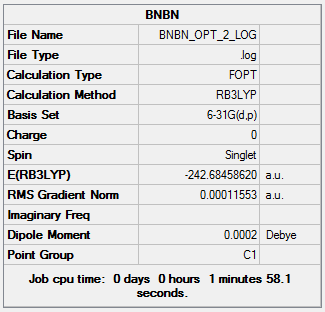
The frequency analysis to go with the second optimization can be found here: DOI:10042/23781
Low frequencies ---  -18.0986  -12.2623  -10.3911   -0.0002    0.0005    0.0008
Low frequencies ---  288.9499  289.6553  404.6068
The third optimization which includes the point group symmetry of the molecule, D3h, can be found here: DOI:10042/23760
Item               Value     Threshold  Converged?
Maximum Force            0.000123     0.000450     YES
RMS     Force            0.000055     0.000300     YES
Maximum Displacement     0.000510     0.001800     YES
RMS     Displacement     0.000174     0.001200     YES
Predicted change in Energy=-3.513812D-07
Optimization completed.
   -- Stationary point found.

The frequency analysis for the optimized molecule using the D3h point group can be found here: DOI:10042/23795
Low frequencies ---   -9.6448   -9.6448   -9.5628   -0.0210   -0.0103   -0.0103
Low frequencies ---  289.2263  289.2263  404.2038
The energy calculation file can be found here: DOI:10042/23793
NBO, Charge Distribution analysis
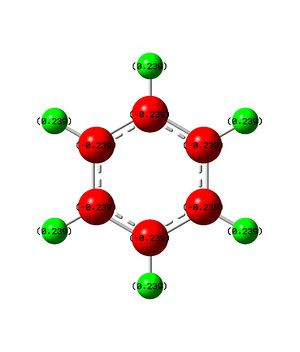
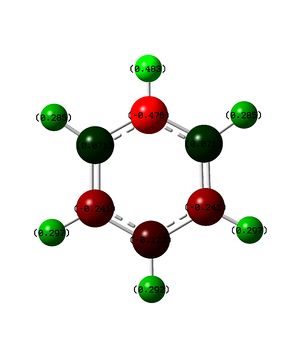
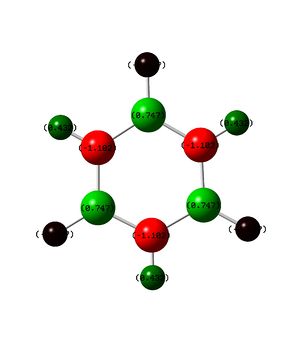
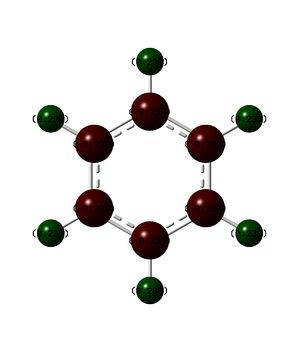
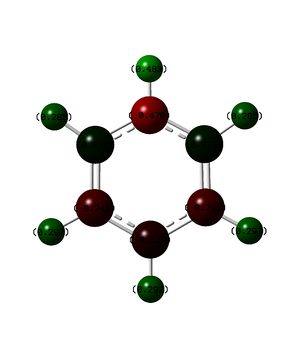
The above table contains all of the charge distribution information, all four molecules have been place in this table to allow for easy comparison. We shall initialy look at benzene where it can be seen that all carbon atoms contains the same change (-0.239) and all hydrogen atoms hold the same counter charge to the carbon atoms (0.239). As there are equal numbers of carbon and boron atoms the overall charge on the molecule is zero, as was expected. The uniformity of the charge distribution confirms the concept that you cannot distinguish between CH groups on a benzene ring.
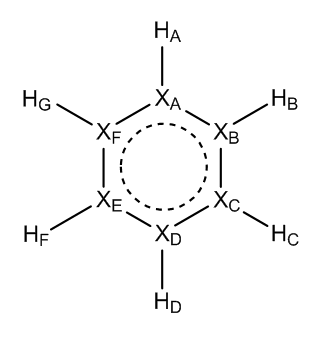
Next on the table is the boratobenzene anion, this structure is isoelectronic to benzene but because of the electropositive boron atom present in the molecule the charge distribution is very different. The Boron atom is located at XA and has a charge of 0.202, this is positive as would be expected, because boron has one less electron than carbon a negative charge was introduced to the system to make it isoelectronic. The data collected indicates that the charge has been located on the carbon atoms, mainly at positions XB and XF but also to a lesser extent the other carbon atoms. By taking the charges on each of the carbon atoms in boratobenzene, combining them then subtracting the charges present on 5 carbon atoms from benzene it can be seen that the combined charge difference is -0.821, therefore the majority of the added negative charge has been dissociated across the electrons rather than into the aromatic ring as might have been expected. It is also interesting to note that the hydrogen atom attached to the boron atom (HA) has a larger negative charge than the other hydrogen atoms.
Pyridinium has been constructed in a similar manner to boratobenzene but the charges have been reversed, that is to say that the nitrogen atom inserted has one more electron than carbon and so a positive charge has been applied to the molecule. It would be predicted that this would have the inverse effect of inserting a boron atom and this is the case (but not exactly). Across the 5 carbon atoms in pyridinium there is a charge of -0.462, across 5 carbon atoms in benzene there is expected to be a charge of -1.195 meaning that across the carbon atoms in pyridinium there is a extra charge of 0.733. The remaining positive charge is expected to be present across the nitrogen and hydrogen atoms, a quick comparative analysis with benzene shows that the hydrogen's have a net charge of 0.505 more than benzene this leaves a charge -0.238 on the nitrogen which, can be seen to be correct as the charge on the nitrogen atom is -0.237 less than benzene. To summarize all all of the charge is accounted for.
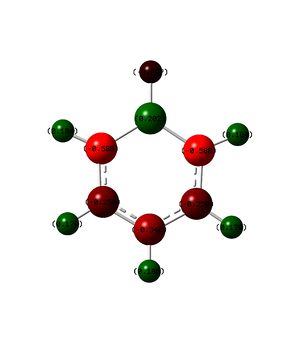
Borazine is the most different of the 4 aromatic compounds, it is isoelectronic but does not contain any carbon atoms. It can be seen that across the molecule there are large fluctuations in the charge but overall analysis shows that they all balance out as expected.
It can be summarized that when a atom that is more electronegative or electropositive than the other atoms in the ring is added the other atoms will adapt to distribute the charge. The majority of the charge is moved to the atoms ortho to the inserted atom, the next biggest change is seen at the para position then the lowest is at the meta position.
NMR aromaticity analysis of Borazine
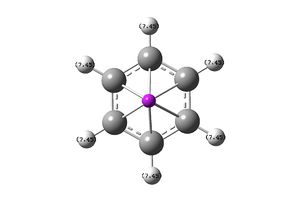
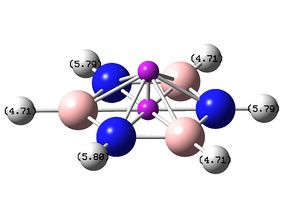
The most common way of analyzing the aromaticity for chemists is to run an NMR of the compound, Gaussian has the ability to predict the chemical shift of atoms in a compound and so using the previously optimized molecules and NMR analysis has been run. A NICS (nucleus-independent chemical shift) approach has been taken as it is widely considered to be the most accurate way of assessing aromaticity. This involves inserting a ghost proton both inside the aromatic ring and above it by 1Â, the software is then used to predict the chemical shift of that proton, and from this shift the level of aromaticity can be determined. A proton outside an aromatic ring is expected to have a high ppm as it is deshielded by the aromatic ring, a proton inside the aromatic ring is expected to have a very low ppm as it is shielded by the same ring current.
NMR analysis of benzene can be found here: DOI:10042/23964 NMR analysis of benzene can be found here with ghost atoms: DOI:10042/23965
| Molecule with Proton chemical shifts labeled | Chemical shift (ppm) | Chemical shift (ppm) |
|---|---|---|
 |
7.45 | |
 |
±9.93 | ±11.35 |
As can be seen from the pictures and table above the benzene molecule is defiantly aromatic as the protons outside the ring are deshielded and the protons inside are heavily shielded. It is important to note that because of the nature of the software the internal ghost protons are reported as positive values and it it not possible to tell if the result would indeed be negative or not, however are benzene is known to be aromatic it can be recorded as negative.
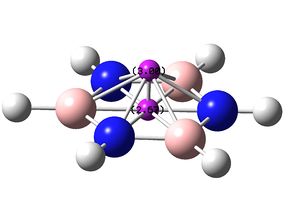
NMR analysis of Borazine can be found here: DOI:10042/23961 NMR analysis of Borazine can be found here with ghost atoms: DOI:10042/23963
| Molecule with Proton chemical shifts labeled | Chemical shift (ppm) | Chemical shift (ppm) |
|---|---|---|
 |
4.71 | 5.79/5.80 |
 |
±2.63 | ±3.00 |
The molecule of borazine is much less like a aromatic compound, this is shown by the much lower ppm values, the predicted values of around 5 are much more like a molecule containing double bonds rather than a compound which is aromatic, the NICS protons in the center of the indicate that there may be slight aromaticity but they can not be used as definitive proof.
In summary borazine is a borderline aromatic compound and does not have the same level of aromaticity as benzene.
MO analysis
From the Energy analysis of benzene run before the molecular orbitals can be obtained, of these orbital the 8 above and 8 below the HOMO/LUMO gap have been taken and placed into a molecular orbital diagram. The molecular orbital diagram does not contain the fragments that make up the molecular orbitals but places the molecular orbitals in order of there energy and contains a sketch next to each of the orbitals so that it can be seen which p and s orbitals make up each one. The gaps between each energy level have been measured to 1 d.p and set against the energys obtained by the calculation and so are reasonably accurate, all symmetry labels where generated by Gaussian.
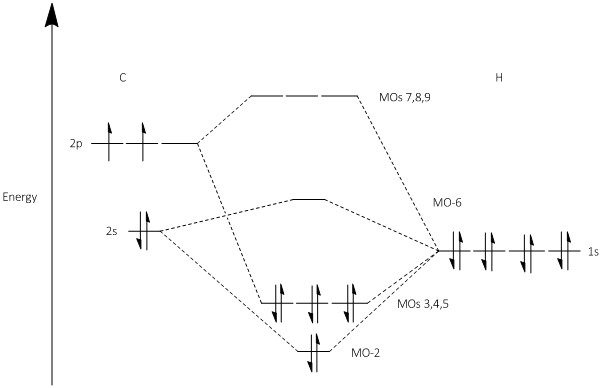
The aromaticity of benzene was confirmed in the NMR analysis before, benzene is known to be aromatic, following Huckel's rule where a molecule is aromatic when it have 4n+2 electrons in its valence electrons where n is a integer number. It is hard to asses aromaticity by looking at a molecular orbital diagram alone, aromaticity is known to be a cyclic pathway for delocalized electrons to travel around a molecule, by looking at the molecular orbitals this kind of pathway can be seen most notably in the a2u symmetry orbital.
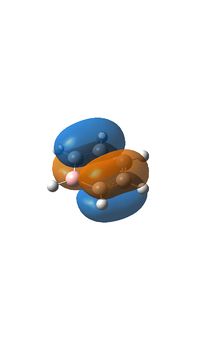
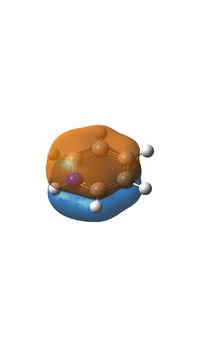
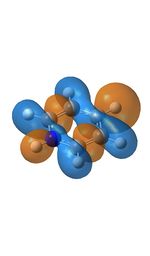
The below table contains three molecular orbitals from each of the aromatic compounds studied, the orbitals where selected because there where of specific interest.
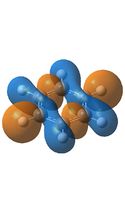
The first orbital, MO17 has a symmetry of a2u and is made entirely of p orbitals, this molecular orbital is the most characteristically aromatic as all of the P orbitals overlap to form a continuous ring above and below the ring which allows the electrons in these orbitals to delocalise. As can be seen all of the molecules studied here contain a continuous ring above and below the ring implying that they are all aromatic. However if the charge density of borazine is also taken into consideration the delocalised nature of the electrons could be questioned as they must pass through largely different environments when traveling round the ring, this is not the uniform image expected for an aromatic ring and is one of the reasons that borazine is much less aromatic than benzene. Close examination of the image of MO17 for borazine shows that the orbitals bend inwards when over a boron atom and outwards over a nitrogen atom thus distorting the aromatic ring, this same bending can be seen more clearly in the boratabenzene and pyridinium images, for the same reason these two molecules are also less aromatic than benzene.
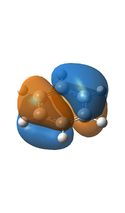
The next molecular orbital along (MO18), is made up of a combination of bonding p and s orbitals with a symmetry of e2g, there are also some anti bonding components to this molecule too. Although the general shape of the molecule orbital is the same in every compound there are some distinctive differences caused by the presence of the nitrogen or boron atom. In boratabenzene the orbitals are generally the same size as in benzene but the s orbital over the hydrogen atom and the px orbital of the boron are larger, the opposite is true over the nitrogen in pyridinium where the orbitals are smaller. This is due to the boron atom being smaller than a carbon atom and so have less protons in the core leading to less charge causing the orbitals to be more diffuse, for nitrogen the opposite effect is true where is have one more proton in its nucleus than carbon.
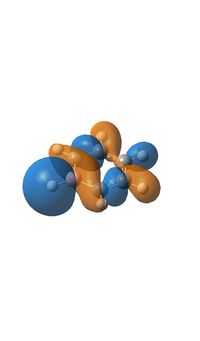
The final MO in the table (MO20) is the highest occupied molecular orbital, in the benzene molecule this consists of three pz orbitals being in the same phase and 3 in the opposite phase, each group being on half the molecule. This leads to a symmetrical molecular orbital with a symmetry of e1g, this however changes when a boron atom is introduced, the result is that now only 4 of the p orbitals are contributing to the molecular orbital with the pz on the boron and the para carbon not being present. In the case of pyridinium the orbital is made up of the pz on the nitrogen being being orientated the other way round to the pz orbitals of the meta and para p orbitals which make up the remainder of the molecular orbital, the ortho carbon pz orbitals are not present. For borazine the molecular orbital is the same as that of benzene.
| Labels | MO 17 E (a.u.) | MO 18 (a.u.) | MO 20( a.u.) |
|---|---|---|---|
| Molecular orbitals for benzene | -0.35998 | -0.33959 | 0.24691 |
| Molecular orbitals for boratabenzene | -0.13211 | -0.09166 | -0.3493 |
| Molecular orbitals for pyridinium | -0.64067 | -0.57438 | -0.5846 |
| Molecular orbitals for borazine | -0.36132 | -0.32000 | -0.27589 |
As can be seen from the comparison of energy's above the the molecular orbitals for boratabenzene are higher than that of benzene and the energies for pyridinium are lower, this is because of the effects described above. Borazines MO's have the same energy as benzene due to the alternating nitrogen and borons canceling out. The expected effect of the differences in energy observed is that all of the mo's for boratabenzene would be higher and for pyridinium lower. The gaps between orbitals is also seen to be larger in the table, for example MO18 is 0.02039 but for boraatabenzen the same difference is roughly double this at 0.04045. From this it can be expected that the orbitals would be more spread out on a molecular orbital diagram.
References
- ↑ J.Glasier, G. Johansson. On the Structures of the Hydrated Thallium (II) Ion and its Bromide Complexes in Aqueous Solution. Acta Chemica Scandinavica. 1982, 36, 125-135 http://actachemscand.dk/pdf/acta_vol_36a_p0125-0135.pdf
- ↑ Wikipedia. Bromine. http://en.wikipedia.org/wiki/Bromine
- ↑ Wikipedia. Hydrogen. http://en.wikipedia.org/wiki/Hydrogen
- ↑ Wikipedia. Thallium. http://en.wikipedia.org/wiki/Thallium
- ↑ Wikipedia. Boron. http://en.wikipedia.org/wiki/Boron
- ↑ University College London. Main Energy Conversion Factors Table. http://www.ucl.ac.uk/~uccaati/Energy.html


