Title=CompMod:YF8102
Year 2 Inorganic Computational Lab
Analysing an EX3 molecule
Borane, BH3 (B3LYP/6-31G level)
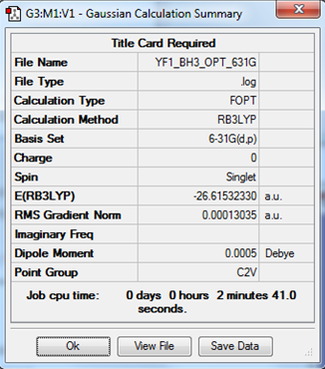
Here is a link to the log file from the optimisationː YF1_BH3_OPT_631G.LOG
The item table below has been extracted from the log file and is often used as an indicator of how successful the optimisation was. We look for force convergence, which in this instance has been confirmed. The values for the forces are close to zero, showing that the system is at an equilibrium point.
    Item               Value     Threshold  Converged?
 Maximum Force            0.000285     0.000450     YES
 RMS     Force            0.000155     0.000300     YES
 Maximum Displacement     0.001015     0.001800     YES
 RMS     Displacement     0.000596     0.001200     YES
Computing a vibrational spectrum
Next, a frequency analysis was carried out to compute how the IR spectrum would look. Here is a link to the frequency analysis log fileː YF1_BH3_FREQ.LOG
These are the low frequencies reported in the log file. The ones on the top row are not within the narrow range of + or - 15 cm-1, however, the point group was correct (D3h was achieved after manual point group correction) and the forces converged, hence the analysis was complete and can be considered accurate.
 Low frequencies ---   -0.1906   -0.0869   -0.0055   57.3412   58.2234   58.2237
 Low frequencies --- 1164.0353 1213.8820 1213.8847
Optimised borane molecule |
| wavenumber (cm-1 | Intensity (arbitrary units) | IR active? | type |
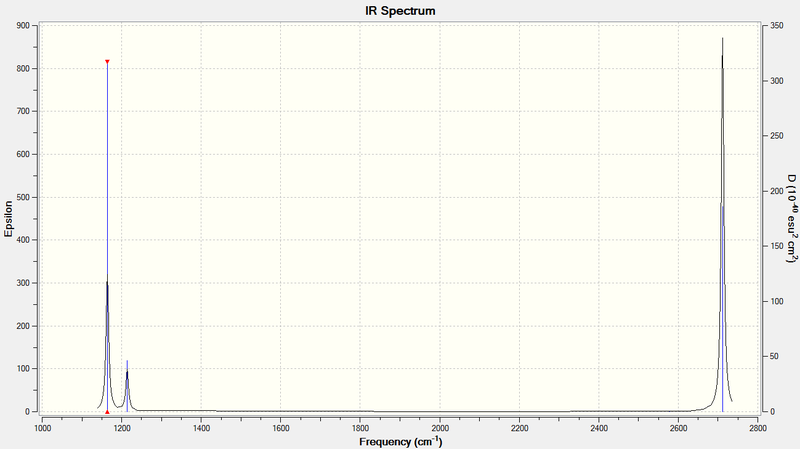
| 1164 | 92 | yes | out-of-plane bend |
| 1214 | 14 | yes | bend |
| 1214 | 14 | yes | bend |
| 2579 | 0 | no | symmetric stretch |
| 2711 | 126 | yes | asymmetric stretch |
| 2711 | 126 | yes | asymmetric stretch |
The infrared spectrum above shows that there are only three peaks. There are six vibrational modes, which is in accordance with the 3N-6 rule for non-linear molecules. A given vibrational mode must be IR active to show up in the spectrum. IR activity is defined by a mode resulting in a change in dipole moment of the molecule. There is one listing in the table which is not IR active. Of the five other vibrational modes, there are two sets of degenerate vibrationsː two stretching and two bending modes. Each pair of degenerate modes would give rise to only one peak in the spectrum. These peaks would be of higher intensity than the non-degenerate mode.
Molecular orbital diagram of BH3
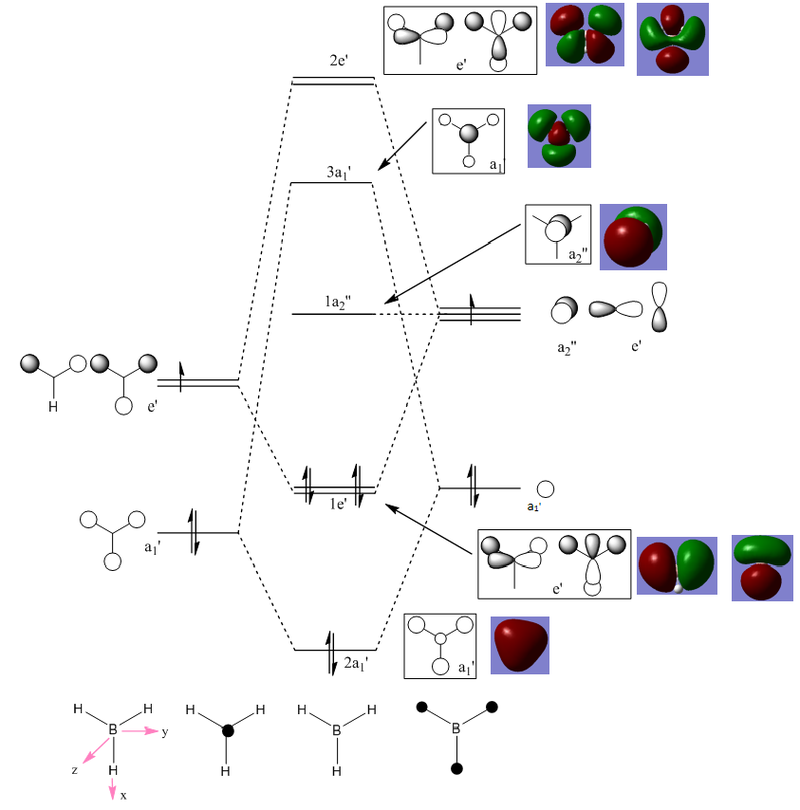
The diagram above depicts the molecular orbital diagram of BH3. The boxed illustrations show the LCAO representations of the molecular orbitals, where the . The red and green illustrations are the computed molecular orbitals. There is great similarity between the LCAO MOs and the computed MOs. This shows that the qualitative theory (LCAO) can be very useful when you want to get an idea of how molecular orbitals might look. However, quantitative theory (computational) should always be used to confirm any predictions.
Ammonia-Borane considerations
These calculations were carried out in a similar fashion to those carried out for BH3. So before the basis set was improved to 6-31G, a preliminary 3-21G optimisation was run. This ensures that any manipulation of the data and comparisons made are valid.
Ammonia, NH3 (B3LYP/6-31G level)
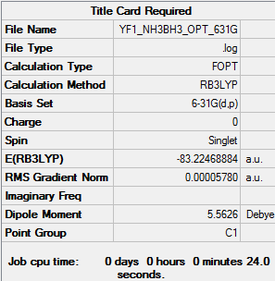
Here is a link to the log file from the optimisationː YF1_NH3_OPT_631G.LOG
         Item               Value     Threshold  Converged?
 Maximum Force            0.000060     0.000450     YES
 RMS     Force            0.000040     0.000300     YES
 Maximum Displacement     0.000369     0.001800     YES
 RMS     Displacement     0.000162     0.001200     YES
Optimised ammonia molecule |
A frequency analysis was also done to ensure that the point was a minimum. The file for this analysis is linked below. YF1_NH3_FREQ.LOG
Low frequencies ---  -32.4235  -32.4224  -11.4276   -0.0044    0.0114    0.0476
Low frequencies --- 1088.7628 1694.0251 1694.0251
Similarly to BH3, these values are not within + or - 15 cm-1, however, the file shows evidence of convergence and the molecules point group, C3v, is correct.
Smf115 (talk) 00:55, 17 May 2018 (BST)Good structure information and aknowledgment of the low frequency values.
Ammonia-Borane, NH3-BH3 (B3LYP/6-31G level)
Here is a link to the log file from the optimisationː YF1_NH3BH3_OPT_631G.LOG
        Item               Value     Threshold  Converged?
 Maximum Force            0.000137     0.000450     YES
 RMS     Force            0.000038     0.000300     YES
 Maximum Displacement     0.001014     0.001800     YES
 RMS     Displacement     0.000224     0.001200     YES
Optimised ammonia-borane molecule |
A frequency analysis was also done to ensure that the point was a minimum. Convergence was achieved. The file for this analysis is linked below. YF1_NH3BH3_FREQ.LOG
 Low frequencies ---  -30.4522   -0.0009   -0.0008   -0.0004   11.2681   13.9355
 Low frequencies ---  261.4025  631.2843  637.8135
Dissociation Energy
Margin of error = 10Kj/mol = 0.0038 AU.
E(BH3)= -26.615 AU E(NH3)= -56.558 AU E(NH3BH3)= -83.225 AU
ΔE= E(NH3BH3)-[E(BH3) + E(NH3)] ΔE= -83.225 -(( -26.615) + (-56.558)) Hence, ΔE= -0.052 AU ΔE= -136.5 Kj/mol
This value is in the region of covalently bonded atom's bond dissociation energy. It can be compared with the value for the bond energy of a N-N single bond, which is 160 Kj/mol. This shows that the bond can be considered to be of weak to medium strength. Higher bond order often results in shorter, stronger bonds and hence higher dissociation energies. For example, the N-N double bond has a bond energy of 946 Kj/mol. The B-N bond is weak in comparison to this.
BBr3 Analysis
This analysis was conducted differently. The bromine atoms are large and have 35 electrons each. Instead of considering all 35 on each atom, only the valence electrons were considered and the core electrons modeled by a pseudo-potential.
Here is a link to the log file from the optimisationː
         Item               Value     Threshold  Converged?
 Maximum Force            0.000008     0.000450     YES
 RMS     Force            0.000005     0.000300     YES
 Maximum Displacement     0.000036     0.001800     YES
 RMS     Displacement     0.000024     0.001200     YES
BBR3 molecule |
A frequency analysis was also done to ensure that the point was a minimum. Convergence was achieved. The file for this analysis is linked below.
Low frequencies ---   -2.3055   -0.0029   -0.0018    0.0774    0.7534    0.7534
 Low frequencies ---  155.9402  155.9405  267.6894
Mini projectː Aromaticity
A comparison of Benzene and Borazine
Benzene
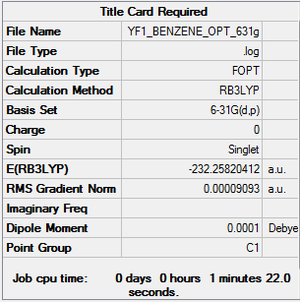
Here is a link to the log file from the optimisationː YF1_BENZENE_OPT_631G.LOG
         Item               Value     Threshold  Converged?
 Maximum Force            0.000198     0.000450     YES
 RMS     Force            0.000082     0.000300     YES
 Maximum Displacement     0.000849     0.001800     YES
 RMS     Displacement     0.000305     0.001200     YES
Benzene molecule |
A frequency analysis was also done to ensure that the point was a minimum. There was evidence of convergence. The file for this analysis is linked below. YF1_BENZENE_FREQ.LOG
Low frequencies ---  -11.6728   -0.0004    0.0004    0.0006    6.6686   15.6846
Low frequencies ---  414.0392  414.6031  621.0860
Borazine
Here is a link to the log file from the optimisationː YF1_BORAZINE_OPT_631G.LOG
         Item               Value     Threshold  Converged?
 Maximum Force            0.000084     0.000450     YES
 RMS     Force            0.000033     0.000300     YES
 Maximum Displacement     0.000276     0.001800     YES
 RMS     Displacement     0.000077     0.001200     YES
Borazine molecule |
A frequency analysis was also done to ensure that the point was a minimum. The file for this analysis is linked below. YF1_BORAZINE_FREQ.LOG
 Low frequencies ---  -12.0044    0.0009    0.0011    0.0013    6.6302   12.3135
 Low frequencies ---  288.6114  290.3380  404.2361
Charge distributions
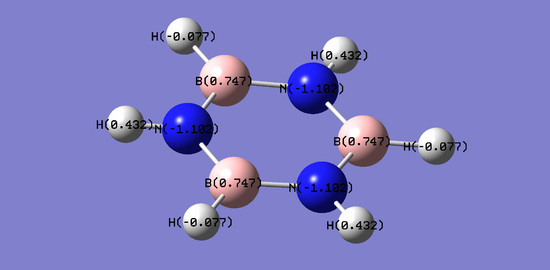
The images below show the computed charge distributions for the benzene and borazine molecules.
The results are summarised in the table below.
| Charge on atom | ||||
|---|---|---|---|---|
| C | H | B | N | |
| Benzene | (-0.239) | (+0.239) | ||
| Borazine | B-H (-0.077) | (+0.747) | (-1.102) | |
| N-H (+0.432) | ||||
In the benzene molecule, there is a constant charge on the carbon and hydrogen atoms. This is because the benzene molecule is c6 symmetric, therefore all of the carbon atoms are in the same environment and thus the hydrogen atoms attached to each carbon are also in the same environments as each other. The value for carbon is negative whilst that for hydrogen is positive. This is a reflection of the electronegativity of the atoms, 2.55 and 2.20 respectively. The uniform charges show that the electron density is equally distributed across the six carbons, so reactivity at each of these atoms would be identical. A similar conclusion can be made for the hydrogen atoms.
Contrastingly, in borazine, the charges are slightly less uniform. Borazine is c3 symmetric, which is reflected in the charge distributions. The nitrogen atoms have the most negative charge densities, whilst the boron atoms have the most positive. The symmetry means that the charges are uniform when considering atoms in similar environments (i.e. identical atoms in identical environments, hence map onto eachother upon c3 rotation, have identical charges). All of the nitrogen and boron atoms are in the same respective environments. However in the case of hydrogen, there are two types of environmentsː bonded to boron and bonded to nitrogen. Hydrogen bonded to boron has a negative charge distribution value whilst hydrogen bonded to nitrogen has a positive value. Considering electronegativity again, B= 2.04, N= 3.04 and H= 2.20 and the more electronegative an atom, the better it can accomodate electron density. Based on these findings, it is expected that the atoms in similar environments would also react similarly.
Smf115 (talk) 23:19, 15 May 2018 (BST)Excellent charge analysis with thorough discussion of the symmetries and electronegativities.
Molecular Orbitals
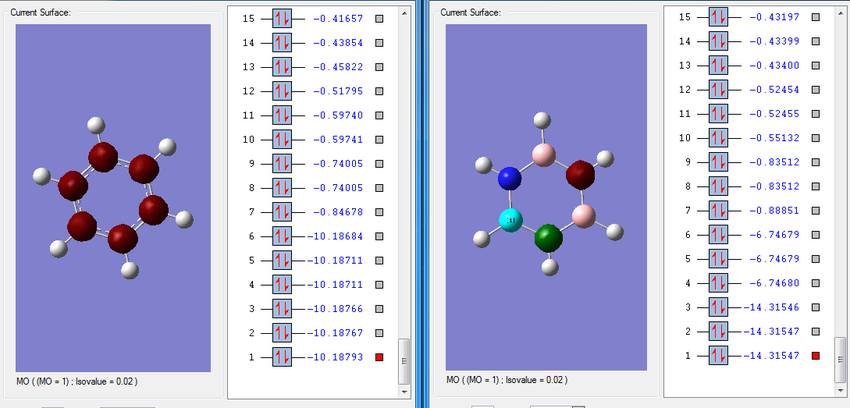
The image below shows a snapshot of the molecular orbitals of benzene and borazine after being computed. The molecular orbitals visualised include all of the occupied orbitals, the LUMO and 5 more unoccupied orbitals. Of the twenty-six molecular orbitals computed for each molecule, it can be seen that the six deepest molecular orbitals have energies much deeper than the remaining twenty. The 2s atomic orbitals on the atoms are combined to produce these fragment orbitals, which are equivalent to molecular orbitals. These orbitals are considered to deep in energy to interact with other orbitals of the same symmetry and thus, are not involved in the MO diagram.
Looking at the molecular orbitals for benzene, the six deep molecular orbitals are all degenerateː they have the same energy (the differences are within the error margin). In the case of borazine, there are two sets of degenerate orbitals. This is again reflecting the differences in symmetry between the two molecules. The benzene is made up of identical carbon atoms and hence the contributions from each AO are equivalent when producing MOs. This results in more symmetrical molecular orbitals.
Comparisons can be made between the molecular orbitals on benzene and borazine. The table below shows a few of those comparisons.
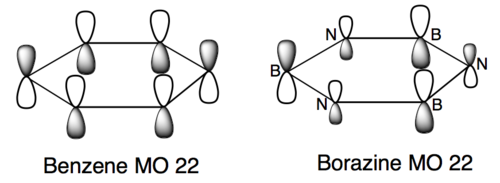
An example of a LCAO representation of the second set of MOs (LUMO MOs) is shown below. The real MO depiction and the LCAO illustration are similar, showing that qualitative molecular orbital theory can be useful to gain insight.
Smf115 (talk) 00:44, 17 May 2018 (BST)Great range of MOs chosen with a clear and well defined comparison. To improve it could have been noted if they were pi- or sigma- orbitals. Excellent extra information about the LCAOs and the valence and core orbitals.
The concept of aromaticity
When benzene was first discovered, there was a lot of dispute over it's structure. It was believed that the molecule was comprised of alternating single and double bonds, known as the Kekulé structure. However, experimental data did not confirm this theory. For example, if this theory were accurate, x-ray crystallography would have shown a mixture of bond lengths, corresponding to c-c single and double bonds. Instead, a single bond length was found, which was an intermediate between single and double bond length values.
In addition, the hydrogenation enthalpy was compared to that of cyclohexene. The value for cyclohexene is approximately -120 kj/mol. Thus, to account for the hydrogenation of three double bonds, the value for the hydrogenation enthalpy of benzene should be -360 kJ/mol. The actual value was found to be -232 kJ/mol, reflecting that benzene had a more stabilised structure than the one proposed by Kekulé. The difference between these two values is called the resonance energy and arises from the extra stabilisation of having a the delocalised ring.
Aromatic compounds can be defined as cyclic, planar molecules obeying Hückel's rule. Hückel's rule is a way to describe the pi electrons involved in the π - system. This system is formed by overlapping pz AOs, and in the expression 4n + 2 = e, where e is the number of electrons in the system, n must have an integer value. This shows why considering the overlapping pz AOs alone is not enough to define aromaticity; Hückel's rule must be obeyed. This is key in distinguishing systems which are simply conjugated from aromatic systems. In benzene and the iso-electronic analogue Borazine, there are 6 pi electrons and hence, n= 1
In relation to the molecular orbital picture, in MO 7, depicted above, the delocalisation of charge can be seen across the entire framework. This relates to the idea of pi electron delocalisation in aromatic compounds.
Smf115 (talk) 00:52, 17 May 2018 (BST)Nice discussion of the basic concepts of aromaticity and its relation to benzene. Some good ideas however, they needed to be developed a bit further and aren't completely correct. For example, MO 7 is actually an example of sigma-aromaticity in the molecule which results in strong delocalisation too.
Smf115 (talk) 00:57, 17 May 2018 (BST)A well presented wiki report and good charge analysis in the second section.
References
F. H. Stephens, V. Pons and R. T. Baker, Dalton Transactions, 2007, 36(25), pp. 2601-2619 (DOI: 10.1039/b703053c)
M. Palusiak and T. M. Krygowski, ChemPubSub Europe, 2007, 13(28), pp. 7996-8006 (DOI: 10.1002/chem.200700250)
J. Clayden, N. Greeves and S. Warren, Organic Chemistry, OUP Oxford, England, 2012

