Talk:Module2:mr60712789
Computational Chemistry Lab- Module 2: Inorganic
Computational chemistry can be used to model transition states and activated complexes, which previously could not be experimentally characterised. Analysis can be run to produce data on IR, NMR, and Dipole Moments, and to predict the molecular orbitals present in the molecule. In this module computational techniques will be used to optimise the energies of molecules, create Molecular Orbitals,and carrying out vibrational analyses.
BH3
The BH3 molecule was drawn in Gauss View 5. The automatic bond lengths present in the molecule were 1.18Å. The molecule produced was a trigonal planar molecule with bond angles of 120o.
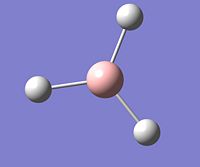
BH3 Optimisation
Using Gauss View the energy of the molecule was optimised by ensuring that the nuclei of the molecule were in the optimum positions for a set electronic configuration. This was done by using the method of B3LYP and the basis set 3-21G and selecting "optimisation". This method imposed works by solving the Schrödinger Equation. The basis set of 3-21G has a low accuracy due to a low degree of complexity. Having said that, in order to generate an optimisation of the molecule that will enable further calcuations to be done relatively quickly, the less accurate basis set was be used. Optimisation produced the following results:
| Bond Length/Å | 1.19 |
| Bond Angle/degrees | 120.0 |
| Charge | 0 |
| Spin | Singlet |
| Final Energy/a.u. | -26.4622 |
| RMS Gradient/a.u. | 0.0002 |
| Dipole Mement/D | 0.00 |
| Point Group | D3h |
The calculation took 10.0 seconds to run.
The accuracy of this method must be taken into account: The Energy of the molecule can have an error of approximately 10kJ/mol which corresponds to 0.003809 a.u., thus the total energy and the RMS gradient are given to 4d.p. The dipole moment is accurate to 2 d.p. and this is why the values are quoted to this accuracy. Bond lengths are accurate to 0.01Å and bond angles are accurate to 0.1o, and this is why the values are quoted to the accuracies.
The results produced show that the optimisation has worked, because the literature values [1] show that the BH3 bond angles are 120o and that the bond length is 1.189Å which are in close agreement to the calculated computational results. The RMS gradient is a relatively small value thus showing that there is not a large deviation between the ideal average in the molecule and what is actually present. This is becuase the RMS is the root mean squared of the molecule thus showing deviations from the average. Furthermore the file produced was analysed and it was shown that the forces and the displacements have converged. During the running of the molecule in Gauss View, the molecule goes through 4 steps to minimise the energy of the molecule. In each step the programme minimises the enery of the molecule until it converges. For this molecule there are only 4 iterations, the more iterations that occur the more likely it is that the enegy has been minimised, however if the calculation takes a long time (i.e. too many iterations) it may mean that the molecule inputted is too complex or the mothod chosen is too complex. The graphs show this step-wise process of lowering the energies because they start off high and then lower until they plateau off as the energy converges to the minimum.

The iteration graph shows 4 points, each corresponding to an iteration step. These are shown below.
 |
 |
 |
 |
These steps show that the first step is where the hydrogens are not bonded to the boron, followed by step 2 where they are close to the boron but not bonded, followed by step 3 where the hydrogens are bonded to the boron and finally step 4 where the hydrogens are bonded and at the optimum bond length.

The RMS gradient graph decreases, showing that the root mean squared of the molecule decreases as the iterations are done. This is logical because as the energy is minimised the deviations from the desired energy (the root mean squared energy) will decreae, as shown in the graph.
Data Files
Optimisation file: https://www.ch.imperial.ac.uk/wiki/index.php/Image:MR607_BH3_OPTIMISATION_FILE.LOG
BH3 Molecular Orbital Analysis
The MO diagram or BH3 is shown below. Please note that only the valence orbitals are shown in the diagram.
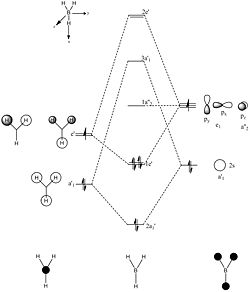
MO analysis was run in Gauss View 5 using the same method as the optimisation above, but with a few changes: "optimisation" was changed to "energy", "Full NBO" was selected, and in additional keywords "pop=full" was filled in. The MO results calculated do include all the orbitals unlike in the molecualr orbital diagram to the left which contains only the valence orbitals. As a reuslt the 1s orbital of the boron is shown seperately below. The 1s orbital in the boron is a non bonding orbital, and this is why the MO appears to look like a standard 1s orbital.

It can be seen that the non-bonding orbital is tightly bound to the boron atom at the centre of the molecule, with no interactions between the hydrogen and the boron as there is no distortion of the orbital. There is no interactions due to the s orbital of the boron being much lower in energy than that of the 3 hydrogens, prohibiting the mixing of the hydrogens and the boron.
It can be seen that the calculated MO results generated from Gauss View are in close agreement with the orbitals produced by the Linear Combinaiton of Atomic Orbitals (LCAO Method). Furthermore it can be seen that the qualitative analysis method of LCAO is fairly accurate with all the of the LCAOs appearing to be of similar shape to the MOs generated.
The first MO, 2a', contains roughly equal contributions from all 3 S orbitals of hydrogens and the s orbital of the boron, as shown. It has the lowest energy of all the orbitals present in the diagram (-1249.79 kJ/mol) due to the presence of no nodes within the molecule. The next orbital, 1e' is double degenerate with an energy of -861.663 kJ/mol, which is much higher in energy than the 2a' molecule. This is due to the presence of a node within the MO, due to the presence of an out of phase interaction between the p orbtial in the centre. The bonding is due to the interactions between a p orbital lobe and a s orbital, of which there are 2 of these type of interactions within each of the degenerate molecular orbitals. There is a further increase in energy as the next molecualr orbital is reached, 1a"2' which has an energy of -230.23 kJ/mol. This molecule is non-bonding due to the presence of no suitable orbital for it to bond with (there is no orbital present with the same symmetry). This is the LUMO of the orbital, thus any other molecule which has a HOMO which is higher in energy will be able to attack and react with the BH3 molecule. The next orbital, 3a'1, no longer has a negative energy with an energy of 114.9706 kJ/mol. This non negative energy is due to the presence of all the nodes within the molecule and the fact that the orbital is an anti-bonding orbital. The final orbital,2e', is a doubly degenerate orbital with an energy of 278.513kJ/mol. This is highest in energy becuase of the presence of the nodes. Furthermore there is little to no attractive forces between orbitals within the molecule.
It must be noted that in the images the bonds do not appear. This is because of how bonds can be viewed: A bond can be formed by the VSEPR approach, in which a bond is formed by placing 2 electrons between 2 atoms. The second is by generating bonds using the molecular orbital approach. The first approach means that if the 2 atoms that are to be bonded come within a certain distance of each other then a bond will form. Within the parameters of Gauss View the distance between the atoms may be too great for the bond to be shown in the image, however it is important to note that this does not mean that the bond is not there. For example in the images of the molecular orbitals there are bonds present, otherwise the molecular orbital will not be generated, but there are not bonds in the pictures.
Overall the MO method produced close values to the LCAO approach, thus proving that the method works. However there are short comings of this approach. One example of this would be in the top 2 energy levels of this MO diagram: the 2e' and the 3a' molecular orbitals. The MO apporach has shown that, according to their energies, they are the correct way around in the diagram above. However these levels could be the other way around: In our case it is shown that the 3a'1 orbital is lower because a1 orbitals are lower in energy than e1 orbitals. However it is possible that the e1 levels will be lower in energy due to the s-s orbital interactions being stronger than s-p interactions.
NBO Analysis of BH3
NBO Analysis was carried out to using the .log file produced from the population analysis (the .log file produced from the MO analysis). "Charge Distribution" was selected and the atoms were changed colours to represent whether they are positively charged,greeen, or negatively charged, red.
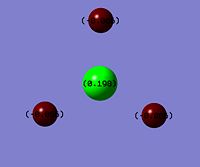
This shows that the boron atom is positively charged which is expected due to it being Lewis Acidic, and the hydrogens appear green.
The NBO, natural bond orbital, method was implemented, by selecting "Full NBO". The log file was opened and analysed:
| Atom | No. | Neutral Charge | Natural Population | |||
| Core | Valence | Rydberg | Total | |||
| B | 1 | 0.19785 | 1.99962 | 2.80253 | 0 | 4.80215 |
| H | 2 | -0.06595 | 0 | 1.06582 | 0.00013 | 1.06595 |
| H | 3 | -0.06595 | 0 | 1.06582 | 0.00013 | 1.06595 |
| H | 4 | -0.06595 | 0 | 1.06582 | 0.00013 | 1.06595 |
From this it can be seen that all 3 hydrogens are equal in their values, making them equivalent. Therefore the symmetry of the molecule is D3h. It can also be noted that the sum of the charges is equal to 0 which reflects the fact that the molecule is neutral.
The .log file can also be used to show other pieces of information about the molecule, for example it is able to show the orbital contributions to the molecular orbitals.

As seen in the file produced there is always a 66.67% contribution from the p orbtial and a 33.33% contribution from the s orbital in the boron, and there is 100% contribution from the s orbital of the hydrogens. This shows that the bonds must be sp2 hybridised due to the 2:1 ratio of the p orbital to the s orbital within the boron. Furthermore it can be seen that the lone pair is present in an s orbital (shown in the log file as 100%).
Further data that can be obtained from the file includes mixing (which in the data file is found under "Second Order Perturbation Theory Analysis of FOCK Matrix in NBO Basis".

This file shows the mixing of both the non-bonding and the anti-bonding orbitals with the bonding molecular orbitals generated.
An NBO Summary can also be obtained from the data file:
This file shows the occupation of the bonds (or lone pair) within the BH3 molecule. From this it is easy to understand therefore, that the first 4 NBO's are filled because these represent the 3 B-H bonds and the lone pair.
Vibrational Analysis
Vibrational Analysis was carried out using the same method and basis set that were used for the optimisation above. The optimisation of the molecule yielded the following results:
| Bond Angle/Degrees | 120.0 |
| Bond Length/Å | 1.19 |
| Charge | 0 |
| Spin | Singlet |
| Total Energy/a.u. | -26.4662 |
| RMS Gradient | 0.0002 |
| Dipole Moment/D | 0 |
| Point Group | C3H |
From this it can be seen that the optimisation for frequency calculation has worked because it has yielded the same results as the previous optimisation. The frequency calculations were run to obtain the vibrations of the molecule:
| Vibrational Number | Mode of vibration | Description [2] | Frequency/cm-1 | IR Intensity | Symmetry D3h Point Group |
|---|---|---|---|---|---|
| 1 | 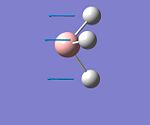 |
Wagging | 1144 | 92 | A2" |
| 2 | 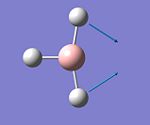 |
Scissoring | 1204 | 12 | E' |
| 3 | 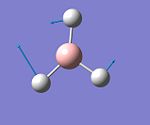 |
Rocking | 1204 | 12 | E' |
| 4 | 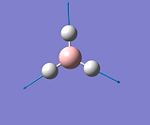 |
Symetric Stretching | 2598 | 0 | A'1 |
| 5 | 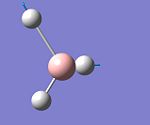 |
Assymetric Stretching | 2737 | 104 | E' |
| 6 | 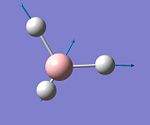 |
Assymetric Stretching | 2737 | 104 | E' |
Please note, the values of the frequencies are given to 4d.p. in the log file, however due to the low accuracy method of the analysis method run, they are quoted to integer values. From the vibration frequency data produced an IR spectrum can be generated.
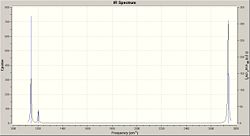
From the spectrum it is possible to see that, despite the presence of 6 vibrational modes within the molecule, there are only 3 peaks visible in the spectrum. This is because vibrational modes number 2 and 3 are at the same frequency, as are the vibrational modes 5 and 6. Thus these will only produce 1 peak as the frequencies are the same and so the spectrun will show both peaks superimposed upon one another. Furthermore there is no peak for vibrational mode 4. This is because during the vibration the molecule remains symmetrical. Thus there is not net charge in the molecule generating no dipole moment, thus the molecule will not be IR active and so will not be detected causing the omission of the peak from the spectra.
Data
Optimisation file: https://www.ch.imperial.ac.uk/wiki/index.php/Image:Data_from_vib_freq_optimisation_bh3.txt
Vibrational Frequency File: https://www.ch.imperial.ac.uk/wiki/index.php/Image:MR607_BH3_FREQ.LOG
BCl3
BCl3 was generated in Gauss View. To enure that the MO calculations, vibrational calculations and optimisation of the molecule worked, the geometry of the molecule was restricted by setting the point group to D3h and setting the tollerance to very tight (0.0001).
BCl3 Optimisation
The optimisation file was created using the B3LYP method. The basis set chosen was LanL2MB. This basis set is a medium level basis set which uses D95V on the first row atoms and Los Alamos ECP on the heavier atoms. These are not the most complex methods that could be used, however they enable the calculations to run relatively fast whilst still being reasonably accurate. The optimised molecule yielded the following data:
| Bond Length/Å | 1.87 |
| Bond Angle/degrees | 120.0 |
| Charge | 0 |
| Spin | Singlet |
| Total Energy/a.u. | -69.4393 |
| RMS Gradient/a.u. | 0.00005 |
| Dipole Moment | 0 |
| Point Group | D3h |
The reaction took 8.0 seconds to run.
From this analysis it can be seen that the bond length is 1.87Å and the bond angle is 120o. These correspond well to the literatrue [3] values of 1.72Å and 119.9o. It can be seen that the bond angle is in better agreement with the literature than the bond lengths. This is likely to be due to the inaccuracy of the basis set and the method that were used and so to overcome this problem more complex methods would have to be used. From these results it can be seen that, due to the bond anlge, the molecule is trigonal planar, similar to the BH3 molecule. This fits well with the set geometry of D3h. It is important to note that, because the geometry of the molecule was constrained to D3h, that the energy minima may only be a local minima and that if the point group of the molecule was not constrained a lower energy minima may be achieved. The ground state configuration was found to be D3h after the optimisation and so this shows that the geometry method used in Gauss View is very exact. The method is so exact because, by defining the geoemetry of the molecule, Gauss View knows which symmetry elements needed to be present in the optimised molecule.
Vibrational Analysis
The vibrational analysis was carried out using the same method and basis set used above. The same basis set and method were used because any data produced would be comparable to the data produced previously in the BH3 vibrational analysis. Furthermore the frequency analysis is the second derivative of the potential energy surface. This potential energy surface depends on which basis set and method are used because if a different method and basis set were used, then a different differential would be produced, thus meaning that the results would not be comparable. Frequency analysis was carried out because it enables determination of whether the minimum energy level achieved is actually the global minimum or whether it is a local minimum.: If all the frequencies are positive then a minimum has been achieved, if frequencies are negative then a transition state has been achieved. It is important to note that many negative frequencies means that the optimisation has failed. This is because a negative value means that a maxima has been reached. Please note that the bonds do appear in this molecule. Gaussview sometimes does not show bonds, and this is explained above. Vibrational analysis yielded the following results:
| Charge | 0 |
| Spin | Singlet |
| Total Energy/a.u. | -69.4393 |
| RMS Gradient/a.u. | 0.00005 |
| Dipole Moment/D | 0 |
| Point Group | D3h |
From this is can be seen that the optimisation produced the same results as the previous optimisation and so the method is still working. The vibrational results were:
| Mode Number | Mode of vibration | Description | Frequency/cm-1 | Literature Value [3] | IR Intensity | Symmetry D3h Point Group |
|---|---|---|---|---|---|---|
| 1 | 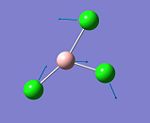 |
Scissoring | 214 | not found | 4 | E' |
| 2 | 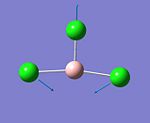 |
Scissoring | 214 | not found | 4 | E' |
| 3 | 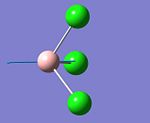 |
Assymetric Stretching | 368 | not found | 44 | A22 |
| 4 | 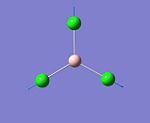 |
Symmetric Stretching | 0 | 0 | 0 | A'1 |
| 5 |  |
Assymetric Stretching | 259 | 260 | 104 | E' |
| 6 |  |
Assymetric Stretching | 259 | 260 | 104 | E' |
From the small number of literature values found it can be seen that the computational results are in good agreement with those achieved experimentally. Similarities between BCl3 and BH3 can be observed, and this is down to them having the same symmetry. Both molecules have 2 degenerate levels.

It can be seen in the IR spectrum, that similarly to BH3, there are peaks missing. These are due to the same reasons as before: degenerate levels are superimposed upon one another and that mode 4 is not IR active due to induced dipole moment.
Data
Optimisation File: https://www.ch.imperial.ac.uk/wiki/index.php/Image:BCl3_Optimisation.LOG
Optimisation File for Vibrational Analysis: https://www.ch.imperial.ac.uk/wiki/index.php/Image:MR607_BCL3_OPT.LOG
Vibrational Analysis File: https://www.ch.imperial.ac.uk/wiki/index.php/Image:MR607_BCL3_FREQ.LOG
Isomers of Mo(CO)4L2
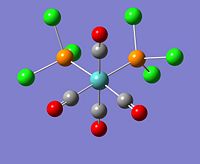
During this section of the report vibrational analysis will be run of the cis and trans isomers of Mo(CO)4L2. These spectra produced will vary because the carbonyl vibrational bands will depend on the symmetry of the molecule. This is because, for a molecule to be IR active, there is a need for a dipole moment. Therefore if the isomer produced does not have these moments, then the vibrational frequency at which the vibration will occur will not appear in the spectrum. Due to the contraints of the computer resources the ligands will be chlorine because phenyl groups will be too bulky and cause calculations to take a lot longer. The molecule will be optimised and the vibrational frequencies will be run to determine their stability, which isomer is more stable and to produce and analyse the spectra to work wut the spectral characteristics of the isomers.
Optimisation
The 2 isomers were drawn in Gauss View and optimised using the B3LYP method and the medium level LanL2MB basis set. Despite this method and basis set being medium level and not so accurate, the method was used to give an approximate geometry of the molecule. The optimisation of the trans isomer took 3 minutes 49 seconds, and the optimisation of the cis isomer took 5 minutes and 13 seconds. The optimisation files produced were [4] [5]altered to ensure that the cis isomer had one Cl pointing up parallel to the axial bond, and one that pointed down. Furthermore the trans isomer was altered to ensure that both of the PCl3 groups were eclipsed and that one Cl of each group lay parallel to one Mo-C bond. This file was then saved and re-optimised with the different LANL2DZ basis set. To increase the convergence "int=ultrafine scf=conver=9" was entered into the additional keyword box. The optimisation for Trans [6] took 21 minutes and 47 seconds and the optimisation file for cis [7] took 33 minutes and 35 seconds (to run. This method produced the optimum geometry of the molecule: (please note that the literature values [8] for the cis isomer are those for the cis-Mo(CO)4(PPh3)2 ligand as these are the closest found. The literature values [9] for the trans isomer were for the PPh3 ligand aswell.
It can be seen that the literature values are in good agreement with the computationally obtained results. The slight differences that are present (for example Mo-P bond length) are due the literature valeus having a more bulky PPh3 ligand than the PCl3 ligand used computationally.
From the results produced it can be seen that the cis isomer, with an energy that is lower than the trans isomer by 2.73kJ/mol, is the most stable. This is because, in the cis isomer, C=O has the ability to back bond to the metal, thus making the bond stronger. In comparison to this, in the trans molecule this back bonding will be in comptetion between the 2 C=O groups as both of the groups will back bond into the same orbital (in the cis isomer they are able to back bond into different orbitals), thus making the molecule less stable due to less backbonding. Furthermore the carbonyl will also draw away electrons from the Mo because of the electronegativity of the oxygen, increasing the trans effect. This will cause the orbitals within the molecule to be more diffuse generating weaker bonds. Moreover, in the cis isomer it can be seen that the PCl3 groups are anti-parallel to one another. This will decrease the steric strain of the molecule because there will be less steric clash between the PCl3 groups. This is in contrast to the cis isomer in which the groups are eclipsed, which will increase steric strain within the molecule.
However it is not only in energy that the isomers differ: In general the cis isomer has larger bond lengths and smaller bond angles. The bond lengths in the cis are longer due to the steric clash between the PCl3 groups. However the C-Cl bond angle in the cis isomer is larger. This is again due to steric clashes within the molecule as a result of having the 2 PCl3 groups on one side of the molecule. Due to the clashes the molecule changes its orientation to minimise these clashes (the cis isomer has PCl3 group anti-parallel to each other) and this causes different C-Cl bond angles in the cis isomer to the trans isomer. A main difference in bond angles in the isomers are the P-Mo-P bond angles, which in the trans isomer is 180o and in the cis 94.1o (literature [8] 94.78o). Steric strain causes deviations from the ideal octahedral geoemtry of the molecule which is why the angle is 94.1o. The angle of 180o shows that the trans isomer does not suffer from the steric strain becuase the groups are evenly distributed around the molybdenum causing less strain.
It should be noted that the energy difference between the 2 isomers is 2.7kJ/mol. At room temperature RT=2.5kJ/mol, and so it is likely that the isomer appears as an equilibrium of the 2 isomers because there is very little difference in the energies. Furthermore due to the inaccuracy of the basis set and method deployed in the calcualtion this value could be smaller and thus be less than RT, meaning that there was little to no difference between the molecules. Having said that it is likely that there will be slightly more of the more stable cis isomer because it is slightly lower in energy.
The aim of the calculation was to model Mo(CO)4(PPh3)2, but due to the bulkiness of the ligands PCl3 groups were used. It is important to note that, according to the literature, the trans form of the PPh3 complex is the most stable. This is because the PPh3 have a much larger steric bulk than the PCL3 groups and so the steric clashes within the molecule will be dramatically increased.
From the above explanation it can be determined that steric bulk and electronic effects of the ligands attached will determine which of the isomers is the lowest in terms of energy. For example, small, sterically unhindered ligands will generate a more stable cis isomer because there will be little to no steric clash due to size. Furthermore large, sterically bulky ligands will cause the trans isomer to be lower in energy because this conformation will minimise steric strain within the molecule. With respect to electronic effects, it is slightly more complex, but it can be generalised that an electron rich group will back bond more, weakening the bonds to the metal by generating more diffuse orbitals and causing the cis isomer to be favoured.
Vibrational Analysis
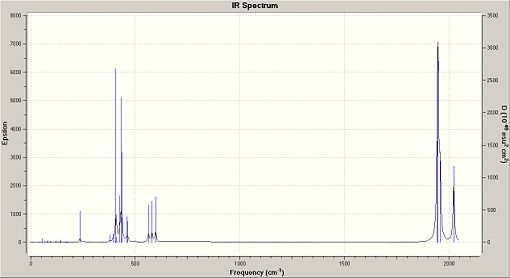
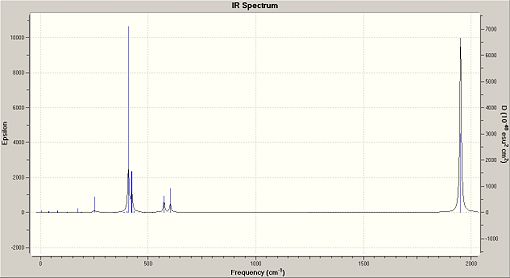
The second optimisation file was taken and altered. The additional keywords were kept the same as in the 2nd optimisation, as was the basis set of LANL2DZ. The frequency analysis of the trans isomer [10] took 16 minutes and 54 seconds. The frequency analysis of the cis isomer [11] took 17 minutes and 8 seconds. All frequencies observed were positive, with the lowest observed frequency at 5cm-1. This means that the optimisation method has reached a global minima and not a local minima. The vibrational analysis produced the following IR spectra for the isomers:
Low Frequency Vibrations
Frequency can be related to energy, using E=hf. This means that in low frequency analysis, that the vibrations of the molecule must occur at low temperatures. This means at room temperature, where the energy is 2.5kJ/mol, that the molecules will be vibrating rapidly. This means that, due to having a large amount of energy, higher vibrational energy levels can be reached, thus the ground state of the molecule does not contain many molecules.[12] This is further enhanced by anharmonicity in which the energy gap between energy levels decreases as you go up in energy levels. Therefore the vibrating molecules will be able to access higher energy levels and so will not necessarliy be visible in the spectra. The low frequency analysis produced the following results:
Trams Isomer
| Mode Number | Frequency/cm-1 | Intensity | Image of Vibration | C1 Symmetry Group |
| 1 | 5 | 0.0941 |  |
A |
| 2 | 6 | 0.0000 | 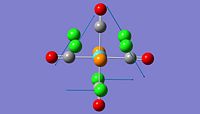 |
A |
Cis Isomer
| Mode Number | Frequency/cm-1 | Intensity | Image of Vibration | C1 Symmetry Group |
| 1 | 11 | 0.0264 | 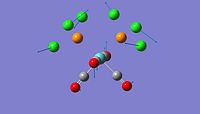 |
A |
| 2 | 18 | 0.0073 |  |
A |
Carbonyl Vibrational Analysis
The main differences between the 2 isomers are visible in their C=O stretches within the IR Spectrum. Please note that the literature [13]for cis values is based on PPh3 ligands and not PCl3. Furthermore the literature for the trans isomer is my own results from the 2nd Year lab experiment. The analysis yielded the following results:
Cis Isomer:
Trans Isomer:
| Mode Number | Frequency | Lit. Frequency | Intensity | C1 Symmetry Group | Image |
| 42 | 1950 | 1897 | 1475 | B2 |  |
| 43 | 1951 | 1908 | 1467 | B1 |  |
These results show that the cis isomer has 4 C=O vibrations present in the IR spectrum with the trans only containing 1, which is as observed in the literature. [14]. Despite the trans having 2 frequencies for the C=O they only appear as one for many different reasons: The Frequencies are very close together and the resolution of the machine will only show them as one. The symmetry of the molecule is D4h, and so the molecule is highly symmetrical. It can be seen in the images that the 2 vibrations are the same, with one of the C-Mo bond lengths decreasing whilst one increases. This is the same for both stretches and so the signal will only be observed as one peak. In contrast, the cis molecule has a lower symmetry and is C2v.
Although not shown in the table the trans does have vibrations at mode number 44 and 45, however they are of low intesity and also are not IR active because the vibrations do not cause a dipole moment and so will not be seen in the spectrum. This shows one advantage of computational chemistry: the ability to generate vibrations which would not be identified by looking at the experimental spectrum produced.
Summary
From the vibrational analysis it was concluded that the most stable isomer was cis. However, as said previously, the PCl3 ligands were used to model the behaviour of the PPh3 ligand. Therefore, in accordance to the literature, the trans isomer (when using PPh3 ligands) is the most stable. This is for many reasons: The trans isomer will decrease steric clashes between the bulky triphenylphopshine groups. Furthermore the trans isomer will have a lower dipole moment than the cis because the 2 groups will cancel each other out because they are on opposite sides of the molecule. A smaller dipole leads to the more stable isomer and in this case that will be the trans. This could also be shown by the melting points of the molecule, of which the literature value for the cis is 210-220o and for the trans is 278-280o. This shows that the trans complex is more stable. Another way to show that the trans is more stable could be to measure the time needed to synthesise the isomers: To generate the trans isomer the reaction only takes a 15 minute reflux, but to produce the cis isomer it requires a 30 minute reflux [15] .
Mini Project
Introduction


Ambiphilicty is the ability of a molecule to act as a nucleophile and an electrophile. In the case of Silicon the lone pair acts as the nucleophile and the empty pz orbital acts as the electrophile in which electrons can be donated, shown in the schematic to the side. The stability of these compounds was rationalsied [16]by a strong interaction between the vacant Pz orbital of the Si atom and the filled nitrogen orbitals (in particular the s orbital containing the lone pair. The aim of this mini project can be divided in to 2 sections: A Sterics Investigation and an Electronics Investigation. The project was carried out on the general 5 membered cyclic structure shown left. In the Steric Investigation the steric bulk of the atoms replacing the H atoms will be measured whilst the non-metal placed in the molecule is Si. In the Electronics Investigation atom M is replaced with Carbon (to produce carbenes), Silicon (silyenes), and Germanium (Germylenes).
Steric Investigation
The aim of this section is to investigate the effect of increasing the steric bulk of the groups (replacing H) on the ambiphilicity of the Silylene. The following molecules were investigated:

The groups to be investigated are H (molecule 1), Me (molecule 2), iPr (molecule 3) and tBu (molecule 4), which are in order of increased steric bulk. The anticipated outcome of the investigation is that as the steric bulk of the group attached is increased, the ability of the molecule to act as an electrophile will decrease, decreasing the ambiphilicity, but increasing the ability of the molecule to act as a nucleophile. This is because the the Pz will be more sterically hindered as it will be blocked by the bulky groups and so will not be able to be attacked by a nucleophile. Furthermore, in terms of electronics, the bulkier groups will be able to donate more electrons the the ring, which in turn will fill the pz orbital, decreasing its ability to act as an electrophile. It is important to note that there are stong interactions between the vacant silicon orbitals and the nitrogen orbitals. This interaction may decrease the ability of the Pz orbital to act as an electrophile to begin with as the pz orbital will already contain some electron density. Within this investigation the molecules will be optimised, an NBO analysis will be run as well as MO and Vibrational Analyses.
Molecule 1

The molecule was drawn in ChemBio 3D and optimised using the MM2 method, yielding a total energy of 10.73kcal/mol. This basically optimised molecule was saved and imported into GaussView 5. This molecule was optimised using the B3LYP method and the 3-21G basis set. The calculation took 1 minute and 53 seconds and produced the following optimisation:
| Calculation Method | B3LYP |
| Basis Set | 3-21G |
| Charge | 0 |
| Spin | Singlet |
| Total Energy/a.u. | -475.1134 |
| RMS Gradient /a.u. | 0.000032 |
| Dipole Moment | 2.31 |
| Point Group | CS |


From this optimisation both a triplet and a singlet scan was run using the 6-331+G (d,p) basis set (chosen as it was used in the literature [17] )to determine whether the triplet or singlet state form of the molecule was lower in energy. This basis set used is more accurate and took 2 minutes and 6 seconds (for the singlet) and 1 minute and 38 seconds (for the triplet) to run. It was observed in the output files for both the singlet and triplet states that the energy had to converged. These optimisations [18] [19] yielded the following results:


| Singlet | Triplet | |
| N-Si Bond Length/A | 1.80 | 1.80 |
| N-C Bond Length/A | 1.39 | 1.39 |
| N-Si-N Bond Angle/Degrees | 84.3 | 84.3 |
| N-C-C Bond Angle/Degrees | 112.3 | 112.3 |
| Si-C-N Bond Angle/Degrees | 115.5 | 115.5 |
| Calculation Method | B3LYP | B3LYP |
| Basis Set | 6-311G(d,p) | 6-311G(d,p) |
| Charge | 0 | 0 |
| Spin | Singlet | Triplet |
| Total Energy/a.u. | -477.7167 | -475.0082 |
| RMS Gradient /a.u. | 0.000097 | 0.000142 |
| Dipole Moment/D | 1.8 | 4.2 |
| Point Group | CS | CS |
The optimisation graph shows that the method took 4 cycles to optimise the molecule, starting with a big decrease in energy as the molecule is initially optimised and decreasing in energy as the structure is fine tuned to its optimum. The RMS graph shows that there is only a small deviation between the desired structure and the actual optimised structure as the root mean squared ends up at a small value.
As the table shows the more stable molecule is the singlet. This is also what is found in the literature [20], which states that there are only a few triplet state silylene complexes. It can be seen in the triplet and singlet molecules that there is delocalisation over the molecule. This molecule is Huckel aromatic (4n+2 pi electrons), which includes the lone pairs on the nitrogens. It is shown above that this delocalisation is present in both the triplet and singlet states because all the bond angles and bond lengths are the same in both the singlet and triplet states.
The delocalisation can be rationalised by the literature [21] :C-N bond length is 1.47AÅ and a C=N bond length is 1.27AÅ and the CN bond length in the molecule is in between the single and double bonds, suggesting delocalisation in the molecule.
From this it may be seen that this delocalisation could mean that there is less availability of the Silicon Pz orbital in which the nucleophile can attack, which makes the molecule less electrophilic.
The presence of the N lone pair is what stabilises the molecules. The N lone pair is orientated in a p type orbital, which is correctly orientated to overlap with the Pz of silicon which is perpendicular to the plane of the molecule. This causes a decrease in the electron deficiency of the Lewis Acidic Silicon atom. This decreases the electrophilicity of the silicon but stabilises the molecule.
As it was seen that the singlet state of the molecule was the most stable, further calculations were run using the minimised singlet log file.
A populational analysis was run using the same method and basis set (B3LYP and 6-311G (d,p)). The MO calculation took 17 seconds to run and yielded the following results [22]:
 |
 |
 |
 |
 |
 |
 |
 |
 |
 |
These generated molecular orbitals can help explain what is stated above: that the lone pair of the silicon is declocalised into the ring to form a huckel aromatic system. This is best shown in the HOMO-4 which shows electron density completely spread evenly over the whole molecule. This delocalisation can also be seen to a certain extent in LUMO+2, however in this molecular obrital the silicon is not included in the delocalised electron denisty enabling it to act as an electrophile and accept electron density from an incoming nucleophile. Moreover the molecular orbitals can show the ambiphilicity of the silicon. The nucleophilicity of the silicon is best shown in the LUMO in which there is a large areas of electron density over the silicon atom which means that the molecule is able to act as a nucleophile. A large electron cloud over the silicon is also present in the HOMO-1 which also would enable the molecule to act as a nucleophile and to attack to another molecule, should the alignment of orbital energy be correct. The electrophilicity of the Silicon atom can be shown in the LUMO+2 and the HOMO-2. The HOMO-2 shows that the silicon orbitals are not used to hold electron density and therefore leaves an empty pz orbital into which the electrons can be transferred. The best example for the availability of the silicon to act as an electrophile is the LUMO+2: there is no electron density over the silicon and furthermore the molecular orbital is empty and so can accept electrons from the attacking nucleophile.
The ability of the molecule to be ambiphilic is also explained computationaly with the use of Natural Bond Order (NBO) Analysis. The NBO analysis was carried out using the output file from the MO analysis.

The NBO produced a pictoral representation of charge distribution, which shows that as expected, the silicon is Lewis Acidic with an electron deficiency, shown in the diagram as green. Furthermore it shows the electron rich nitrogens as red, as well as the neutral carbons opposite the silicon in the molecule, dark in colour as they are half way between the green lewis acidity and the electron rich red. The numbers seen on the molecules are given in the NBO analysis as the "Summary of Natural Population Analysis"

This shows that the silicon is positively charged at 0.87, the nitrogens are negatively charged (-0.98), the carbons are slightly negative but almost neutral (0.05). Furthermore it shows that there are 2 types of hydrogens within the molecule: those with a charge of 0.40 are attached to the nitrogens and those at 0.20 are those attached to the carbons. The hydrogens attached to the nitrogens are more positive because the nitrogen is slightly electron withdrawing, thus removing some electron density from the hydrogens making them more positive. The NBO analysis also produces the degree of contribution of the elements to the bonding within the molecule, found under "Bond Orbital/Coefficients/Hybrids". This section contained 122 occupancies. Number 12 is a C-N bond. This contained an 86% contribution to the bond from nitrogen, which itself was made up from 36% s character and 64% p character (sp2 in character). The remainder was from carbon, itself made up from 30% s character and 70% p character. This shows that the bond is mainly made up from the nitrogen p orbtial which is likely to be the lone pair, suggesting the delocalisation of the lone pair over the bond. Another interesting entry is number 8 which shows a N-Si bond. This bond compromises of a 84% contribution from the nitrogen (made up for 37% s character and 64% p) and 16% Silicon. The Silicon contribution not only involves the s and p character, 12% and 87% respectively, but also contains a 1% contribution from the silicon d orbitals. These will be able to take part in the bonding due to the low energy of the orbitals. Further analysis can be carried out by looking at entry number 22: the lone pair of silicon. The lone pair is held in an orbital which is 78% s character and 22% p character. This shows that the orbital is roughly s in character which is as expected from the literature [23] [24].
| Energy/kcal | Donor | Acceptor |
| 26.15 | N3-Si9 π | C1-C2 π* |
| 33.78 | N4 lone pair in s | C1-C2 π* |
| 22.54 | N5 lone pair in s | N3-Si9 π* |

The Natural Bond Order Summary the occupancy of the pz orbital of the molecule can be analysed, enabling the electrophilicity of the molecule (and therefore the ambiphilicty of the molecule) to de deduced. The pz can be seen to have an occupancy of 0.502 showing that there is electron density in the orbital but it is still capable of accepting electrons from an attacking nucleophile, making it electrophilic. The orbital already contains electron density because the nitrogen lone pair interacts with the empty pz orbital because they are correctly aligned. The second order perturbation section can give information about the bonding in the orbital. It can be observed that there are 3 E2 enrgies that are ovoer 20kcal. An energy of 20 kcal or more indicates that there is electron donation from an full orbital into an empty orbital. These donations are tabulated to the right, and show the delocalisation of electron over the molecule.
Vibrational Analysis was also carried out on the molecule. The same basis set and method was used (B3LYP and 6-311G(d,p)) with the selection of frequency analysis and the addition of "pop=(full, nbo)" into the Keywords section. The results [25] took 1 minute and 19 seconds to run, and are shown below:

The IR data obtained provides further indication that there is delocalised charged over the molecule: A standard C=C stretch in an IR is at 1620-1680 cm-1. However the C=C within the IR of this molecule is at a lower frequency of 1602cm-1, showing the lower energy of the carbons brought about by the delocalisation, closer to the literature value for a C-C arene stretch which is 1500-1600cm-1 [26]. This lowering of energy by delocalisation over the molecule is also shown in the NH stretch, present in the calculated spectrum at 3633 cm-1, with a normal N-H IR stretch at 3700cm-1. The molecule also contains 3 modes which have intensity of 0. These are modes 2, at 554cm-1, 4, at 623cm-1, and 9, 839cm-1. Mode 4 corresponds to a rocking vibration in which half of the molecule moves upwards and half of the molecule moves downward. However this vibration does not lead to the formation of a dipole moment and so is not IR active and so does not appear in the spectrum. Mode 2 is a twisting vibration in which half of the molecle twists up and half twists down. This is similar to vibraiton 4 and again does not generate a dipole moment within the molecule. Mode 9 is a twisting vibration in which a CH group moves up and a CH group moves down, again similar to vibrations 2 and 4 and in the same manor does not appear in the spectrum due to no dipole moment being induced in the molecule.The Si-N bond is present in the IR at 379cm-1 compared to the literarture value of 229cm-1. The delocalisation in the ring causes the value of the bond to be different to the expected literature [27] values.
Molecule 2

In molecule 2 the hydrogens attached to nitrogen in molecule 1 are replaced with Me groups. The molecule was drawn in ChemBio 3D and optimised using the MM2 method, yielding a total energy of 17.70kcal/mol. This basically optimised molecule was saved, imported into GaussView 5 and optimised using the B3LYP method and the 3-21G basis set. The calculation took 9 minutes and 48 seconds. The results file was then optimised for both the singlet and triplet states in order to determine which was more stable. The singlet took 8 minutes and 22 seconds, and the triplet took 24 minutes and 27 seconds to run. All optimisations converged.The optimisations yielded the following results [28] [29]:
| Singlet | Triplet | ||
| Calculation Method | B3LYP | B3LYP | B3LYP |
| Basis Set | 3-21G | 6-311G(d,p) | 6-311G(d,p) |
| N-Si Bond Length/A | 1.8 | 1.81 | 1.81 |
| N-C Bond Length/A | 1.27 | 1.39 | 1.39 |
| N-Si-N Bond Angle/Degrees | 85.8 | 85.4 | 85.4 |
| N-C-C Bond Angle/Degrees | 115.6 | 113.1 | 113.1 |
| Si-N-C Bond Angle/Degrees | 111.5 | 114.2 | 114.2 |
| Charge | 0 | 0 | 0 |
| Spin | Singlet | Singlet | Triplet |
| Total Energy/a.u. | -553.30 | -556.3480 | -556.2568 |
| RMS Gradient | 0.000012 | 0.000084 | 0.000029 |
| Dipole Moment/D | 2.2 | 1.7 | 3.7 |
| Point Group | C1 | C1 | C1 |
From these optimisations it can be seen that the singlet molecule is more stable, similar to molecule 1 and as expected from the literature. Molecules with small dipole moments tend to be lower in energy and so more stable, and the singlet molecule has a smaller dipole moment and so is more stable. It can be seen that the enegy of molecule 2 is lower than that of molecule 1 (-556.35a.u. compared to -475.11a.u.) This is because the Me group is more electron donating than the hydrogens and so can donate electron density into the delocalised system, thus decreasing the energy of the molecule. Further differences can be seen in bond length and angles: The N-Si bond length in molecule 2 is slightly longer. Furthermore the N-Si-N bond angles are smaller which can be related to the N-Si and N-C bond lengths: The N-C bond lengths are the same length in both molecules, but the N-Si increases thus having the effect of moving the Si away from the molecule, which will cause a decrease in the bond angle because all of the other atoms in the ring remain in the same place. This decrease in bond angle again suggests that the Si is less involved with the delocalised system because it is not as close and so the electrons will not interact as much. This will increase the nucleophilicity of the molcule because the lone pair on the silicon will be more free than in molecule 1. The N-C-C and C-N-C bond angles are smaller which suggests that there is less interaction between the Nitrogen lone pairs and the empty pz of the Si, which will increase the electrophilicity of the molecule because there will be less electron density in the pz and so it can accept electron density from an attacking nucleophile. Molecular Orbital analysis was carried out on the molecule, using the same basis set and method as shown above in molecule 1. The scan took 36 seconds to run and produced the following results [30]:
 |
 |
 |
 |
 |
 |
 |
 |
 |
 |
Delocalisation of the electrons is best shown in the LUMO+3, HOMO, and HOMO-4. All of these, especially the HOMO-4, show large electron clouds over the entire molecule. The nucleophilicity of the silylene depends on many things, including the extent of the pi delocalisation [31] , and therefore this delocalisation will increase the ability of the silylene to act as a nucleophile. The large electron cloud over the silicon in the HOMO and the HOMO -1 also show that the molecule would be a good nucleophile because of the ability of the electron cloud (and subsequently the electrons within it) to attack an electophile, assuming that it is correctly alligned and at the correct energy. The ability of the molecule to act as an electrophile is best shown in the LUMO+2 where there is no electron cloud over the silicon and therefore this is where a nucleophile will attack.
A Natural Bond Order analysis was carried out to produce the charge distribution and to analyse the amount of electron density within orbitals for interest, especially the Pz of the Silicon into which the electrons from the attacking nucleophile will attack, and where electron density from the delocalisation over the ring will also be present.

The pictoral representation of the charge distibution shows that, as expected, the Silicon is green and positively charged (due to the empty pz orbital) and the nitrogens appear red in colour as they are negatively charged due to the presence of their lone pair and the ability to withdraw electrons due to them being slightly electronegative. It can be seen that in molecule 2 the silicon is less positive than in molecule and that the nitrogens are less negative than in molecule 1. As the silicon is less positive it means it is less electrophilic. The decrease in negative charge of the nitrogens suggests that there is a greater extent of delocalisation over the molecule with less charge present on the nitrogen, and this will mean more electron density at the silicon which will make it less electrophilic and more nucleophilic. More in depth analysis on the NBO was carried out: The Popoulation Summary showed the charge distribution in more analysis.

This shows a positively charged silicon, and negatively charged nitrogens, which is to be expected. The "Bond Orbitals/Coefficients/Hybrid" Section of the file can be anaylsed to work out the degree of contribution of each atom to the bonds: It can be seen that there are not many diffrerences between the NBO for molecule 1 and the NBO for molecule 2. The orbital containing the silicon lone pair is still s in character (79% s and 21 %p), but has slightly more (1%) s character. This suggests that the silicon is not invloved in the delocalisaiton of the ring as much because if it was the orbital would be more distorted from s character. The N-Si bond is still roughly the same in character with 85% contribution from N (32% s character, 68 p character) and a 15 % Si contribution (12% s character, 87% p character and 1% d character), which is only a slight increase in contribution from the nitrogen compared with molecule 1. From the Natural Bond Order Summary the occupancy of the pz orbital of the molecule can be analysed, enabling the electrophilicity of the molecule (and therefore the ambiphilicty of the molecule) to be deduced. The pz can be seen to have an occupancy of 0.535 showing that there is electron density in the orbital but it is still capable of accepting electrons from an attacking nucleophile, making it electrophilic. In is important to note that there is greater electron density in this orbital than there is in molecule 1. This is because the ME groups are weakly electron donating, pushing electrons into the delocalised ring system which will place more elecron density into the pz orbital. The second order perturbation section can give infromation about the bonding in the orbital. It can be observed that there are 3 E2 energies that are over 20kcal. An energy of 20 kcal or more indicates that there is electron donation from an full orbital into an empty orbital and this can be used to prove the aromaticity of the molecule. These donations are tabulated below:
| Energy/kcal | Donor | Acceptor |
| 27.27 | N3-Si4 π | C1-C2 π* |
| 35.55 | N5 lone pair in s | C1-C2 π* |
| 21.53 | N5 lone pair in s | N3-Si9 π* |

Frequency analysis was carried out using the same method, basis set and keywords as for molecule 1. The scan took 4 minutes and 25 seconds and the following results were produced [32]:

From this analysis it can be seen that there are far more vibrations in molecule 2, which is to be expected as there are more atoms. However there are also more vibrations that do not appear on the spectrum, i.e. they have an intensity of 0. This is again due to the extra CH3 attached to the moelcules. Molecule 1 had 3 vibrations with an intenisty of 0 whereas molecule 2 has 7. In molecule 2 mode 4 has an intensity of zero and is a twisting vibration which is also present as mode 2 in molecule 1. Mode 14 in molecule 2 corresponds to mode 4 in molecule 1 and is a twisting vibration. Finally mode 34 in molecule 2 corresponds to mode 9 in molecule 1 and is an assymteric stretch. There are also 4 more zero intensity vibrations in molecule 2: mode 9, at 587cm-1, mode 17, at 1139 cm-1, mode 27, at 1490cm-1 and mode 2, at 152cm-1, which all correspond to different twisting vibrations within the molecule. None of the zero intensity vibrations appear because during any of these vibrations no dipole is generated and so the vibration is not IR active. A lot of the twisting vibrations do got generate a dipole because of the symmetry of the molecule: for example 1 CH3 could rotate one way and the other the other, and this will cause no net dipole to be generated. A big difference in the spectra of molecules 1 and 2 are in the higher energy vibrations, for example molecule 2 has no vibrations in the 3600cm-1 region. This is becuase there is no longer a N-H stretch, but instead has a N-C stretch which is present in the much lower region of 1180-1360cm-1. This corresponds to the large peak at 1207cm-1. Similar to molecule 1 the stabilisation of the molecule, caused by delocalisation, can be shown by the C=C stretch, which is at a lower than expected energy of 1508cm-1 compared to the 1602cm-1 of molecule 1 which are both smaller than the expected values of C=C bonds which are at 1620-1680cm-1. The Si-N stretch appears at 300cm-1, lower than molecule 1, and closer to the literature value of 229cm-1. This is becuase in molecule 2 the silicon, as shown in MO analysis, is contained less within the the delocalised ring so the bond is weaker lowering the energy of the vibration.
Molecule 3

In molecule 3 the hydrogens attached to nitrogen in molecule 1 are replaced with iPr groups. The molecule was drawn in ChemBio 3D and optimised using the MM2 method, yielding a total energy of 21.11kcal/mol. This basically optimised molecule was saved, imported into GaussView 5 and optimised using the B3LYP method and the 3-21G basis set. The calculation [33] took 6 minutes and 21 seconds. The resulting file was then optimised for both the singlet and triplet states in order to determine which was more stable. The singlet took 1 hour 2 minutes and 27 seconds, and the triplet took 4hours 17 minutes and 17 seconds to run. All optimisations converged.The optimisations yielded the following results [34] [35]:
| Singlet | Triplet | ||
| Calculation Method | B3LYP | B3LYP | B3LYP |
| Basis Set | 3-21G | 6-311G(d,p) | 6-311G(d,p) |
| N-Si Bond Length/A | 1.82 | 1.79 | 1.98 |
| N-C Bond Length/A | 1.39 | 1.39 | 1.33 |
| N-Si-N Bond Angle/Degrees | 85.6 | 86.8 | 81.9 |
| N-C-C Bond Angle/Degrees | 113.6 | 113.6 | 116.6 |
| Si-N-C Bond Angle/Degrees | 114.3 | 113.8 | 112.2 |
| Charge | 0 | 0 | 0 |
| Spin | Singlet | Singlet | Triplet |
| Total Energy/a.u. | -709.71 | -713.7518 | -713.8508 |
| RMS Gradient/a.u. | 0.000008 | 0.000041 | 0.000018 |
| Dipole Moment/D | 2.13 | 1.61 | 3.4 |
| Point Group | C1 | C1 | C1 |
These results show that the singlet molecule is the most stable, however only slightly, and the destability in the triplet is likely to have been caused by the larger dipole moment which will move the iPr groups closer to one another and therefore increase steric clashes increasing the energy.
It can be seen from the data that he N-Si bond lengths is decreased and that the N-Si-N bond angle increases. The N-Si-N bond angle increases because the N-Si bond length decreases which will cause the silicon to be closer into the ring, causing the bond angle to increase.
This is similar to both molecule 1 and 2 where as you increase the size of the substituent, the N-Si bond length decreases, the N-Si-N bond angle increases, the Si-N-C bond angles decrease and the N-C bond lengths and N-C-C bond angles stay the same. These changes show that the silicon is moving closer into the ring, suggesting tha the pz orbital is being used to hold more electron density from the delocalsied ring. MO analysis was run using the same basis set, method and keywords as shown in molecule 1. The results took 4 minutes and 28 seconds to run and generated the results [36] below:
 |
 |
 |
 |
 |
 |
 |
 |
 |
 |
From the obtained computational results it is possible to see the delocalisation over the molecule, shown by the bond length of the C-N which is between a single C-N and C=N bond. This delocalisation is best shown in the HOMO-4 in which there are 2 electron clouds one above and one below the molecule. However it can be seen that, compared to molecule 1, the delocalisation is less, with the Silicon only being partially covered in molecule 3 but fully covered in molecule 1. This trend continues and it can be seen in molecule 4 that there is no electron density over the silicon. The ambiphilicity can also be shown: The molecule is able to act as a nucleophile when there is electron denisty over the silicon, because the silicon lone pair is what attacks an incoming electrophile. This is best shown in the LUMO, HOMO and HOMO-1 in which there is a large amount of electron density over the silicon. The molecule is able to act as an electrophile and accept electron density when there is no electron denisty, which is shown in the LUMO and the LUMO+3. Charge distribution and NBO Analysis were carried out:

This shows that the negative nitrogens are red and the lewis acidic positive silicon is green. Further analysis can be carried out by looking at the summary of natural bond order:

This shows that the nitrogen is negative and that the silicon is positive, as expected. Further analysis can be carried out by looking at the "Bond Order/Coefficients/Hybrids". This shows that the silicon lone pair is found in the same state is in the other 3 molecules: 78% s character and 22% p character. By analysing the Natural Bond Order Summary the occupancy of the pz orbital of the molecule can be deduced, and this will enable the electrophilicity of the molecule (and therefore the ambiphilicty of the molecule) to be deduced. The pz can be seen to have an occupancy of 0.540 showing that there is electron density in the orbital but it is still capable of accepting electrons from an attacking nucleophile, making it electrophilic. The second order perturbation section can give information about the bonding in the orbital. It can be observed that there are 3 E2 enrgies that are over 20kcal. An energy of 20 kcal or more indicateds that there is electron donation from an full orbital into an empty orbital showing delocalisation over the molecule. These donations are tabulated below:
| Energy/kcal | Donor | Acceptor |
| 26.60 | N3-Si4 π | C1-C2 π* |
| 35.56 | N5 lone pair in s | C1-C2 π* |
| 21.98 | N5 lone pair in s | N3-Si4 π* |

Please note that the numbering of the molecule is shown in the image to the left. From this it can be seen that there is mass delocalisation over the molecule, which is reflected in the MO images and the bond lengths in the molecule.
Vibrational Analysis was also carried out on the molecule, taking 37 minutes and 56 seconds and producing the following results [37]:

From the results produced it can be seen that the molecule is delocalised. The C=C bond stretch is at 1502 cm-1, much lower than 1600cm-1, but at roughly the same frequency as molecules 1,2, and 4. This suggests that there is delocalisation in all of the molecules and this can be seen in the MO analysis for all of the molecules. The Si-N stretch is found at 278cm-1 compared to the literature value of 229cm-1. This value is at a lower frequency than molecules 1 and 2 but at a higher frequency than molecule 4. This is because, as shown in the MO analysis, as you increase the size of the group on the nitrogen, the delocalisation over the ring decreases from completely covering the Silicon in molecule 1 to having no electron density over the Si in molecule 4. As there is less electron density at the Si, fewer electrons will be in the Si-N bonds and this will cause a Si-N stretch at lower frequencies as the bond will be weaker.
Molecule 4

In molecule 4 the hydrogens attached to nitrogen in molecule 1 are replaced with tBu groups. The molecule was drawn in ChemBio 3D and optimised using the MM2 method, yielding a total energy of 25.64kcal/mol. This basically optimised molecule was saved, imported into GaussView 5 and optimised using the B3LYP method and the 3-21G basis set. The calculation [38] took 2 minutes and 55 seconds. The results file was then optimised for both the singlet and triplet states in order to determine which was more stable. The singlet took 1 hour 52 minutes and 41 seconds, and the triplet took 3 hours 17 minutes and 18 seconds to run. All optimisations converged.The optimisations yielded the following results [39] [40] :
| Singlet | Triplet | ||
| Calculation Method | B3LYP | B3LYP | B3LYP |
| Basis Set | 3-21G | 6-311G(d,p) | 6-311G(d,p) |
| N-Si Bond Length/A | 1.82 | 1.79 | 1.79 |
| N-C Bond Length/A | 1.40 | 1.39 | 1.39 |
| N-Si-N Bond Angle/Degrees | 86.0 | 87.4 | 86.8 |
| N-C-C Bond Angle/Degrees | 113.7 | 113.7 | 113.6 |
| Si-N-C Bond Angle/Degrees | 113.3 | 112.6 | 113.8 |
| Charge | 0 | 0 | 0 |
| Spin | Singlet | Singlet | Triplet |
| Total Energy/a.u. | -787.92 | -792.2971 | -713.6519 |
| RMS Gradient/a.u. | 0.000017 | 0.000011 | 0.000041 |
| Dipole Moment/D | 1.9 | 1.48 | 1.61 |
| Point Group | C1 | C1 | C1 |
These results show, again, that the singlet is the most stable molecule. However the difference in energies between the triplet and singlet is much larger for molecule 4 than for molecules 1 and 2, but the differences in the dipole moment is smaller. This is because the tBu groups are large and sterically bulky and in the triplet the larger dipole moment will move these sterically bulky groups closer together and this will cause a big increase in the energy of the molecule.

It can be seen that the N-Si bond lengths are smaller than for molecules 1,2 and 3. This means that the silicon is even closer to the nitrogen, shown in the N-Si-N bond angle which is larger than for molecules 1 and 3. This means that the silicon will have more delocalised electron density within the molecule which will decrease the ability of the molecule to act as an electrophile, but increases the ability if the molecule to act as a nucleophile, decreasing the ambiphilicity of the molecule. Both the singlet and triplet states have the same bond lengths and bond angles, which is evidence of the delocalisation being present over both the singlet and tripet molecules. The delocalisation is shown to be present because a standard C-N bond length is 1.47Å but in molecule 4 the C-N bond length is 1.39Å. Molecular Orbital Analysis was carried out using the same method and basis set as the previous molecules (B3LYP and 6-311G (d,p)). The results [41] generated took 7 minutes and 38 seconds, and are shown below:
 |
 |
 |
 |
 |
 |
 |
 |
 |
 |
From the MO's it is possible to see how the molecule will be ambiphilic: The HOMO, HOMO-1 and the LUMO all have large electron clouds over the silicon atom, which would be capable of attacking as a nucleophile (if what it attacks is of the correct enegy and symmetry alignment). It should be noted that the LUMO is the almost the same for all of the molecules 1-4 with all of them having the electron density in an arc shape of the silicon. The ability of the molecule to act as an electrophile is shown best in the LUMO+2 which has no electron density over the silicon at all. The MOs can also show the delocalisation in the molecule, illustrated well in the LUMO+2 and even better in the HOMO-4. Similar to the LUMO, the HOMO-4 is almost identical for all 4 molecules, with complete electron delocalisation over the molecule. However it can be seen that the delocalisation does not include the silicon (there is no electron cloud over it). Closer analysis shows that as you go from molecule 1 to 2 to 3 to 4 the silicon becomes covered in less and less electron cloud. This is because the steric bulk of the groups attached to the nitrogens increases and stops the silicon being tightly involved in the cyclic system. The MO file was used to carry out charge distribution and NBO Analysis:

As expected, similar to all the other molecules, the Si is lewis acidic and shown in green. The nitrogens appear red as they are negatively charged, and the carbons are dark in colour as they are roughly neutral. This is shown in the "Summary of Natural Bond Order" section of the file:

It can be seen that, the same as molecule 1,2, and 3, the N-Si bond is made up of 86% N (32% S character, 68% p character) and 14.5% Si (12.5% s character, 87% p character and 1% d character). This is the same as the molecules before. Similarly the Si lone pair is 78% s character and 22 % p character, like in molecules 1 ,2 and 3. The Natural Bond Order Summary can describe the occupancy of the pz orbital of the molecule, enabling the electrophilicity of the molecule (and therefore the ambiphilicty of the molecule) can de deduced. The pz can be seen to have an occupancy of 0.534 showing that there is electron density in the orbital but it is still capable of accepting electrons from an attacking nucleophile, making it electrophilic. The second order perturbation section can give information about the bonding in the orbital. It can be observed that there are 3 E2 energies that are over 20kcal. An energy of 20 kcal or more indicates electron donation from an full orbital into an empty orbital. These donations are tabulated below:
| Energy/kcal | Donor | Acceptor |
| 26.59 | N3-Si4 π | C1-C2 π* |
| 34.84 | N5 lone pair in s | C1-C2 π* |
| 22.53 | N5 lone pair in s | N3-Si4 π* |

Vibrational Analysis was also carried out on the molecule, using the same basis set, method and key words as in molecules 1-3. The calculation took 7 minutes and 38 seconds and yielded the following results [42]:

From this it can be seen that there are more peaks than the previous molecules and this is due to there being more atoms in the molecule than in the previous molecules which will increase the number of IR active vibrations and so increase the number of lines. However it also increases the number of IR inactive stretches, i.e. vibrations that do not have a dipole moment and so do not appear in the spectruma and have an intensity of zero. In molecule 4 there are 15 zero intensity vibrations, more than in molciles 1-3. The C=C stretch, located at 1518cm-1 is much lower than the expected C=C bond frequency which is at much higher at 1612 cm-1 [43]. This is because the pi bond has lost electron density to the delocalised ring, thus weakening the bond and therefore decreasing the frequency of the vibration. The Si-N bond is present at 248cm-1 which is higher than the literature value of 229cm-1. However the Si-N stretch is lower than for moelcule 1-3. This reflects what the MOs have shown: In the HOMO-4 there is delocalisation over the complete molecule. As you increased the size of the groups attached to the N the delocalisation over the molecule decreases eventually leading the the HOMO-4 in molecule 4 having no delocalisation of the silicon. This means that there will be less electron denisty in the silion-nitrogen bond which will mean that the bond is weaker, therefore appearing at lower frequencies.
Summary of Steric Investigation
Overall it can be seen that no matter what size the group attached to the nitrogen is, the most stable state of the molecule is the singlet, as expected from the literature. It can be seen from this investigation that steric effects do play a part on influencing the ambiphilicity of the molecule. It is seen that the ring system is aromatic with delocalised electrons over the molecule. With respect to delocalisation, by increasing the steric bulk of the groups attached to the nitrogens, the delocalisation over the silicon ring decreases (shown in the HOMO-4 of the molecules). This means that the lone pair in the silicon is more able to attack as a nucleophile because it is not interacting with the electron cloud as much. Therefore the delocalisation effects the nucleophilicity of the molecule. From the frequency analysis it can be seen that the Si-N vibration frequency decreases as the steric bulk of the group increases. This can be attributed to the delocalisation over the molecule. As previously stated the delocalisation over the molecule decreases to stop including the Si. This will mean that there is less electron density in the Si-N bond and so the bond will be weaker, leading to a lower frequency peak. The electrophilicity of the molecule can be seen in the pz orbital occupancy. In general the bulkier the substituent the more occupied the pz orbital. This is because more electron density will be donated from the alkyl groups to the nitrogen and hence the ring. This will cause more electron density to be placed in the pz orbital. This will cause a decrease in the electrophilicity. According to the literature [44] the nucleophilicity depends on the extent of delocalisation and that an increase in nucleophilicity will cause a decrease in electrophilicity. This is shown in this investigation, with more electron density in the pz causing the molecule to be less electrophilic and the Si to be more nucleophilic as there is a larger electron density on the atom.
Electronic Investigation
In this investigation the ambiphilicity of the molecule will be investigated by changing the group 14 atom, from Si to C (to produce carbenes) and to Ge (to produce Germylenes):
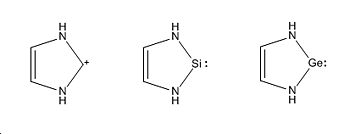
Molecule 5

Molecule 5 is a carbene, a positevly charged molecule with a carbon replacing the silicon in steric investigation. The molecule was drawn in ChemBio 3D and optimised using the MM2 method, yielding a total energy of 71.56kcal/mol. This basically optimised molecule was saved and imported into GaussView 5. This molecule was optimised using the B3LYP method and the 3-21G basis set. The calculation took 1 minutes and 37 seconds. This file was then optimised further using the more complex basis set 6-311G(d,p), which took 2 minutes and 28 seconds and yielded the following results [45]:
| Singlet | Singlet | |
| Calculation Method | B3LYP | B3LYP |
| Basis Set | 3-21G | 6-311G(d,p) |
| N-C(between N) Bond Length/A | 1.35 | 1.33 |
| N-C Bond Length/A | 1.40 | 1.38 |
| N-C-N Bond Angle/Degrees | 106.8 | 107.1 |
| N-C-C Bond Angle/Degrees | 106.6 | 106.5 |
| C-N-C Bond Angle/Degrees | 110.1 | 110.0 |
| Charge | 1 | 1 |
| Spin | Singlet | Singlet |
| Total Energy/a.u. | -225.3501 | -226.6535 |
| RMS Gradient/a.u. | 0.000024 | 0.000232 |
| Dipole Moment/D | 1.46 | 1.43 |
| Point Group | C1 | C1 |
From this it is possible to see that there is delocalisation: the amine C-N bond is usually 1.47Å compared to the C-N bond length in molecule 5 which is 1.33Å and 1.38Å, both of which are shorter than a C-N. However they are both longer than a C=N bond, which is 1.27Å. This delocalisation is shown in the image of the optimised molecule.

Molecular Orbtial Analysis was carried out using the same basis set and method (6-311G(d,p) and B3LYP) but using the keywords "pop=full" and selecting "full NBO". The scan took 25 seconds and produced the following results [46]:
 |
 |
 |
 |
 |
 |
 |
 |
 |
 |
From this analysis the delocalisation of the molecule, seen in the image above, can be shown by the LUMO+2 in which an electron cloud is present over the carbon carbon double bond at the back of the molecule. The LUMO+1 and the HOMO-1 shows no electron density over the positive carbon atom between the nitrogens. This is where a nucleophile could attack. The molecule is also able to act as a nucleophile. The HOMO, HOMO-2 and especially the HOMO-4 show that there is electron density over the carbon between the nitrogens. This is able to attack an electrophile should it be of correct symmetry and energy.
Using the MO log file generated, NBO Analysis and Charge Distribution was carried out:

From this charge distribution it can be seen that the nitrogens are red, showing that they are negatively charged. This is due to their lone pair and them taking electron density from the hydrogens attached because the nitrogens are electronegative. The carbon between the nitrogens is greeen in colour, showing that it is positive, and this is again due to the electronegativity of the nitrogens pulling electron denisty away from the carbon. For the same reason the hydrogens attached to the nitrogens are also green in colour suggesting that they are positive. The carbon=carbon are dark in colour making the neutral because they are half way between the red and green colours. This pictoral representation is shown in the "NBO Summary" section of the stream output file:

The file can be further analysed to show the extent of the filling of the p orbitals of the carbon (in molecule 6 in the silicon is able to act as an electrophile due to its partially filled p orbital). I was observed that the vacant px orbital had an occupancy of 0.782, the py an occupancy of 1.096 and the pz an occupancy of 0.915. This shows that there is little to no room in any of the vacant orbitals of the carbon to accept any incoming electron density. This means that the molecule is not ambiphilic because the carbon is not able to act as an electrophile. Furthermore it can be seen that the occupancy of the py orbital is greater than 1 which suggests extra electrons from the delocalisation over the ring.

| Energy/kcal | Donor | Acceptor |
| 80.48 | N5 lone pair in s | N3C4 π* |
| 28.20 | N5 lone pair in s | C1-C2 π* |
The Second Order Perturbation section of the report provide further evidence of the delocalisation over the molecule: There are 2 E2 energies which are over 20kcal. E2 that are over 20kcal are where fill orbitals donate electrons into an empty orbital, leading to delocalisation. These are shown to the right:
Frequency Analysis was run on the molecule using the same method, basis set and keywords that were used in molecules 1-4. The reaction took 2 minutes and 34 seconds and produced the following results [47]:

The frequency analysis produced the IR spectrum shown above. However there are 3 zero intensity vibrations, at 627cm-1, 685cm-1 and 898cm-1. These vibrations do not show up because, during the vibration, there is not change in dipole moment, thus making the vibration IR inactive and not appearing in the spectrum. The C-N stretch is at 1113cm-1, which is close to the with the N-C literature value of 1180-1360 cm-1 [48]. The large peak at 3604cm-1 is due to the NH stretch.
Molecule 6
Molecule 6 is the silylene and is the same as molecule 1. Therefore calcuations were not re-run and the data used in this section is that from molecule 1. Optimisation shows that the molecule is huckel aromatic: the delocalisation can be shown by looking at the bond lengths: the C-N bond length is between that of a single and a double C-N bond, with a value of 1.39A (in contrast to 1.47A and 1.27A fro a single and double bond respectively). Molecule 6 has shorter M-N bond lengths (where M is either C, Si or Ge), and shorter N-C bond lengths. The former is because the silicon lone pair is influenced by the delocalisation and causes the silicon to be closer to the nitrogens. This does not happen molecule 5 becuase there is not a lone pair on the carbon atom (as seen in the NBO analysis above) and so will not interact with the delocalised ring as well as the silicon. The shortened N-C is due again to the delocalisation: the delocalsiation places greater electron density into the bond thus making them shorter. From the MO analysis it can be seen that the silicon has more delocalisations (within the MO's shown, there are 3 which show strong delocaisation over the molecule, but in C-molecule 5- there is one 1 which shows delocalisation over the molecule) and this will mean that there is more electron denisty in the N-C bonds in the molecule, making the bonds shorter. NBO analysis showed that the Si was ambiphilic, with the ability to act as an electrophile due to the partially filled p orbtial. In contrast the carbon p orbitals were filled and so could not accept electrons thus meaning it was not able to act as an electrophile. Silicon shown to be able to act as a nucleophile becuase large areas of electron density could be seen over the SI in the MO analysis, particularly in the HOMO and HOMO-1. This is similar to molecule 5 which shows electron denisty over the carbon, thus enabling it to act as a nucleophile. The frequency analysis showed that the Si-N stretch was at 379cm-1. This is at a much lower frequency that the carbon molecule 5. This may be a reflection of the increase in size between the carbon and the silicon. The silicon will be further away from the nitrogen than the carbon, due to the extra d shell and a larger covalent radius (Si radius is 0.117nm compared to of 0.077nm for carbon), which will mean that the bond is weaker because the molecules are further away causing a decrease in overlap.
Molecule 7

Molecule 7 is a germylene, with the silicon in molecule 1 being replaced with Ge. The molecule was drawn in ChemBio 3D and optimised using the MM2 method, yielding a total energy of 12.12kcal/mol. This basically optimised molecule was saved and imported into GaussView 5. This molecule was optimised using the B3LYP method and the 3-21G basis set. This file was then optimised further using the more complex basis set 6-311G(d,p), which took 5 minutes and 49 seconds and yielded the following results [49]:
| Singlet | ||
| Calculation Method | B3LYP | B3LYP |
| Basis Set | 3-21G | 6-311G(d,p) |
| N-Ge Bond Length/A | 1.85 | 1.89 |
| N-C Bond Length/A | 1.39 | 1.38 |
| N-Ge-N Bond Angle/Degrees | 83.1 | 81.5 |
| N-C-C Bond Angle/Degrees | 113.0 | 113.7 |
| Ge-N-C Bond Angle/Degrees | 115.5 | 115.6 |
| Charge | 0 | 0 |
| Spin | Singlet | Singlet |
| Total Energy/a.u. | -2254.1607 | -2265.2151 |
| RMS Gradient/a.u. | 0.000033 | 0.000017 |
| Dipole Moment/D | 1.92 | 1.27 |
| Point Group | C1 | C1 |
These results show that the Ge-N bond is at 1.89Å, (close to the lierature value of 1.92Å [50] )making it the longest of the M-N bonds in the series. The Germanium has the largest ionic radius 1.22Å compared to silicon and carbon, and this will mean that the distance between the 2 nuclei of the nitrogen and the germanium will be larger and so the bond will be longer. The N-Ge-N bond angle is 81.5o, smaller that that of both the carbon and the silicon molecules. This is becuase as the metal moves further away from the ring of the molecule, the anle will decrease. The M-N-C bond anlge is at 113.7o, the largest of the molecule 5-7. This is because the the metali is further away from the molecule, which will increase the bond angle. It can also be seen that at you go down the group there is not influence over the NC bond length which is constant at around 1.39Å. This is because in molecule 5-7 there is delocalisation, especially over the part of the molecule which does not include the non-metallic element, and this will cause the N-C bond lengths not only to remain relatively constant but to be between the literature values for a single and a double bond, showing that there is delocalisation within the molecule.

MO analysis was carried out using the same basis set (6-311G(d,p)), method (B3LYP) and keywords(pop=full and selecting "full nbo" used in earleir molecules. The calculation took 30 seconds and produced the following results[51]:
 |
 |
 |
 |
 |
 |
 |
 |
 |
 |
The MO generated can show the delolcaisation over the back of the molecule, as shown in the image above. The delocalisation is best shown in the LUMO+2 which depcits the electron delocalisation over the back of the molecule. Full delocalisation over the whole molecule can be seen best in the HOMO-4. The ability of the germanium to act as a nucleophile is shown in both the extent of delocalisation and the build up of electron denisty (and so negative charge) over the germanium. This is best shown in the LUMO, HOMO and HOMO-1 which all contain a build up of electron charge over germanium. The ability of the germanium to act as an electrophile is best shown in the LUMO+3 and the HOMO-2 which have a noticable lack of electron denisty over the germanium, allowing incoming nucleophiles to attack at this section of the molecule. The MO file produced was used to carry out an NBO investigation and to look at the charge distribution of the molecule.

From this it can be seen, similar to both molecules 5 and 6, that the non-metallic element, in this case the germanium, is positively charged (green), showing the lewis acidic nature of the molecule. Moreover the nitrogens are negatively charged (red), due to the presence of their lone pair and the electronegativity of the nitrogen which will draw electrons form the hydrogens attached. As a result this is why the hydrogens attached to the nitrogens appear green and positive. More in depth analysis was carried out on the charge distribution:
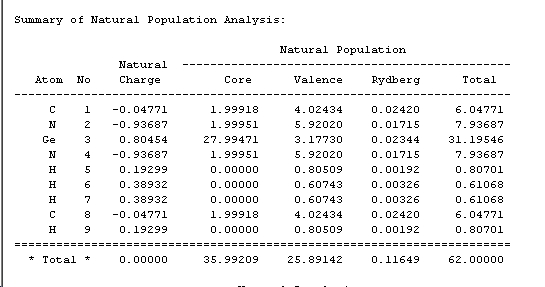
This shows the same as the pictoral representation above. The "Bond Orbital/Coefficient/Hybrid" section was analysed to determine what orbital the germanium lone pair was present in. It was found that the germanium lone pair was in an orbtial with mainly s character (84% s character, 16% p character) similarto the silicon atom.
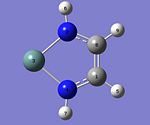
The "Second Order Perturbation" section was analysed to see whether there were any E2 energies which were at energies higher than 20kcal. It was observed that there were 3, tabulated to the right. An E2 energy of greater than 20kcal shows the donation of electron density from a full orbtial into the empty orbital, thus showing the extent of delocalisation in the molecule.
| Energy/kcal | Donor | Acceptor |
| 28.25 | C1C8 π* | |
| 37.91 | N4 lone pair in s | C1-C8 π* |
| 20.40 | N4 lone pair in s | N2-Ge3 π* |
Further analysis can produce the occupation of the pz orbital of the Ge, and therefore the ability of ht emolecule to accept incoming electrons. The pz occupancy was found to be 0.561, which means that the germanium is able to accept electron density. Howeever it will not be able to accept as many electrons as silicon because it is more full, meaning it will be less electrophilic.
Frequency Analysis was run using the same method, basis set and keywords as in the previous molecules. The calculation took 39 seconds and produced the following results [52]:

The frequency analysis produced the IR spectrum shown above. However there are 3 zero intensity vibrations, at 526cm-1, 624cm-1 and 845cm-1. These vibrations do not show up because, during the vibration, there is not change in dipole moment, thus making the vibration IR inactive and not appearing in the spectrum.
The Ge-N stretch is at 614cm-1, which is close to the with the Ge-N literature [53]value of 632cm-1 . The large peak at 3622cm-1 is due to the NH stretch.
Summary of Electronic Investigation
Overall it can be seen that carbon is unbale to act as both an electrophile and a nucleophile, and thus is not ambiphilic. As you go down the group there is a decrease in electronegativity making the M-N bond weaker. The reuslts show that as you go down the group, there is an increas in the M-N bond length. This is because there is an increase in the size of the ionic radius, and this leads to the longer bond lengths. Furthermore there is a decrease in the N-M-N bond angle and and increase in the N-C-C bond angle. This is as a result of the increase in bond length, which will chage the shape of the five membered ring, altering the bond anlges within it. In terms of the MOs it can be seen that there is little effect on the MOs produced when the metal is changed. This is becuase the metals have the same number of electrons which could be influeneced ad take part in the delocalisation over the ring. It can also be seen tha tas you go down the group there is little to no change in the extent of delocalisation over the molecule. This is mainly due to all the Si/Ge/C having the same number of electrons in their outer sehll and so being able to doaem.nte the same number of electrons into the delocalised syst NBO analysis showed, that as you go from carbon to silicon there is a big decrease in the occupancy of the pz orbtial. This is to be expected because the pz in carbon is filled but in both germanium and silicon it is not full. It was seen that both the Ge and the Si contain their lone pairs in an orbital of high s character, and that their pz orbital occupancy is roughly similar. Frequency Analysis showed that as you go down the group, the Non-Metal-Nitrgoen bond decreases in frequency. This can be explained that the bond length is longer and therefoer there will be less orbital overlap in the molecule, making the bond weaker and therefore appearing at lower frequencies. As said, the carbon was discovered not be electrophilic and therefore not be ambiphilic. It can also be seen that both the silicon and germanium compunds were able to acts as both electrophiles and nucleophiles and therefore were ambiphili.c However, it can not be said whether there is a trend for the group, i.e. as you go down the group which molecule with become more nucleophilic and therefore less electrophilic making it less ambiphilic. This is becuase the pz orbital of the germanium molecule was more filled than the electron, but both were less filled than the silicon.
Conclusion of Mini Project
Overall it can be seen that both steric and electronic effects can alter the ability of the molecule to be ambiphilic. As the steric bulk of the molecule is increased the molecule will be less able to act as an electrophile because the pz orbital becomes more full. Furthermore carbon is unable to act as an electrophile . To conclude, the most ambiphilc molecule in this study was moles 1 (which is identical to molecule 6). This is becuase it had the lowest occupancy of the pz orbital and so was able to act as an electrophile, but still has a lone pair and electron density over the silicon which will enable it to act as a nucleophile.
References
- ↑ Geometrical Changes and Their Energies in the Formation of Donor-Acceptor Complexes DOI:10.1023/B:STUC.0000021532.01536.21 [1]
- ↑ IR Spectroscopy [2]
- ↑ 3.0 3.1 Infrared Absorption Intensities and Bond Moments in BCl3 DOI:10.1016/0584-8539(67)80004-7
- ↑ Trans 1st Optimisation File DOI:10042/to-2986
- ↑ Cis 1st Optimisation File DOI:10042/to-2987
- ↑ Trans 2nd Optimisation File DOI:10042/to-2992
- ↑ Cis 2nd Optimisation File DOI:10042/to-2994
- ↑ 8.0 8.1 Steric Contributions to the Solid State Structures of Bis(phopphine) Derivatives of Molybdenum Carbonyl DOI:10.1021/ic00131a055 Cite error: Invalid
<ref>tag; name "mr607no10" defined multiple times with different content - ↑ Crystal Structures of trans-[Mo(CO)4(PPh3)2] and 1,4-bis (diphenylphosphino)-2,5-difluorobenzene DOI:10.1016/S0020-1693(96)05133-X
- ↑ Cis Isomer Frequency Analysis File DOI:10042/to-2997
- ↑ Trans Isomer Frequency Analysis File DOI:10042/to-2998
- ↑ Properties, Dynamics and Elcetronic structure of Atoms and Molecules: Molybdenum (VI) dioxohalides-Agreement with experiment and prediction of unkown properties through density functional theoryDOI:<405::AID-QUA7>3.0CO;2# 1002/(SICI)10097-461X(1997)61:3<405::AID-QUA7>3.0CO;2#
- ↑ A Convenient Synthesis of cis-Mo(CO)4L2 derivatives DOI:10.1021/ic50187a062
- ↑ Microwave Assisted Reflux in Organometallic Chemistry: Synthesis and Structural Determination of Molybdenum Complexes http://jchemed.chem.wisc.edu/Journal/Issues/2002/Oct/abs1249.html
- ↑ Imperial College London Chemistry Department: 2nd Year Synthesis Spring Lab Manual 2003 http://www.ic.ac.uk/local/organic/Spring-manueal-2003.pdf
- ↑ Isolable Silylens, Disilenes, Trisiallenes, and Related Compounds DOI:10.1016/j.jorganchem.2004.05.054
- ↑ Silylenes: A Unified Picture of Their Stability, Acid-Base and Spin Properties, Nucleophilicity and Electrophilicity, via Computational and Conceptual Density Functional Theory DOI:10.1021/jp067742k
- ↑ Molecule 1 Singlet Optimisation DOI:10042/to-3055
- ↑ Molecule 1 Triplet Optimisation DOI:10042/to-3054
- ↑ Silylenes: A Unified Picture of Their Stability, Acid-Base and Spin Properties, Nucleophilicity and Electrophilicity, via Computational and Conceptual Density Functional Theory DOI:10.1021/jp067742k
- ↑ J.G. Stark, H.G. Wallace: Chemistry Data Book {{ISBN:0-7195-3951-X}
- ↑ Molecule 1 MO Data File DOI:10042/to-3090
- ↑ Excited State Reactions of an Isoable Silylene with Aromatic Compounds DOI:10.1021/ja025522o
- ↑ Nucleophilicity and Electrophilicity of Silylenes from a Molecular Electrostatic Potential and Dual Description Perspective DOI:10.1016/j.cplett.2009.01.054
- ↑ Frequency Analysis for Molecule 1 DOI:10042/to-3117
- ↑ J.G.Stark, H.G. Wallace:Chemistry Data Book (ISBN:0-7195-3951-X)
- ↑ Interstellar Si-N Chemistry DOI:10.1016/50301-0104(96)
- ↑ Molecule 2 Singlet Optimisation DOI:10042/to-3088
- ↑ Molecule 2 Triplet Optimisation DOI:10042/to-3089
- ↑ Molecule 2 MO Analysis DOI:10042/to-3190
- ↑ Lewis Bsic and Acidic Interactions of Silylenes: A Theoretical Study DOI:[3]
- ↑ Molecule 2 Frequency Analysis DOI:10042/to-3195
- ↑ Molecule 3 Initial Optimisation DOI:10042/to-3208
- ↑ Molecule 3 Singlet Optimisation DOI:10042/to-3211
- ↑ Molecule 3 Triplet Optimisation Template:DIO
- ↑ Molecule 3 MO Analysis DOI:10042/to-3269
- ↑ Molecule 3 Frequency Analysis DOI:10042/to-3307
- ↑ Molecule 4 Initial Optimisation DOI:10042/to-3207
- ↑ Molecule 4 Singlet Optimisation DOI:10042/to-3212
- ↑ Molecule 4 Triplet Optimisation DOI:10042/to-3213
- ↑ Molecule 4 Molecular Orbital Analysis DOI:10042/to-3230
- ↑ Molecule 4 Vibrational Analysis DOI:10042/to-3230
- ↑ Tabulation of Infrared Spectral Data, Dolphin and Wick, Wiley Interscience (ISBN:0-471-21780-8)
- ↑ Nucleophilicity and Electrophilicity of Silylenes from a Molecular Electrostatic Potential and Dual Description Perspective DOI:10.1016/j.cplett.2009.01.054
- ↑ Molecule 5 Optimisation DOI:10042/to-3214
- ↑ Molecule 5 MO Analysis DOI:10042/to-3338
- ↑ Molecule 5 Frequency Analysis DOI:10042/to-3343
- ↑ J.G.Stark, H.G.Wallace: Chemistry Data Book (ISBN:0-7195-3951-X)
- ↑ Molecule 7 Optimisation DOI:10042/to-3228
- ↑ An Intramolecularly Stabilised Ge=N compound and a Related Ge-Fe Complex DOI:10.1002/anie.199002161
- ↑ Molecule 7 MO Analysis DOI:10042/to-3380
- ↑ Molecule 7 Frequency Analysis DOI:10042/to-3389
- ↑ Characteristics of the Ge-N bond in certain complexes of germanium according to IR spectroscopy data DOI:10.1007/BF00739474


