Talk:Mod:chchanmod3
Module Three: Reaction Mechanisms and Transition States by Chun Ho Chan
Introduction
Last-but-one edit from Friday 25th March
The Cope Rearrangement
Introduction
|
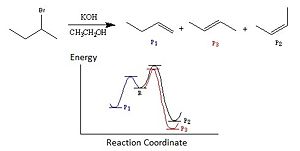
The Cope rearrangement is a typical example of [3,3]-sigmatropic shift; in this section the rearrangement of 1,5-hexadiene would be investigated. The reaction is shown in Figure 3 and its transition state is a six member aromatic ring, hence there are two possible conformations, chair and boat. Research was carried out and the results[1]show that the boat transition state is at a higher energy level, hence the following calculations were performed to achieve a better understanding of the results.
 |
 |
Optimisation of Reactant and Product
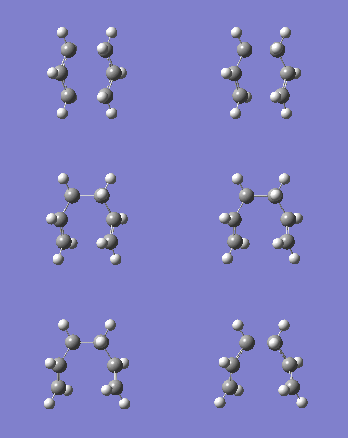
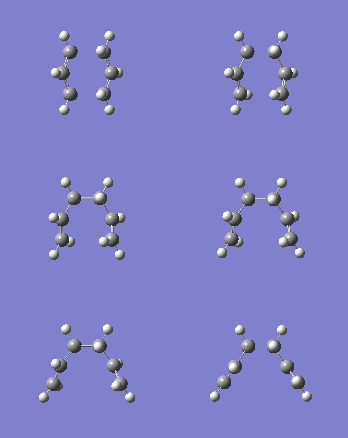
1,5-hexadiene was optimised by Hartree Fock method and 3-21G basis set, two possible conformations of the anti-periplanar group and two from the gauche (synclinal) conformation were being optimised; the results are shown in Table 1. The point groups of the conformations were not found, therefore the symmetry criteria of GaussView was relaxed and the point group of each conformation was obtained.
|
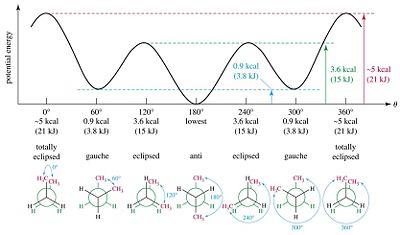
All the energies, structures and point group agree with the given optimisation results in Appendix 1 of Module 3 Intructions. The dihedral angle of the anti-periplanar conformation is ~180o, whilst for gauche conformation, it is ~60o;both angles roughly agree with the theoretical angles of the conformers.
|
 |
Anti-periplanar 2 Conformation Further Optimisation
Optimisation
The structure of anti-periplanar 2 conformer was being re-optimised with a higher level method, B3LYP with the basis set 6-31G(d). The results obtained were similar to that from HF/3-21G, but the total energy is much lower (~8 x 10³ kJ/mol) and the bond lengths are slightly closer to the literature values[3], C=C bond length is 1.34Å, C-C=C bond length is 1.51Å and C-C-C-C bond length is 1.54Å.
| Method 1 | Method 2 | |
|---|---|---|
| 3-D Structure |
| |
| Calculation Type | FOPT | FOPT |
| Calculation Method | RHF | RB3LYP |
| Basis Set | 3-21G | 6-31G(d) |
| Total Energy (Hatree) | -231.6925 | -234.6117 |
| RMS Gradient Norm | 0.00001339 | 0.00001359 |
| Dipole Moment (Debye) | 0.0003 | 0.0000 |
| Point Group | Ci | Ci |
| Dihedral Angle (o) | 180 | 180 |
| Dihedral Angle 1 (o) | 115 | 118 |
| Dihedral Angle 2 (o) | 115 | 118 |
| C=C Bond Length (Å) | 1.32 | 1.33 |
| C-C=C Bond Length (Å) | 1.51 | 1.51 |
| C-C-C-C Bond Length (Å) | 1.55 | 1.55 |
The dihedral angle 1 and 2 increased from 115o to 118o, showing the two structures are slightly different. As all the differences between the two methods are relatively small, hence HF method with 3-21G basis set can be an acceptable method to compute this conformer.
Vibrational Frequency Analysis
|
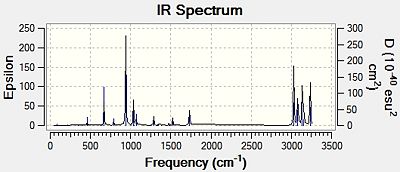
The vibrational frequencies were generated by B3LYP/6-31G(d), same as optimising the structure, and all the vibrational frequencies are positive; this suggests the stationary point found by optimisation is a minimum point of the potential energy surface of the conformer. The computed infra-red spectrum is shown in Figure 7, which looks similar to the experimental spectrum[4], showing the computed structure is similar to the experimental structure.
|
 |
In addition to vibrational frequencies, thermodynamic data were also being calculated. The conditions of the thermodynamic calculations were automatically set as standard conditions, 298.15 K and 1 atm; Results are shown in Table 3.
| Energy (Hartree) | |
|---|---|
| Sum of electronic and zero-point energies | -234.469204 |
| Sum of electronic and thermal energies | -234.461857 |
| Sum of electronic and thermal enthalpies | -234.460913 |
| Sum of electronic and thermal free energies | -234.500777 |
The sum of electronic and zero-point energies contributes to the potential energy at 0 K and the zero-point vibrational energy; the sum of electronic and thermal energies corresponds to the translational, rotational and vibration energies at the conditions with the sum of electronic and zero-point energies.
The sum of electronic and thermal enthalpies takes into account RT in addition to the sum of electronic and thermal energies, where R is the gas constant and T is the temperature of the conditions. The sum of electronic and thermal free energies includes ST, where S is the entropy and T is the temperature of the conditions, giving the equation G = H - ST.
Optimisation of Chair Transition State
Initially only an alkyl fragment (CH2CHCH2) was input into GaussView, it was then optimised with HF/3-21G approach. Two of these optimised fragment were combined and resembled a chair geometry; the distance between the two terminal ends was set to be approximately 2.2 Å apart. As mentioned in the introduction, transition states can be modelled by a few methods and the chair transition state would be modelled by force constant matrix computation and frozen coordinate approach.
| 3-D Structure | |
| Calculation Type | FOPT |
| Calculation Method | UHF |
| Basis Set | 3-21G |
| Total Energy (Hartree) | -115.82 |
| RMS Gradient Norm | 0.00005432 |
| Dipole Moment (Debye) | 0.0291 |
| Point Group | C1 |
Computing the Force Constant Matrix
This method calculate the force constant matrix, which is also known as Hessian matrix, directly; however, this approach only works if the guess transition state structure is very similar to the experimental structure since very different structures would give diverse potential energy curves. In addition, the calculations can be very time consuming, thus other approaches would be used for more complicated structures. 'Optimisation to a TS (Berny)' was selected with the additional command, Opt=NoEigen, to avoid system crashing if more than one imaginary frequency was detected during the optimisation.
Only one imaginary frequency was detected which indicated the structure is a transition state rather than a minimum point of the potential curve. The low frequencies are -0.0007, -0.0005, 0.0007, 0.7300 and 1.8367, which implies that the method is at a high level of accuracy. The terminal carbons distances were optimised to be 2.02 Å.
Frozen Coordinate Approach
This approach involves two optimisations, as it needs to freeze the reaction coordinate then optimise the rest of the molecule, followed by unfreezing the reaction coordinate and re-optimising the molecule. The distances between the terminal carbons were fixed at 2.2 Å for the first optimisation with the additional command, Opt=ModRedundant, to freeze the reaction coordinate. Upon completion of the optimisation with frozen reaction coordinate, the coordinate is unfrozen and re-optimisation at transition state (Berny) was applied. This method can avoid the complex calculations in computing the force constant matrix, hence generally it is being used for complicated structures.
| Optimisation with Frozen Coordinate (Step 1) | Optimisation of the Relaxed Structure (Step 2) | |||||||
|---|---|---|---|---|---|---|---|---|
| 3-D Structure |
|
| ||||||
| Calculation Type | FOPT | FREQ | ||||||
| Calculation Method | RHF | RHF | ||||||
| Basis Set | 3-21G | 3-21G | ||||||
| Total Energy (Hartree) | -231.62 | -231.62 | ||||||
| RMS Gradient Norm | 0.00325608 | 0.00005486 | ||||||
| Dipole Moment (Debye) | 0.0009 | 0.0001 | ||||||
| Point Group | C1 | C1 | ||||||
| Imaginary Frequency (cm-1) | - | -818 | ||||||
| Imaginary Frequency Vibrational Mode | - | 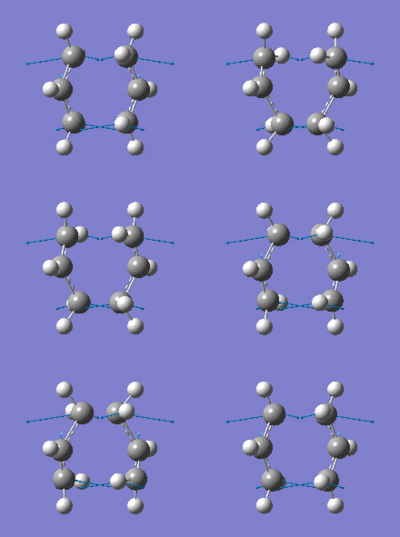 |
The results show that there is only one imaginary frequency being computed, hence the optimisation is a transition state instead of a minimum point at the potential energy curve. The low frequencies calculated are -4.8201, -4.5087, -0.0002, 0.0001 and 0.0005, which indicates the level of accuracy of the method is acceptable. The distances between terminal carbons stayed at 2.20 Å after step 1, which provide evidence showing the optimisation was carried out with frozen reaction coordinate; the distances were optimised to 2.02 Å after step 2, which is the same as using force constant matrix computation. Both imaginary frequencies and their vibrational modes generated by the two methods are very similar; the similarity suggests the chair transition state structures modelled by the two methods only differ from each other slightly. From the imaginary vibrations, a bond is making whilst a bond is breaking can be observed clearly.
Optimisation of Boat Transition State
|
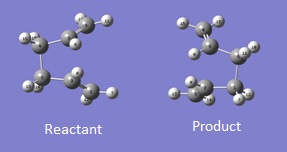
The QST2 method was chosen to optimise the boat transition state structure, the method involves inputting both the reactant and the product into GaussView to generate the structure of the transition state. The reactant and product are numbered in an identical way so that atoms would not exchange positions, otherwise the calculation will fail. The reactant and product are orientated and numbered according to Figure 8.
|
 |
| 3-D Structure | |
| Calculation Type | FOPT |
| Calculation Method | - |
| Basis Set | - |
| Total Energy (Hartree) | -231.52 |
| RMS Gradient Norm | 0.00851282 |
| Dipole Moment (Debye) | 0.0137 |
| Point Group | C1 |
|
In order to achieve the boat transition state structure, the C-C-C-C dihedral angle was modified to 0o and the C-C-C bond angles were reduced to 100o, giving the input as shown in Figure 9. The QST2 method was run for optimisation and frequency calculations, a boat transition state structure was generated and the result summary is shown in Table 8. The force constant matrix was choice to be calculated once during the optimisation. The distances between terminal carbons are 2.14 Å, whereas for a chair transition state they are 2.02 Å. In addition, the chair transition state is ~53 kJ/mol more stable than the boat transition state, hence showing chair conformation is preferable for the reaction to proceed through. The presence of only one imaginary frequency shows that the structure is a transition state in contrast of a minimum point of the potential energy curve. The low frequencies are -2.8424, -1.3959, -0.0007, -0.0006 and 0.0006, which show the method chosen for the calculation is at an acceptable level of accuracy. From the vibration of the imaginary frequency, a C-C bond was breaking whilst another one is forming at the other end of the molecule, which agrees with the reaction scheme. |
 |
| QST2 | ||||
|---|---|---|---|---|
| 3-D Structure |
| |||
| Calculation Type | FREQ | |||
| Calculation Method | RHF | |||
| Basis Set | 3-21G | |||
| Total Energy (Hartree) | -231.60 | |||
| RMS Gradient Norm | 0.00003105 | |||
| Dipole Moment (Debye) | 0.1584 | |||
| Point Group | C1 | |||
| Imaginary Frequency (cm-1) | -840 | |||
| Imaginary Frequency Vibrational Mode | 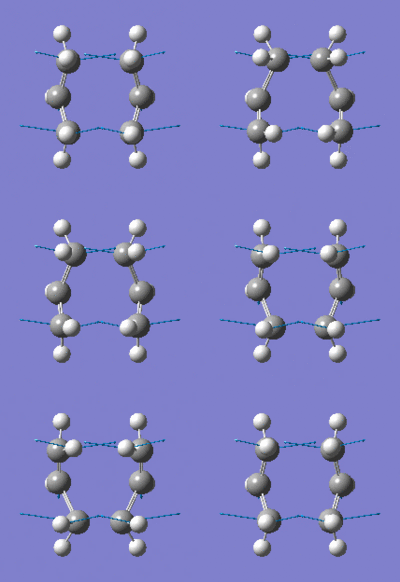 |
Intrinsic Reaction Coordinate (IRC)
GaussView can act as a platform to stimulate a minimum energy pathway from the transition sate structure to a local minimum and so giving the conformation of the minimum structure(s); the method is known as the intrinsic reaction coordinate (IRC). This calculation works by moving along the potential energy curve in small geometry steps in the direction where the gradient or slope of the energy surface is steepest.
Since the reactant and the product of the Cope rearrangement is symmetrical, thus only forward direction reaction coordinate was analysed. Initially, the force constant matrix was only calculated once during the start of the calculation and the number of points to be computed was set to be 50. This produced the results in Table 9.
| Total Energy (Hartree) | -231.62 |
| Actual Number of Points along IRC | 51 |
| Total Energy along IRC | 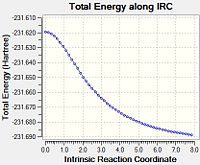 |
| RMS Gradient along IRC |  |
| Animation of Geometric Change of the Structure along IRC | 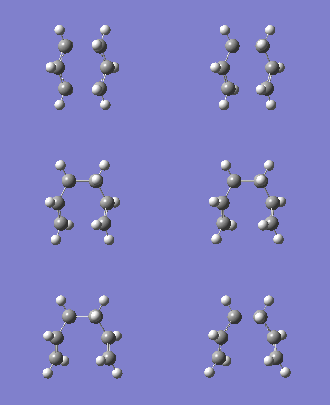 |
Based upon the RMS Gradient graph, the result structure is not at its minimum point of the potential energy curve yet as the gradient is larger than zero, which indicates it has not reached a stationary point yet. To improve the results, a few measurements can be taken:
- Specify a larger number of points for the model so it reaches its minima
- Compute the force constant matrix at every step along the IRC
- Combination of both mentioned above
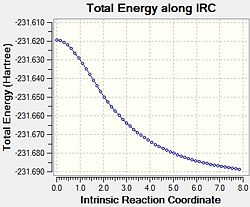
The third measurement has the high level of accuracy but it would increase the job time significantly; for the purpose of visualising the effect of each measurement, all of them were performed and the results are summarised in Table 10.
| 200 Number of Points | Calculate Force Constant Matrix at Every Step | 200 Number of Points with Calculate Force Constant Matrix at Every Step | |
|---|---|---|---|
| Total Energy (Hartree) | -231.69 | -231.62 | -231.62 |
| Actual Number of Points along IRC | 87 | 51 | 92 |
| Total Energy along IRC |  |
 |
 |
| RMS Gradient along IRC |  |
 |
 |
| Animation of Geometric Change of the Structure along IRC | 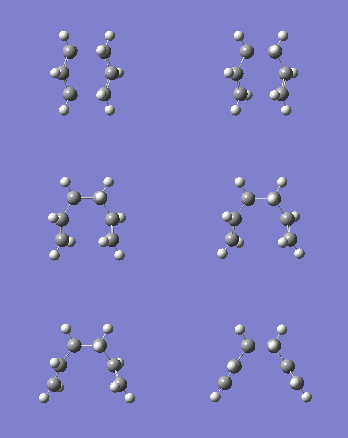 |
 |
 |
| Job Time | 18 minutes 58 seconds | 12 minutes 57 seconds | 22 minutes |
As shown in Table 10, calculating the force constant matrix at every step does not have a significant impact, although the gradient is closer to zero. The other two methods both reach zero gradient, hence they both produce similar results and the finial product is in gauche conformation, which agrees with the reactant/product optimisation results performed above. Since the third alteration is more time consuming, thus for such simple molecule, having a larger number of points would be enough to produce accurate results.
Activation Energy Calculations
To calculate more accurate activation energies for both chair and boat transition state, both transition state structures were re-optimised with a high level method, B3LYP/6-31G(d) and the results are shown in Table 11. The RMS gradients generated by the higher level method are closer to zero, hence the structures are closer to the stationary point of their respective potential energy curve. The higher level method also optimised both transition states with ~8 x 10³ kJ/mol more stable. The terminal carbon distances reduced from 2.02 Å to 1.97 Å for the chair conformation, whilst for the boat conformation, they increased from 2.14 Å to 2.21 Å; this shows that the high level method has altered the structures. In addition, the imaginary frequencies for both structures were modified to -566 cm-1 and -530 cm-1 rather than -818 -1 and -840 -1 for chair and boat structures respectively. This provides evidence implying that the vibrations for both transition states are slightly different between the two methods applied.
| B3LYP/6-31G(d) | HF/3-21G | |||
| Chair Conformation | Boat Conformation | Chair Conformation | Boat Conformation | |
| 3-D Structure |
|
|
| |
| Calculation Type | FREQ | FREQ | FREQ | FREQ |
| Calculation Method | RB3LYP | RB3LYP | RHF | RHF |
| Basis Set | 6-31G(d) | 6-31G(d) | 3-21G | 3-21G |
| Total Energy (Hartree) | -234.56 | -234.54 | -231.62 | -231.60 |
| RMS Gradient Norm | 0.00001218 | 0.00000402 | 0.00005486 | 0.00003105 |
| Dipole Moment (Debye) | 0.0000 | 0.0613 | 0.0001 | 0.1584 |
| Point Group | C1 | C1 | C1 | C1 |
| Imaginary Frequency (cm-1) | -566 | -530 | -818 | -840 |
| Terminal Carbon Distance (Å) | 1.97 | 2.21 | 2.02 | 2.14 |
The activation energies were calculated based upon the data generated by B3LYP/6-31G(d). The conditions for the calculations are 298.15 K and 1 atm.
| Sum of Electronic and Zero-point Energies (Hartree) | Sum of Electronic and Thermal Energies (Hartree) | Activation Energy at 0 K (Hartree) | Activation Energy at 298 K (Hartree) | |
|---|---|---|---|---|
| Chair Conformation | -234.414929 | 234.409008 | 0.054275 | 0.052849 |
| Boat Conformation | -234.402342 | -234.396008 | 0.066862 | 0.065849 |
| Anti-periplanar 2 Conformer | -234.469204 | -234.461857 | - | - |
| Activation Energy at 0 K (Hartree) | Activation Energy at 0 K (kcal/mol) | Activation Energy at 298 K (Hartree) | Activation Energy at 298 K (kcal/mol) | Experimental Activation Energy at 0 K (kcal/mol) | |
|---|---|---|---|---|---|
| Chair Conformation | 0.054275 | 34.06 | 0.052849 | 33.16 | 33.5 ± 0.5 |
| Boat Conformation | 0.066862 | 41.96 | 0.065849 | 41.32 | 44.7 ± 2.0 |
The activation energy calculations show that reaction goes via the chair transition state has a smaller kinetic barrier as the chair transition state is at a lower energy level than the boar transition state; this shows that unless specific conditions are applied the reaction would progress through a chair transition state to give the product.
The computed results agree with the experimental results showing the model applied for the calculation has a high level of accuracy for these structures.
Diels-Alder Cycloaddition
Introduction
Diels-Alder cycloaddition, like the Cope rearrangement, is a type of pericyclic reactions. The π orbitals of the dieneophile overlap with the π orbitals of the diene to form new σ bonds, which is only allowed when the HOMO of one reactant overlap with the LUMO of the other reactant in correct alignment, hence leading to its stereospecific reactivity. In addition, a substituted dieneophile can alter the regiochemistry since new pi orbitals can interact with the double formed in the product.
In this section, molecular orbitals during Diels-Alder cycloadditions with transition state structures and the regioselectivity of the reaction would be investigated.
Simple Diels-Alder Cycloaddition (Ethylene and Butadiene)
Molecular Orbitals of Ethylene
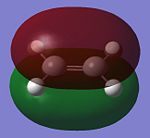
The structure of ethylene molecule was optimised by AM1 semi-empirical molecular orbital method, with the same method, the molecular orbitals were also generated for the optimised structure.
| HOMO | LUMO | |
|---|---|---|
 |
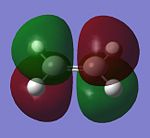 | |
| Symmetry | symmetrical | anti-symmetrical |
| Energy (Hartree) | -0.388 | 0.053 |
As the mechanism of Diels-Alder cycloaddition only involves the overlap of HOMO and LUMO of the reactants, therefore only those molecular orbitals are being discussed. To allow the reaction to occur, the HOMO and LUMO overlapping need to be have the same symmetry.
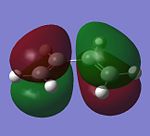
Molecular Orbitals of Cis-butadiene
The same method (AM1 semi-empirical molecular orbital) was applied to optimise cis-butadiene and generate its molecular orbitals
| HOMO | LUMO | |
|---|---|---|
 |
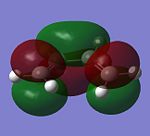 | |
| Symmetry | anti-symmetrical | symmetrical |
| Energy (Hartree) | -0.345 | 0.018 |
Based upon these calculations performed above, the HOMO of ethylene can overlap with the LUMO of cis-butadiene, whilst the LUMO of ethylene can overlap with the HOMO of cis-butadiene, due to the allowing symmetries; thus Diels-Alder cycloaddition can be performed between the two reactants.
Transition State Optimisation
As mentioned above, there are three different methods in optimising the transition state structure. Initially the direct force constant matrix computation approach was applied, but a transition state structure could not be generated. The QST2 method was then performed, but it is time consuming, therefore to compromise between accuracy and time consumption, the frozen coordinate method was chosen for the optimisation of the transition state structure.
The distances between the C-C bonds to be formed were frozen to be 2.2 Å and the AM1 semi-empirical molecular orbital method was applied to optimised the structure. Once the molecular structure was relaxed, the coordinate was then unfrozen and optimisation with the same method was performed to give the final optimised transition state structure.
| Frozen Coordinate Method | ||||
|---|---|---|---|---|
| 3-D Structure |
| |||
| Calculation Type | FREQ | |||
| Calculation Method | RAM1 | |||
| Basis Set | ZDO | |||
| Total Energy (Hartree) | 0.1117 | |||
| RMS Gradient Norm | 0.00003763 | |||
| Dipole Moment (Debye) | 0.5606 | |||
| Point Group | C1 | |||
| Imaginary Frequency (cm-1) | -956 | |||
| Imaginary Frequency Vibrational Mode | 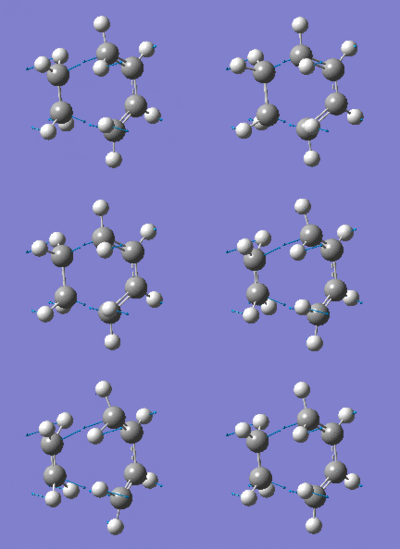 |
The presence of only one imaginary frequency shows that the structure generated is at a transition state. The low frequencies calculated are -5.5266, -2.0854, -0.8828, -0.0032 and 0.0322, which are in the acceptable range, hence the method used was suitable. To further increase the level of accuracy, a higher level of method can be used, but it would consume more time to perform the calculations.
The bond lengths of the transition state can provide information regarding the reaction pathway.
| Transition State Structure | Literature Values[5] | |
|---|---|---|
| C-C Bond Length (Å) | 1.40 | 1.54 |
| C=C Bond Length (Å) | 1.38 | 1.34 |
| C-C Bond Forming Length (Å) | 2.12 | - |
In comparison with the average bond lengths of C-C and C=C, during the transition state, the C-C bond is reduced to 1.40 Å whilst the C=C bonds are increased to 1.38 Å. This shows the reaction is progressing according to the scheme as C-C bond is turning into C=C bond, whilst C=C bonds are reducing to C-C bonds. The C-C bonds forming between the reactants have the distance of 2.12 Å, which should be reducing as reaction proceeds. To visualise this, an IRC can be run to observe the pathway from changing the transition state to its minima.
Molecular Orbitals of the Transition State
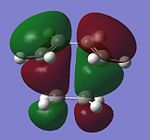
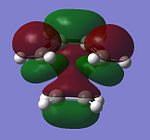
Overlap between orbitals to form a new bond can only occur when they have the same symmetry, therefore the HOMO of the transition state consists of the HOMO of cis-butadiene and the LUMO of ethylene (both anti-symmetrical), whilst the LUMO of the transition structure is formed by overlapping LUMO of cis-butadiene and the HOMO of ethylene (both symmetrical). The HOMO of the transition state represents the two new C-C σ bonds forming, whilst its LUMO corresponds to the forming of two new C-C σ* orbitals.
| HOMO | LUMO | |
|---|---|---|
 |
 | |
| Symmetry | anti-symmetrical | symmetrical |
| Energy (Hartree) | -0.324 | 0.023 |
Diels-Alder Cycloaddition with Regioselectivity (Cyclohexa-1,3-diene and Maleic Anhydride)
Research[6] shows that the Diels-Alder cycloaddition of cyclohexa-1,3-diene and maleic anhydride can produce two products, endo or exo, where the endo product is the major kinetic product whilst the exo product being the minor thermodynamic product. This is due to the lower activation energy of producing endo-product, whilst the formation of exo-product is reversible. In this section, this experimental observation would be expected computationally.

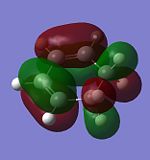
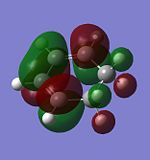
Molecular Orbitals of Cyclohexa-1,3-diene
The method,AM1 semi-empirical molecular orbital, was used to optimised cyclohexa-1,3-diene and generate its molecular orbitals.
| HOMO | LUMO | |
|---|---|---|
 |
 | |
| Symmetry | anti-symmetrical | symmetrical |
| Energy (Hartree) | -0.321 | 0.017 |
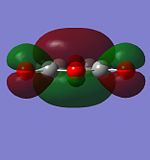
Molecular Orbitals of Maleic Anhydride
As above, AM1 semi-empirical molecular orbital method was performed to optimised the structure and generate its molecular orbitals
| HOMO | LUMO | |
|---|---|---|
 |
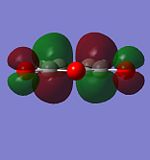 | |
| Symmetry | symmetrical | anti-symmetrical |
| Energy (Hartree) | -0.442 | 0.060 |
Transition State Optimisation
| Exo-product | Endo-product | |||||||
|---|---|---|---|---|---|---|---|---|
| 3-D Structure |
|
| ||||||
| Calculation Type | FREQ | FREQ | ||||||
| Calculation Method | RAM1 | RAM1 | ||||||
| Basis Set | ZDO | ZDO | ||||||
| Total Energy (Hartree) | -0.0505 | -0.0515 | ||||||
| RMS Gradient Norm | 0.00004834 | 0.00003239 | ||||||
| Dipole Moment (Debye) | 5.5629 | 6.1685 | ||||||
| Point Group | C1 | C1 | ||||||
| Imaginary Frequency (cm-1) | -810 | -806 | ||||||
| Imaginary Frequency Vibrational Mode |  |
 |
The presence of only one imaginary frequency for each structure shows that each structure generated is at a transition state instead of a minima of its potential energy curve. The endo-product has a lower imaginary frequency and the C-C bond forming distance of the endo-product is 2.16 Å, whilst for exo-product it is 2.17 Å; these suggest endo-product is more likely to form due to better orbital overlap. The C-C bond distances in both structures are short than average C-C bond length, whilst all the C=C bond distances are longer than the literture C=C bond length as mentioned above. This provide evidence regarding the reaction is proceeding according to the reaction scheme, to further compute the reaction pathway, IRC can be performed.
From the steric hindrance perspective, exo-product progresses through a less steric hindered stage as the distance between the maleic anhydride and the cyclohexa-1,3-diene is larger, thus there would be less repulsion between the electron clouds of the reactants. Nevertheless, the endo-product pathway is still favourable, hence the secondary orbital effect needs to be taken into acount.
The interaction between the π* p- orbitals of maleic anhydride carbonyl carbon atoms (causes by the presence of C=O bonds) and the p-orbitals of the diene in the endo-transition state would cause stabilisation. These orbitals are of the same symmetry, thus they can overlap to cause the stabilisation. This secondary orbital interaction does not occur in teh exo-transition state structure, which causes a destabilisation. For this particular reaction, the secondary orbital effect has a greater contribution than the steric effect, hence exo-transition state is higher in energy, which cases a greater kinetic barrier for the reaction to progress. Based upon this analysis, under general reaction conditions, the kinetic product (endo-product) would be formed.
Molecular Orbitals of the Transition State
Reference
- ↑ M. J. S. Dewar, G. P. Ford, M. L. McKee, H. S. Rzepa and L. E. Wade, Journal of the American Chemical Society, 1977, 99, 5069-5073
- ↑ Clayden, Greeves, Warren and Wothers, Organic Chemistry, Oxford University Press, 2008, 8th edition, 452-453
- ↑ G. Schultz and I. Hargittai, Journal of Molecular Structure, 1995, 346, 63-69
- ↑ A. K. Mal'tsev, V. A. Korolev and O. M. Nefedov, Bulletin of the Academy of Sciences of the USSR, Division of Chemical Science (English Translation), 1984 , 33, 510 - 521
- ↑ M. A. Fox and J. K. Whitesell, Organische Chemie., 1994, Spektrum
- ↑ K. C. Nicolaou,S. A. Snyder, T Montagnon and G. Vassilikogiannakis, Angew. Chem. Int. Ed., 2002, 41, 1668-1698

