Talk:Mod:MgOns2214
The Free Energy and Thermal Expansion of MgO
Abstract
This experiment involved studying the thermal activity of magnesium oxide as it expanded. It was possible to predict the thermal expansion of the crystal via two methods:
- Quasi-Harmonic Approximation
- Molecular Dynamics
From these calculations, the thermal expansion coefficient can be derived. Additionally, the values obtained from different methods can be compared at varying temperatures.
Introduction
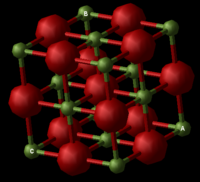
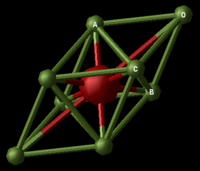
Magnesium Oxide Structure
Magnesium Oxide is an ionic lattice possessing covalent character, as a result of the relative atomic electronegativities; Mg(1.31)[1] and O(3.44)[2]. Its crystalline structure is face centred cubic and this structure is easier to visualise as a conventional cell, containing 8 atoms in total (Figure 2.1). This conventional cell is four times the volume of the primitive cell (Figure 2.2) containing 2 atoms. Depending on the method used to predict the properties of the lattice as it expands, calculations may be based on either primitive, conventional or super cells of the compound.
Converting from real to reciprocal space
One method of calculating the thermal expansion of Magnesium Oxide is to use the quasi-harmonic approximation and study the vibrations of the primitive cell. The vibrations experienced in the cell can be defined as discrete quantities, i.e. phonons. The boundary conditions need to be periodic and in order to do this, the atoms are converted from a real to a reciprocal space, where the first and Nth unit of magnesium oxide are connected to assume periodicity of the waves. When measuring vibrations experienced in the primitive cell, all the modes can be displayed as a dispersion curve. This shows the frequency of the vibrational energy levels at each individual k point, and the points are connected to display a curve. There is a k point for every possible vibration of the crystal. The dispersion curve therefore connects the wave vector with frequencies of vibrations in the lattice. Magnesium oxide is heteroatomic and so there are two distinct sets of branches seen in the phonon dispersion (Figure 2.3)
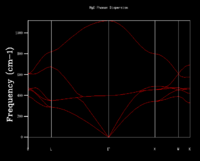
with two atoms in every unit. The optical branch displays vibrational levels where the atoms move against each other, are out of phase and are at a higher energy level. Conversely, the acoustic branch displays the vibrations of atoms in phase.
Calculating Free Energy within Harmonic Approximation
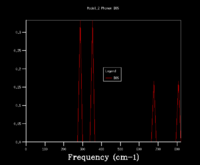
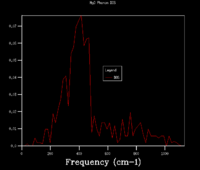
From the phonon dispersion curve of a magnesium oxide primitive cell, it is possible to calculate the free energy by summing the vibration bands and k points and averaging, instead of displaying each individual k point. Varying the number of k points used affects the density of states (DOS) plot. In a 1x1x1 grid (Figure 2.4), for example, only one k point is considered and so only the frequencies from that one point will be displayed (Image 3). From looking at the output log file, it is clear that the k point taken in the 1x1x1 DOS has the coordinates (0.5000,0.5000,0.5000), as this vector matches the frequencies of peaks seen (288.49, 351.76, 676.23, 818.82 cm-1. As the number of k points included in the DOS increases, the ratios of vibrational frequencies becomes more accurate and a smoother curve is seen. In the 8x8x8 grid, 256 k points are considered and this is sufficiently accurate to obtain a good free energy calculation. The 8x8x8 (Figure 2.5) and 32x32x32 grids present similar ratios of frequencies, suggesting that the 8x8x8 considers enough points.
Relationship between lattice constant and grid size of k points
When converting from the real to reciprocal space, the distance between atoms is inversely proportional. Thus, even though the lattice constant of magnesium oxide is measured as 4.212 Ä in a conventional cell at 0K, it is infinitely larger in reciprocal space as the equation for conversion is:
. A lattice structure such as Calcium Oxide has a lattice constant of 4.8110 Ä. These similar values mean there is no need to alter the grid size used for this compound. However a large crystalline structure such as Faujasite, consisting of cages, would not require as large a grid size. The lattice constant of this macromolecular structure is roughly 24.64 Ä. This constant is six times the distance of MgO, and therefore in reciprocal space, the distance would be six times smaller. Fewer k points would need to be considered in order to obtain a smooth DOS and accurate free energy determination. Lithium metal has a lattice constant of 3.490 Ä. Therefore in reciprocal space, a denser grid of k points would be needed to obtain an accurate DOS.
Molecular Dynamics
Another method of studying thermal expansion is to simulate vibrations within a lattice and calculate the physical properties as the lattice equilibrates over time. A super cell is required for this calculation because the units would otherwise all be in phase- i.e. at k point (0,0,0). This would be an inaccurate representation of the cell, unlike the quasi-harmonic approximation which accounts for all bond distances and vibrations.
Method
Quasi-Harmonic Approximation
Properties of materials are a statistical average over many different energy states of molecules making up the material. It is possible to average the vibrations experienced in the primitive cell and thus predict the properties of the lattice in whole. First the energies were measured at each grid size in order to select an accurate number of k points to include. Then the temperature was varied between 0 and 1000K and the volume measured.
Molecular Dynamics
Within a 32 unit MgO lattice, the vibrations experienced in the lattice are simulated and measured over time as the structure equilibrates, Towards the end, the average physical properties begin to settle and can be used for analysis. The sampling steps, time and temperature can all be varied in theses simulations.
Results and Discussion
Free energy using harmonic approximation
There is a variation in free energies when the grid size of k points is changed at a specific temperature. This alone shows the significance of including enough k points when averaging across a DOS. Table 1 shows the free energies, when grid size is increased from 1 to 8, at a temperature of 300 K.
| Grid Size (NxNxN) | Free Energy (meV) |
|---|---|
| 1x1x1 | -41075.3176 |
| 2x2x2 | -40926.6090 |
| 3x3x3 | -40926.4320 |
| 4x4x4 | -40926.4500 |
| 5x5x5 | -40926.4630 |
| 6x6x6 | -40926.4710 |
| 7x7x7 | -40926.4750 |
| 8x8x8 | -40926.4780 |
| 16x16x16 | -40926.4820 |
| 32x32x32 | -40926.4830 |
As the grid size increases, there is an initial fluctuation in free energy, but then a gradual decrease in value. A 3x3x3 grid is accurate enough to calculate free energy to 1eV, and 4x4x4 is suitable within an approximation of 0.5 eV and 0.1 eV. The energy has plateaued in the 8x8x8 region, making it a suitable grid size for further calculations on the lattice, as increasing grid size to 16 or 32 doesn't have a significant impact on the energy calculation. This is an accurate starting point for calculating the thermal expansion in terms of volume and lattice constants.
Thermal expansion using approximations
Under the quasi-harmonic approximation, the temperature was varied and free energies reported (Figure 4.1).

As the temperature increases, the free energy decreases accordingly. This can be explained by the Helmholtz free energy equation:
As temperature increases, the free energy becomes more negative, decreasing in value: the (-TS) value increases. There is less energy available to do work because the bonds are able to vibrate more, thus possessing more kinetic energy.
In comparison, when plotting the lattice constant against temperature, the opposite trend can be seen (Figure 4.2). These data points fall within the quasi-harmonic approximation, where as displacement between the atoms increases, the energy of the lattice increases, reducing the energy free to do work. These graphs show that it is the bond distance within the lattice that directly affects the energy of the system.
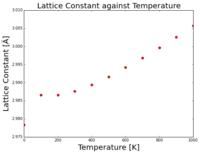
For the molecular dynamics approximation, the lattice vibrations were once again simulated between 0 and 1000K at 100K intervals. It was not possible to calculate free energy at 0K, as it is impossible to distribute 0 energy to atoms and simulate this.
Calculating thermal expansion coefficient
In order to calculate the thermal expansion coefficient, the gradient of volume v.s. temperature curve is divided by the initial volume of MgO at 0K.
| Approximation type | dV/dT | Thermal expansion coefficient (a) |
|---|---|---|
| Quasi-Harmonic | 0.0004550 | 0.00002400 |
| Molecular Dynamics | 0.0005680 | 0.00003000 |
The experimental data in literature shows the thermal expansion to be 10.8 x 10⁻⁶ at 273K [3]. The higher values obtained through these approximations used can be explained accordingly:
Born-Oppenheimer Approximation
It is assumed that the electrons move independently of the nuclei and so the kinetic energy of the nucleus is 0. This is not strictly true and therefore can affect how vibrational bands are perceived at different k points.
Buckingham Potential
This approximation removes any covalent character in the ionic lattice of magnesium oxide. This explains why the predicted thermal expansion coefficients are larger in value than experimental. The bond lengths would be shorter in an ionic lattice with covalent character as the electron density is distributed and shared between the magnesium and oxygen in the units. The polarisation would reduce the displacement and thus the volume, at higher temperatures especially. It is the main form of approximation in molecular dynamics and so at short internuclear distances, it is inaccurate to use these measurements- nuclei are unbound at a distance of 0 in this approximation.[4]
Compare and Contrast
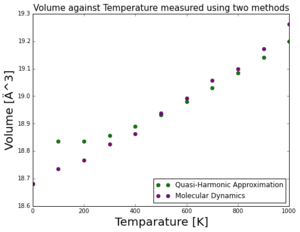
From Figure 4.3, the general trend from both approximations remains that as temperature increases, the volumes also increases. The higher kinetic energy within the lattice allows higher frequencies of vibrations and thus longer bond lengths as the lattice approaches its melting point. The approximations give similar values for volume in mid-range temperature 500K- Harmonic (18.9325 Ä) and Molecular Dynamic (18.9373 Ä). However at lower temperatures the harmonic approximations gives higher volume readings, and molecular dynamic approximations gives higher volume readings at higher temperatures. In the quasi-harmonic model, it is assumed that the frequency of vibrations is affected by the lattice volume. If the temperature is too high, the volume increases significantly and the lattice is far from equilibrium, giving inaccuracy to readings as it does not follow the quasi-harmonic trend. Molecular dynamic approximations are more well suited for higher temperatures. In higher temperatures, higher frequency vibrational levels are accessible and there is a lot more random motion. Molecular dynamics can extend beyond positions of equilibrium because it simply simulates how the lattice responds to different temperature surroundings.
Conclusion
In conclusion, there are two main methods of calculating the thermal expansion coefficient theoretically; these are using the quasi-harmonic approximation and molecular dynamics. Depending on the temperature under which the lattice vibrates, one approximation may be suitable over the other. The quasi-harmonic approximations is suitable within equilibrium and molecular dynamics can extend beyond this. In order to perform a reliable molecular dynamic calculation for MgO, a significantly larger number of units would need to be included in the structure. 32 units of MgO puts constraint on the vibrations simulations as there aren't enough atoms to lose symmetry and break bonds as it would in an infinite lattice. More atom units are required to reach higher vibrational levels too.
Bibliography
References: Template loop detected: Template:Reflist
