Talk:Mod:Hunt Research Group/VmdVisual
More Advance Visualisation
how to overlay two structures for comparison
Introduction
In this example we will compare the same complex optimized using different DFT functionals. The complex in question is a calcium ß-diketiminate complex with a bound alkyl phosphine substrate.
Loading molecule files
VMD can use many file types however the file type required in this instance is .xyz
In the VMD Main window, navigate to:
File => New Molecule
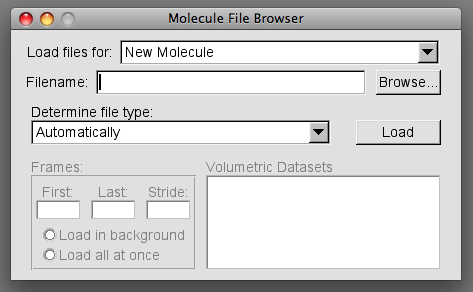
This will prompt the Molecule File Browser to load.
To load the first file click "Browse" and navigate to the location of your first file. It is handy if the first file loaded is your reference structure.
You will see the in the Load files for: box, in the Molecule File Browser, now reads 0:filename and a wireframe image has appeared in the OpenGL Display.
Every additional file must be loaded as a New molecule. To do this, press the arrow in the "Load files for" box. Select "New molecule" and repeat the procedure above for your remaining files.
Overlaying Structures
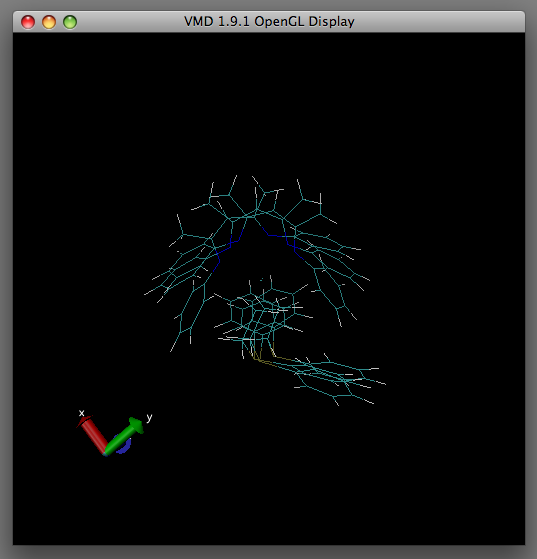
You will now notice in the OpenGL Display that the overlaid images are in disarray.
In order to superimpose the images on top of one another use the following procedure.
In the VMD Main window navigate to:
Graphics => Representations
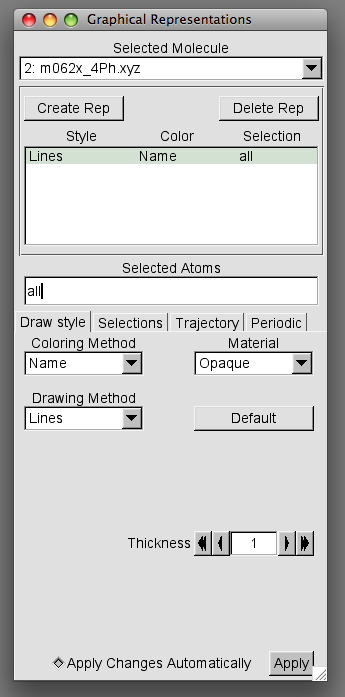
The following window will pop up
We can use the Graphical Representations window to temporarily remove two of the overlaid images to leave our reference image. To do this in the Selected Molecule box select one of the files you wish to temporarily remove then in the Style Color Selection box double click the Lines Name all entry.
If done correctly the colour of the font in Lines Name all should turn red. You should also notice the structure corresponding to the file is no longer displayed in the OpenGL Display.
Repeat this procedure for the remaining files until you are left with the reference geometry in the OpenGL Display.
In order to superimpose the structures correctly you need a point of reference in the structure which all the additional representations will be aligned to.
Your reference point in the reference structure needs to be a region whihc is least likely to change from one representation to another. In this worked example, the 3 atoms in the backbone of the complex will act as the reference point.
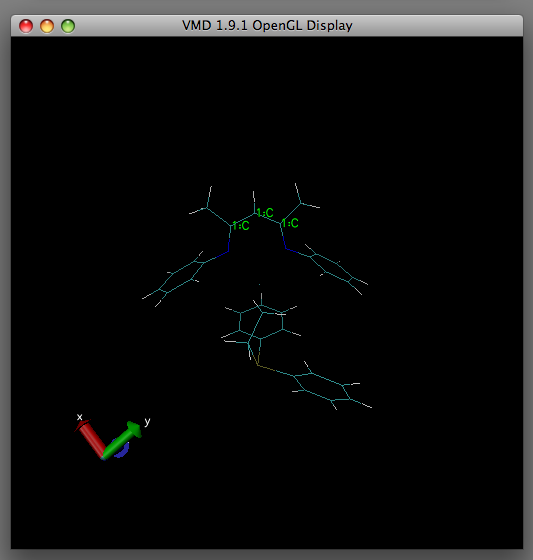
Next we need the atom numbers corresponding to the reference point in the structure. To do this first ensure you are working in the OpenGL Display window.
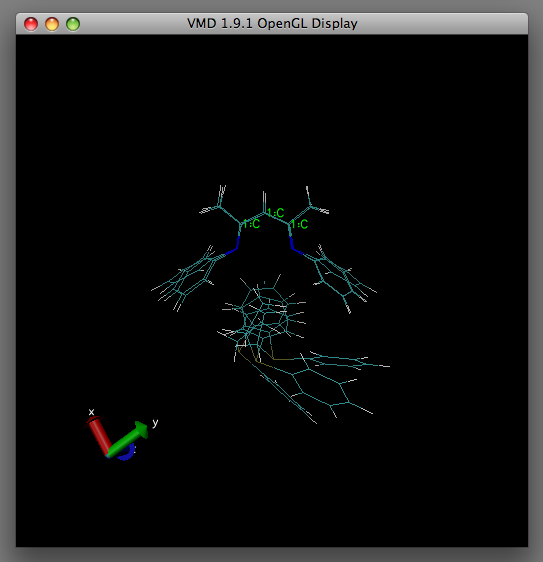
Press "1" on the keyboard. You will know if this has happened correctly as the mouse arrow should change to a crosshair. Using the crosshair, click the atoms which you wish to act as your reference point in the structure. As you select the atoms, green text will appear beside the atom (as shown in the image above.
Now in the VMD Main window, navigate to:
Graphics => Labels
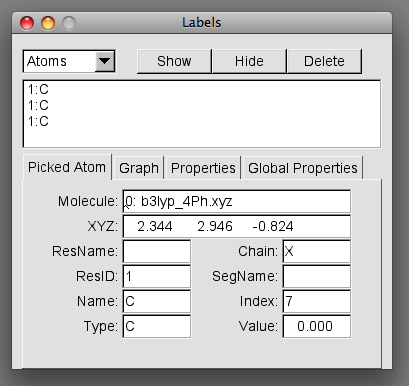
The following labels window will appear on screen
This window will display information on the atoms selected.
The information we require is found in the index box. As you select each label you will notice the index number changes. These numbers correspond to the atom numbering within your xyz file. Take a note of the index numbers.
In the VMD Main window navigate to:
Extensions => Analysis => RMSD Calculator
The following window will appear:
Using the index information type the following information into the box which is currently filled with residue # to #
index first index no. or index second index no. or index third index no. or index fourth index no.
and so forth. This entry will depend on how many numbers you decide to use as a reference.
In the worked example, the entry is as follows:
index 7 or index 9 or index 10
Once you have added this text press enter.
Now untick the backbone only box, and select Selected (this will deselect Top). Finally in ID molecule click on your reference file.
Once you are finished the window should resemble something like this:
Now press Align.... it will appear as if nothing has happened
Return to your Graphical Representations window and unhide the representations you hid earlier. (Select the file you hid in Selected Molecule box and double click Lines Name all whereby the font should turn from red to black.
Hopefully In the OpenGL display window you should observe the structures align to your chosen reference atoms as displayed in the table below under 'After'.
| Before | After |
|---|---|
|
|
If you still have green text next to your reference atoms, return to the Labels window, select the label and press delete.
The wire representation of your overlaid structures can be difficult to decipher. You can make things easier to visualise by following the instructions on this page.
Troubleshooting
- The aligning of the structures can be a little temperamental. You may need to press the align button more than once.
- The quality of alignment is dependent on the number of atoms you use as your reference. (Use a minimum of three??)
- No amount of "Align" button pressing will overlay structures correctly when the numbering of your atoms in the files are different from one another. The atom numbering must be consistent in all files.
how to visualise a selection of atoms within radial distance of a selected molecule/atom
- make a selection within a certain radius
- under GRAPHICAL_REP:SELECTIONS type "within x.xx of element Y) and name "Z"
- ADDREP
- this will select the atoms of name Z within x.xx angstrom of element Y
- you can then colour these atoms differently (and or make their VDW spheres larger/smaller)
- for example use COLOURID
- The clipping can not be what you want
- play around with the following in the TK console
- display nearclip set 10.000000
- display nearclip set 0.000000

