Talk:Mod:Hunt Research Group/VMDColor
Colour in VMD
Changing the color of individual atoms
- can be done using the GUI or in the terminal
- select the atom type by name
- then select the way to apply the colour, this can be by atom name, or colourID
- must do it for each item individually
- all items will be this colour until the colour is changed again
- this is only added OVER the existing representation
- for example lets make the water oxygen atoms all red (colorID=1)
- mol selection {name O}
- mol color ColorID 1
- mol representation VDW 0.20 30.0
- mol addrep top
Changing the background colour
- Console commands
- to change the background colour
- colour Display Background blue2
- you can add a gradient to the background, for example
- display backgroundgradient on
- color Display BackgroundTop black
- color Display BackgroundTop blue2
- GUI interface
- In the VMD Main window 'Graphics' => 'Colors'
- The following window will pop up:
- Under 'Categories' => select 'Display',
- under 'Names' => select 'Background'
- under 'Colors' select your desired background colour.
Change one of the predefined colours to another colour
- this is the color command in the VMD manual link
- a changed colour must be applied to an existing colour name, you cannot make a new name
- format is where color=color_name and r g b are numerical values (can be read off the slider)
- change rgb color r g b
- example which changes the colour blue2 to a light blue is
- color change rgb blue2 0.500000 0.700000 0.970000
Color by a specific property
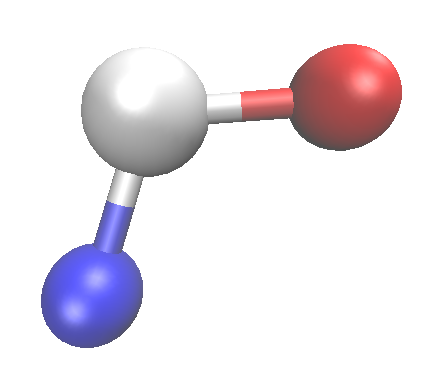
Sometimes it is convenient to color the atoms of a molecule according to a specific property. VMD provides the possibility to do so, namely via the implemented color option according to the B-factor of an atom. To do so, make a PDB file of the molecule of interest, e.g. water
ATOM      1  OH  OSP3    1       4.013   0.831  -9.083  1.00  0.00
ATOM      2 1HH  OSP3    1       4.941   0.844  -8.837  1.00  0.00
ATOM      3 2HH  OSP3    1       3.750  -0.068  -9.293  1.00  0.00
TER
and change the B-factor array (which is the last column, here all 0.00) to the desired property, for example
ATOM      1  OH  OSP3    1       4.013   0.831  -9.083  1.00  2.00
ATOM      2 1HH  OSP3    1       4.941   0.844  -8.837  1.00  1.00
ATOM      3 2HH  OSP3    1       3.750  -0.068  -9.293  1.00  3.00
TER
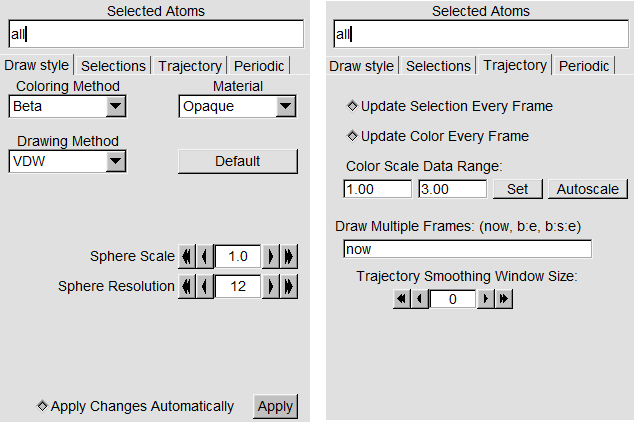
Save the changes, then open the PDB file in VMD. Click on Graphics => Representations, then select "Beta" in the Coloring Method drop-down menu. The color scale data range can be changed when clicking on Trajectory in the same window and changing the values in Color Scale Data Range.

Thus, every property, such as partial charge change, rmsd, how much you like an atom :) ... can be visualised easily.


