Talk:Mod:CW4013
Simulation of a Simple Liquid
Introduction
Molecular Dynamics (MD) simulation allows the thermodynamic properties of bulk materials and fluids to be predicted by computation using the positions, velocities and overall trajectories of a sample of N particles. This is a particularly useful application of statistical thermodynamics because it affords a high degree of control over the investigation; the tedium of repeating laboratory experiments under various controlled conditions becomes trivialised to editing the parameters of an input file. MD also offers insight into physical and chemical processes on the atomic scale, allowing mechanistic studies thereof. Another advantage of simulations is the elimination of random errors associated with instrument uncertainties, which would necessitate repeat trials in the laboratory. It is important however to recognise the intrinsic limitations of the MD simulation method itself, which are referred to below. Note that the LAMMPS program was used to run simulations throughout.
Classical Particle Approximation
For a system containing two or more quantum particles, the Schrödinger equation has no analytical solution, which must instead be approximated numerically. Such methods are not appropriate for simulation a large population of particles (N) due to computational limitations, hence, atoms in MD are considered as classically-behaving spheres whose intermatomic interactions (for the purpose of this experiment) are governed by the Lennard-Jones potential:
Substituting V = 0 reveals that r0 = σ m; the bond distance in order to achieve a potential of 0 as of two atoms at an infinitely large distance apart. V(r) differentiates to F(r), which when equated to 0, F(req) is obtained as , corresponding to the equilibrium interatomic distance at minimum potential. Substituting into the expression for V(r) reveals that the equilibrium potential is equal to -ε. V(r) can be integrated between limits of infinity to 2σ, 2.5σ, 3σ where ε σ are unity to obtain the quantities -0.0248 J m, -0.00818 J m and -0.00329 Jm respectively.
NJ: Show your working. The integrals of the energy are also in reduced units.
Reduced Units
It is not computationally practical to simulate liquids in bulk (eg. 1 ml) quantities; the number of molecules in 1 ml water is 3.336 x 10²², an unreasonably large number to simulate. Conversely, a reasonable number of water to simulate, such as 10000, corresponds to 2.998 x 10⁻¹⁹ ml water, which is not a bulk quantity.
NJ: Show your working.
To emulate bulk conditions, any particle moving through a face of the simulation 'box' reappears on the opposite face. Mathematically, the position vectors range from 0 to the lattice parameter value (in a given dimension) and 'loop' between these values, effectively creating a liquid extending infinitely in all directions without encountering an interface. Hence, an atom that starts at position 0.5i + 0.5j + 0.5k and translates by vector 0.7i + 0.6j + 0.2k in one timestep will appear at position 0.2i + 0.1j + 0.7k in a cubic lattice with a lattice parameter of 1.
In order to work with more manageable numbers when establishing and measuring physical phenomena such as pressure and temperature, reduced units are used, which relate as follows:
where σ, ε and KB are Lennard-Jones parameters and the Boltzmann constant respectively. When treating Argon as a Lennard-Jones gas (σ = 0.34 nm, ε/kB = 120 K, LJ cutoff r = 1.088 nm becomes r* = 0.32. Note that the well depth ε stated above is equivalent to 0.998 kJ mol-1. At a temperature T = 180 K, T* = 1.5.
Atom Generation
At the beginning of liquid or gas phase simulation, a simple cubic lattice is defined from a square a x b x c unit cells, and atoms are placed in each unit cell corner. The lattice is then melted (or vapourised) by controlling the temperature, pressure, total kinetic energy of the system etc until equilibrium and the desired fluid behaviour is reached. If atomic positions were determined purely by random number generation, it is expected that many atoms will be placed in very close proximity and repel strongly, leading to unrealistic kinetic energies and a system that would need very low timesteps to reach equilibrium. It should be noted that the number density (lattice sc) of simulated atoms in a cubic lattice can be thought of as the ratio of the unit reduced volume to the reduced volume of the lattice (the lattice parameter cubed). For a lattice with a reduced number density of 1.2, the lattice parameter would therefore be r* = 0.94.
NJ: Not for an FCC lattice
The number of atoms created is dependent on the number of unit cells created, so for a lattice of 10 x 10 x 10 unit cells, 1000 atoms would be created regardless of the lattice parameter. The properties of the atoms themselves are defined in the code below:
NJ: Not for an FCC lattice
- mass 1 1.0
- pair_style lj/cut 3.0
- pair_coeff * * 1.0 1.0
The first line sets the mass of atom type 1 (the only type used) to 1.0 in (reduced units); lines 2 and 3 are used to assign the atoms Lennard-Jones interactions with σ and ε values of 1.0 and 1.0 respectively. NJ: What does the 3.0 do? With the intial velocities and positions defined as xi and vi = 0, NJ: No! the updated positions and velocities can be solved by numerically integrating Newton's laws of motion using the Velocity-Verlet algorithm. Fundamentally, systems cannot be computed over a continuous time scale, therefore the simulation duration is discretised into timesteps of δt. Hence, a Taylor expansion of x(t+δt) can be used to express the position of a particle at time t plus one timestep:
By assuming that the acceleration of an atom is independent of its velocity, the Velocity-Verlet algorithm can be obtained:
When running a simulation, it can be useful to control the time duration in order to compare results derived from various timesteps. As such, some code is used to ensure that the time duration is constant in each case:
- variable timestep equal 0.001
- variable n_steps equal floor(100/${timestep})
- timestep ${timestep}
- run ${n_steps}
After the timestep is defined in line 1, line 2 defines the total number of timesteps implemented such that the total simulation duration is 100 sec. Line 4 runs a simulation of n timesteps where n is the ratio of the total duration to the timestep.
NJ: But why not use the other version that I proposed?
Results and Discussion
Velocity Verlet Algorithm for Simple Harmonic Motion
NJ: Be careful with the units, these are all reduced

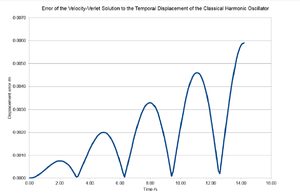


In order to produce an accurate MD simulation, the errors associated with the displacement and energy associated with with the simple harmonic oscillator (SHO) were evaluated using the Velocity-Verlet algorithm and contrasted with the analytical solutions for δt = 0.1 sec and all SHO parameters set to unity. It has been shown that the error in the displacement given by the Velocity Verlet Algorithm fluctuates and propagates with time; the maximum error for δt = 0.1 follows a linear trend of Δxmax = 4.14x10⁻⁴ t</math>. NJ: Why do you think the energy increases like this? Whereas the analytical solution to the total energy of the SHO is a constant given by , the Velocity Verlet solution fluctuates between 0.5 J and 0.499 J as a cosinusoidal function of time. It has been found that for δt values above 0.20 sec, the error in energy exceeds 1% of 0.5 and such timesteps are therefore inappropriate for MD simulations. It is important to monitor the energy of the simulated system to ensure the validity of the computation. When modelling the states of the microcanonical ensemble for example, the results of the simulation are only valid if the total energy of the system is strictly controlled from start to finish, whilst in the canonical ensemble, the energy is expected to change with time until equilibrium is reached. If energy doesn't become approximately constant, then no information about the system at equilibrium may be obtained.
Lennard-Jones Gas Simulation
The dynamics of a Lennard-Jones gas was simulated in the microcanonical (NVE, N = 1000, ρ = 0.8, E* = -3.18 ) ensemble in order to determine a suitable timestep for which the system will reach thermal equilibrium quickly during a 100 sec simulation. It should be noted that the simulation method involves defining a lattice of 10 x 10 x 10 unit cells with one atom per unit cell (number densities 0.8); the energy of the system to start with is greater than -3.18 because req = 1.12 and not 0.8, therefore there is an initial attractive force between atoms. A lower δt value implies more time-frames per second between two timesteps. The particle trajectories are calculated based on their instantaneous positions and velocities at time t and the positions and velocities are then updated for time t + δt. It has been shown that for δt = 0.015, the total energy of the system starts to unexpectedly increase and maintain a positive gradient over the duration. This is because the atoms follow their trajectories for a comparatively long time between timesteps; the effect of this is that when the atomic positions update at t + δt, the new positions may be much closer in proximity than a continuous time frame would allow, invoking strong repulsive forces of the Lennard-Jones potential at interatomic distances significantly below r0. Conversely, it has been shown that timesteps of 0.0025 and below offer sufficient resolution that the system converges to equilibrium almost instantaneously.
NJ: Why not use 0.001 or 0.0075?
Isothermal-Isobaric Ensemble Simulations
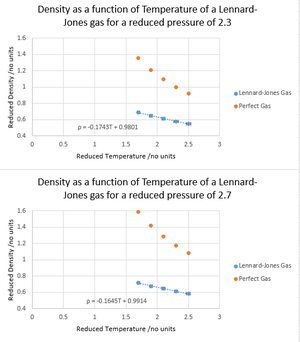
NJ: Change the x-scale so that the data fills the frame, and remove the gridlines. Why did you make a linear fit, do you think this should really be linear? In order to control the average temperature in the ensemble, the temperature is measured at each timestep and compared with the desired temperature ξ. The instantaneous temperature T is prone to fluctuations, and these are corrected by considering the total energy of the system as
In order to correct the temperature, the velocities of the particles are multiplied by a factor γ as shown below:
γ2 may be factorised out of the summation on the left hand side, and remaining instantaneous total kinetic energy term is substituted to obtain
, which then cancels to obtain .
Note when the averages are recorded, the input script contains the command:
ve/time 100 1000 100000
This instruction means that for a given average calculation, input values are used every 100 timesteps; 1000 is the number of values that contribute to the averages; averages are taken every 100000 steps. This means that only one average per property is calculated per simulation consisting of 1000 inputs per average, in effect.
A Lennard-Jones gas was simulated at T* = 1.7, 1.9, 2.1, 2.3 and 2.5 for pressures P* = 2.3 and 2.7, and δt = 0.0025, N = 3375, then plotted against the results predicted by the ideal gas law. In both cases, the simulated densities are less in value than ideal the densities for the given pressures, and this discrepancy increases as pressure increases. This suggests that Lennard-Jones gases behave more ideally at lower pressures; lower pressures cause greater distancing of the atoms on average, hence the interatomic forces to become closer to 0, given that a perfect gas assumes no interactions between atoms. Conversely, at higher pressures, the Lennard-Jones gas particles experience greater interatomic repulsion, leading to expansion of the gas and hence lower densities. Expansion occurs at a less steep gradient compared with ideality due to the attractive interatomic forces of Lennard-Jones gas molecules at long range, which contribute against expansion. Unsurprisingly, a greater net expansion is seen at higher pressures, where higher pressures have a tendency to counteract expansion. NJ: Very good. How does the discrepancy behave with temperature?
Heat Capacity Calculation in the Canonical Ensemble

In this (NVT) ensemble, volume, temperature and number of atoms are fixed. Simulations were run at T* = 2.0, 2.2, 2.4, 2.6 and 2.8 for densities ρ* = 0.2 and 0.8, and δt = 0.0025, N = 3375. The specific heat capacities of the supercritical fluid were evaluated under various conditions using the formula and dividing by the average volumes. The ability of a material to store energy depends on the number of degrees of freedom available to do so; it is therefore no surprise that higher density gases have a higher specific heat capacity because they contain more atoms/degrees of freedom per area.
NJ: Do you mean per volume? In any case, this is the right thinking. In technical parlance, C is extensive.
In both cases, CV decreases with increasing temperature. This has tentatively been attibuted to the convergence of vibrational energy level energy gaps at higher temperatures; this favours the storage of energy in the form of vibrational motion rather than translational and rotational motion as temperature increases, and vibrational motion contributes to temperature more than the other types of kinetic energy.
NJ: Thinking about the available "modes" of your system and the spacing between them in energy is good, but does this monatomic system have any vibrational or rotational modes?
Radial Distribution Functions of Lennard-Jones solids, liquids and gases
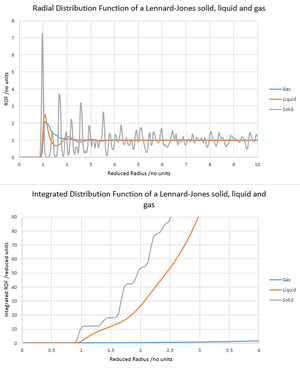
The radial distribution function G(r) can be thought of as the number density of particles around a given particle as a function of radius, which is then compared with the number density around an ideal gas particle under the same conditions. G(r) was calculated for a Lennard-Jones gas, liquid and solid under conditions T* = 1.2 and P* = 0.05, 0.8 and 1.5 respectively (N = 3375, δt = 0.0025). NJ: Well put. Alternatively, g(r) is the probability of finding a particle on a shell at radius r away. From the graphs, the highly ordered, crystalline structure of the solid lattice is apparent from the periodic peaks in G(r) and 0 baseline. A similar but less-well resolved pattern is seen for the liquid, where a sphere of ordering typically occurs around particles, and for gases, there is no apparent ordering around a given atom as shown by the lack of fluctuations in G(r). The integrated radial distribution functions reveal that for the solid lattice, the number of closest neighbours around the central atom is 12, and the number of next-closet neighbours is 8 (given by 20 - 12 on the cumulative integral axis). The coordination number for the first 3 peaks therefore corresponds to 12, 8 and 24 as expected for an fcc lattice. There is an apparent bond distance r* = 0.975 and lattice parameter r* = 1.375 as shown by the first two peaks of G(r) respectively and their distances from the origin.
NJ: You should indicate these peaks on a drawing of the FCC unit cell. You can then work out how far away they should all be in terms of a, then use that to estimate the lattice spacing using the first three peaks.
Diffusion Coefficients of Lennard-Jones solids, liquids and gases
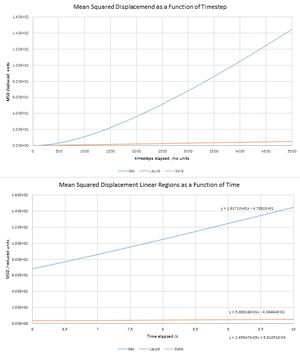
NJ: The trends are much clearer if you plot the three individually
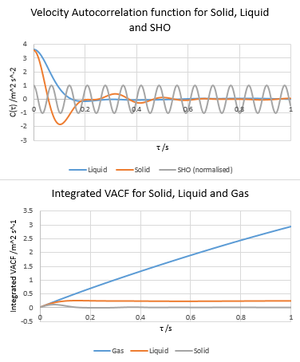

The diffusion coefficient is a constant that represents the intrinsic diffusivity of a substance which is dependent on temperature. There are two ways of measuring this computationally; the extent of Brownian motion of particles may be quantified using the mean squared displacement given by , which in turn related to the diffusion coefficient D by . A solid, liquid and gas were simulated in the canonical ensemble at reduced densities 0.05, 0.8 and 1.5 respectively and reduced temperatures 1.2 (N = 8000, δt = 0.002). The diffusion coefficients were calculated as 3.20 m2s-1 for gas, 0.0749 m2s-1 for liquid and -0.00027 m2s-1 for solid. NJ: Reduced units!.D was calculated for similar systems of much larger N to be 3.14, 0.089 and 0 m2s-1 for gas, liquid and solid phase respectively. The difference is 0.06 m2s-1 (2%) for gas, (19%) for liquid (and both diffusion coefficients are negligible for solid as solids do not undergo Brownian motion). Large errors are expected for liquid phase due to the small D values which are influenced more by noise than a gas would be.
An alternative way of evaluating D is by evaluating the velocity autocorrelation function (C(τ)) for a substance; a measure of the correlation between a particle's velocity at time t compared with at time t + τ. This correlation is provided by the inner product of v(t) with v(t+τ), . The normalised C(τ) for a simple harmonic oscillator can be solved analytically by differentiating to obtain and substituting into . As shown, this substitution leads to the C(τ) = cos(ωτ). C(τ) is shown to be periodic and similar to the result for a damped oscillator; NJ: For the solid? It's not periodic...this is due to the SHO-like behaviour of chemically bonded atoms as simulated in a solid lattice as the atoms are initially attracted to each other and remain strongly bonded (it can be shown that the Lennard-Jones potential behaves like a simple harmonic oscillator at low displacements). Similar behaviour is seen in the liquid state, except that the oscillation is critically damped such that velocity autocorrelation factor becomes 0 immediately after the particles initially collapse together at t = 0. It should be noted that C(τ) for gases takes a lot longer to decay, as though damped above the critical threshold; this is due to the weakness of interatomic interactions, which leaves particle velocities relatively unperturbed for long durations at this temperature. Integrating the velocity autocorrelation functions allows D to be calculated according to , affording values of 3.22, 0.075 and -0.0003 m2s-1 for gas, liquid and solid respectively. Compared to simulations at much larger N values (3.27, 0.0901 and 0.0000455 m 2s-1), the errors are around 1% and 17% for gas and liquid (both values negligible for solid). Error in the simulated D values was tentatively attributed to a higher standard error of the mean particle velocity associated with the smaller sample simulation; this error would propagate through the aucorrelation function and lead to a greater standard error of C(τ).
NJ: What causes the decay in the velocity correlations? Why doesn't this happen for the SHO? What do the minima represent?.
Conclusion
Molecular Dynamics simulations have been used to establish suitable timesteps, illustrate how Lennard-Jones gases deviate from the perfect gas law (particularly at high pressures), determine the bond distance, lattice parameter and coordination number in a solid fcc lattice, and calculate the diffusion coefficients of the system at various phases, along with the specific heat capacity in the solid phase. In the process, some of the accuracies and limitations of MD have been explored, along with how to minimise these adjusting the simulation conditions. The Lennard-Jones model could be powerful in modelling noble gases due to their spheroidal monoatomic particles and instantaneous dipole-induced dipole bonding for which the Lennard-Jones model is a decent approximation; the simulation of other gases might require alternative bonding models to account for varying types, ranges and directionalities of interaction.
