Talk:Mod:Az1114
JC: General comments: All tasks attempted, but some details missing especially in the last few sections. Try to add a bit more to the explanations of your results and make sure that you understand the background theory behind the tasks and use this in your explanations.
Velocity-Verlot Algorithm versus the Harmonic Oscillator
Below in the two figures are the graphs for displacement and energy versus time of a classical harmonic oscillator compared to the values given by the velocity-Verlet algorithm. Both graphs are set at a timestep of 0.1, and it can be seen that for the displacement there is no significant deviation between the displacement of the two different methods.


The following graph is the error of the velocity-Verlot alorithm, or more specifically the absolute difference between the two methods versus time. Note that the value of error oscillates with time between 0 and a maximum, with the maximum generally increasing. The error maximum is found when displacement is zero, thus when at a velocity maximum.
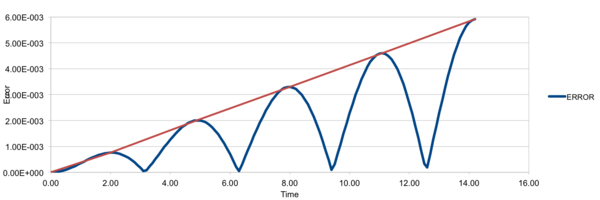
A range of timesteps were used to find what is optimal, from 0.001 to 0.015. It was found that with higher timestep the error with displacement (and therefore energy) increased too. The total error of 1% was not crossed with the timesteps used, but it can be extrapolated to be around a timestep of 0.2.
JC: Good choice of timestep, why does the error oscillate and the maximum error increase over time?
Lennard-Jones Potential
The below equation calculates the Leonard-Jones potential:
By equating this to 0, we find that the - the separation at which the potential is 0 - is .
We can then find the force at this separation by differentiating the Lennard-Jones potential with respect to r, and substituting in the value :
,
The equilibrium separation () is the separation of the particles at equilibrium, and represents the distance that represents the minimum in potential energy. It can therefore be found by equating the force to zero , (or ) to 0.
Hence,
Substituting back into gives us the well depth:
To put this equation into perspective, let us calculate the L-J potential for some realistic cutoff values:
When
Following the same calculations:
The calculations show that as the cutoff distance increases, the Lennard-Jones potential decreases, which agrees with the theory.
JC: All maths correct, except the force should be positive.
Periodic Boundary Conditions
It is very difficult to simulate realistic volumes of liquid and in the scope of this experiment, we have simulated liquids with N (number of atoms) between 1,000 and 10,000. To demonstrate why simulating realistic volumes of liquid is difficult, the number of molecules in 1 mL of water is given by:
(Assuming: Standard conditions; Density of water = 1.00 g/ml)
Conversely, 10,000 water molecules is only
For the simulation to be completed in a reasonable amount of time, the atoms in the simulation are placed in a box with boundary conditions. The box is repeated in all directions, similar to a unit cell in a lattice. If an atom moves outside of the box, another will enter the box from the opposite side, maintaining the same number of atoms in the box.
For example, if an atom at position in a cube of dimensions to moves along the vector , its final position would be , assuming the periodic boundary conditions have been upheld.
Reduced Units
The LAMMPS calculations run in this experiment are all done in reduced units
For example, the Lennard-Jones parameters for argon are ; .
If we set the cutoff to be
Well depth:
and reduced temperature would be
JC: All calculations correct and well laid out.
Equilibration
Creating the simulation box
When initiating the simulation, the atoms are given regular spacing intervals like that found in a square lattice. They are not given random positions, as if by chance two atoms occupy the same space, the program will encounter error.
For a simple cubic lattice (thus having 1 lattice point per unit cell) with number density 0.8:
Therefore the spacing between atoms is 1.0772 unit lengths (in reduced units).
Giving the same treatment to a face-centred cubic lattice (4 lattice points/unit cell) with a number density of 1.2 will have a spacing of as:
JC: This should be (4/1.2)^1/3 = 1.49.
In addition, the simple cubic lattice with a density of 0.8 would create 1,000 atoms in the given constraints of the box:
region box block 0 10 0 10 0 10
and a face centred cubic lattice with a density of 1.2 would create 4,000 atoms in the same box.
Setting the Properties of the Atoms
The input script contained a the following commands:
mass 1 1.0
pair_style lj/cut 3.0
pair_coeff * * 1.0 1.0
The mass command takes two arguments, setting the mass of type 1 atoms as (still in reduced units). The second line defines the type of interaction between the atoms (above set to 'lj' for Leonard-Jones); with a cutoff distance of <math?3.0</math> units. The third line defines the values for the Leonard-Jones interactions, the former setting the well depth and the latter sets . The two asterisks tell the program that this applies to all atoms in the system.
Once the properties of the particles are set, the initial positions and velocities are defined. As we have both the & , the Velocity-Verlet integration half-step algorithm can be used.
JC: Good, why is a cutoff used?
Running the Simulation
In the following lines from the input script:
### SPECIFY TIMESTEP ###
variable timestep equal 0.001
variable n_steps equal floor(100/${timestep})
timestep ${timestep}

### RUN SIMULATION ###
run ${n_steps}
We created and set a variable named 'timestep' to 0.001, and used that value to calculate how many runs (${n_steps}) to carry out. This is superior to writing
timestep 0.001
run 100000
This allows us only to change the value of the timestep variable to alter the number of runs, rather than having to calculate ${n_steps} each time the timestep is altered, especially in cases such as this computational experiment where the timestep can be changed multiple times.
JC: Correct.
Equilibration
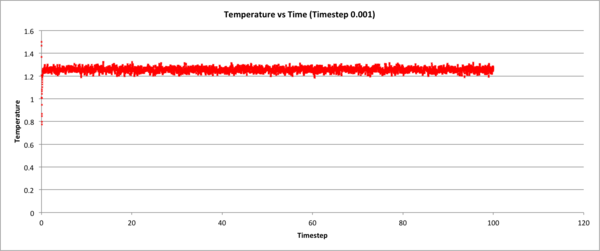
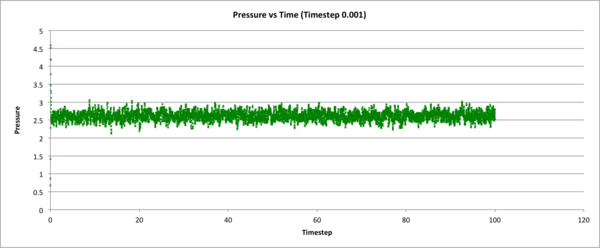
The following 3 graphs check whether the system's total energy, temperature, and pressure (respectively), equilibrate over time during the 0.001 time-step simulation. y-axis values are in reduced units.

The following figure shows how total energy varies with time for many different timesteps. Note how at a large timestep of 0.15, the temperature actually diverges! Thus very high timesteps should not be used do to inaccuracies that can accrue.
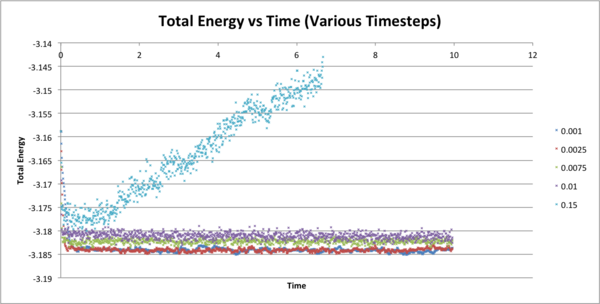
JC: What about the other timesteps, which timestep did you choose and why? What is wrong with the 0.01 and 0.0075 - should the average total energy depend on the timestep?
Running Simulations Under Specific Conditions (NpT)
Temperature and Pressure Control
A timestep of 0.0025 was chosen as it is a good comprimise between accuracy of simulation and the length at which the simulation can run. The following Temperatures are pressures were chosen as were about the equilibration values: T: 1.5, 1.6, 1.7, 1.8, 1.9 P: 2.45, 2.65
In the simulation, the temperature was controlled deducing the (fluctuaing) instantaneous temperature using the following equations:
In order for to reach our target temperature we introduce a constant that controls the particles' velocities:
Thus we can solve for :
From :
Then substituting from
JC: Correct, but you have used epsilon rather than curly T in the final expression.
Explaining the Input Script
In order to calculate the average values for our simulation, the following parameters are set in the input script.
fix aves all ave/time Nevery Nrepeat Nfreq
This means that final averages are calculated only on timesteps that are multiples of Nevery, Nrepeat times; and an average is generated every Nfreq timesteps.
The following commands:
fix aves all ave/time 100 1000 100000
run 100000
Means that the results will be sampled every 100 timesteps for 1000 times (100, 200, 300, etc.). The averages are then calculated 100,000 timesteps, however as our simulation runs for the same amount of time, only a single average is produced with these parameters.
JC: Correct.
The timestep chosen for this simulation was 0.0025.
Equations of State

The above graph is a plot of the density versus temperature of the system for a liquid at two different pressures. There are plots for the values calculated from the simulation and from the ideal gas law.
There is a large difference between the simulated and ideal values, to an extent that they are much larger than the standard error of the simulated values, meaning the y-axis error bars are not visible. However they both follow a trend of the density decreasing with temperature, which follows the theory of thermal expansion.
A reason for the discrepancy will be due to the nature of the ideal gas law ignoring all interactions between particles, whereas in the simulation there is some Leonard Jones force, which when acting repulsively can push atoms further apart, resulting in a lower simulated density than in the ideal gas law.
Also note that the interactions in liquids are much greater than the interactions in gases, and so to use the ideal gas law for a liquid can quickly become a very crude approximation. It can also be seen that as the temperature increases, the discrepancy between the ideal and simulated densities becomes smaller.
JC: How does the discrepancy between the simulation and ideal gas results change with pressure? You could have chosen a larger difference in pressure to see the trend more clearly. Joining the ideal gas data points with straight lines is misleading as you know that the ideal gas law doesn't follow a straight line (density = 1/T).
Heat Capacity Calculations
The heat capacity to volume ratio versus temperature is plotted below. Theoretically, heat capacity will decrease with increasing temperature and increase with respect to increasing density, as there will be more molecules per unit volume that needs to increase in energy.

JC: Can you expand on this, why do you expect these trends theoretically?
Radial Distribution Functions
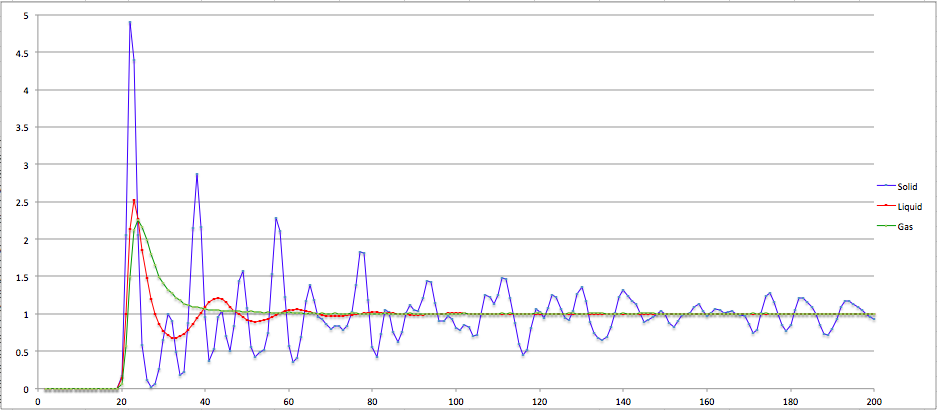
The radial distribution functions of a Leonard-Jones system in the solid, liquid and gas phase are distinctly different. This is due to the degrees of freedom that exist in each particular phase. In the solid phase, all the atoms are locked into a lattice structure, having only vibrational motion, with both long-range and short range order.
Liquids have more degrees of freedom, with no long-range order. They also exhibit rotational and to some extent translational motion. Then gases have the most freedom of all states, having a much larger translational motion.
From the RDF graph it can be seen that the solid function has a very distinct function with peaks and troughs. This is due to its atoms being fixed into a lattice with long-range order. For the liquid, there is a few peaks and troughs, representing the short range order of particles immediately surrounding the central particle, then averaging out to 1 - the system density. For the gaseous phase, the curve very quickly tends to the average value of 1, as there is no short- or long-range order in this phase.
JC: How can rotational motion alter the RDF considering that the simulations are of spherical particles?
From the curve for the solid the first 3 peaks at increasing distance can be attributed to the different lattice points in the fcc lattice about the original atom. For an atom on the corner of a cube, the 3 distances represent an atom at an adjacent vertex, an adjacent face, and an opposing face. These occur at a reduced distance of 1.06, 1.48 and 1.83 respectively. These agree with the distances noted on the graph. The coordination number can be deduced from the running integral of the curve and for the 3 peaks are given by 11, 6 & 24 respectively.
JC: Show the running integral graph and how you calculated at what distance the first 3 peaks should appear at. Can you calculate the lattice parameter from the RDF?
Dynamical Properties and the Diffusion Coefficient
The Diffusion Coefficients of a simulated gas, liquid and solid were calculated using several different methods:
1) From the Mean Squared Displacement (MSD) of 8,000 simulated atoms, according to the equation
2) From the MSD of a million atoms
3) From the Velocity Autocorrelation Function (VACF), by integration.
4) From the VACF of a million atoms
The results were as follows:
| Timestep | Error in Displacement (absolute values) |
|---|---|
| 0.01 | 0.000006 |
| 0.05 | 0.0005 |
| 0.075 | 0.002 |
| 0.1 | 0.005 |
| 0.15 | 0.08 |
| State | From MSD (thousand atoms) | From MSD (million) | From VCAF (thousand atoms) | From VCAF (million) |
|---|---|---|---|---|
| Solid | ||||
| Liquid | ||||
| Gas |
We can see from the table that the diffusion coefficients calculated from the same number of atoms agree very well with each other, which suggests that the results are quite precise. However, we can assume that the million atoms simulations inevitably provide more accurate data.
The results also make sense logically, where the gas have the highest diffusion coefficient (they are able to diffuse much faster) than the liquid, and the diffusion coefficient of the solid is close to 0.
Mean Squared Displacement
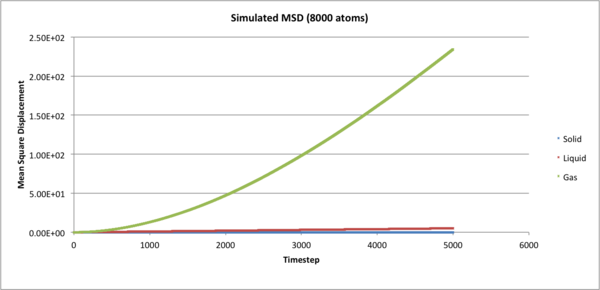

From the graphs it can be concluded that the final 1000 timesteps follow linearity with which to apply the equations, and thus the diffusion coefficients can be calculated from the last timesteps.
JC: Show the lines of best fit on the graphs. Why does the gas MSD begin as a curve (ballistic motion).
Velocity Autocorrelation Function
Starting from a 1D Harmonic Oscillator:
Differentiating gives the velocity function:
Substituting into the integrated form of the VAFC:
Then, using the trigonometric identity
is a constant, thus and can be taken out of the integral.
can cancel out:
Since is an odd function and is an even function, is odd.
is an odd function (While the value of can change whether or not the functions are even or odd, it shifts both functions by the same amount and the resulting will still be odd)
JC: Good, clear derivation.
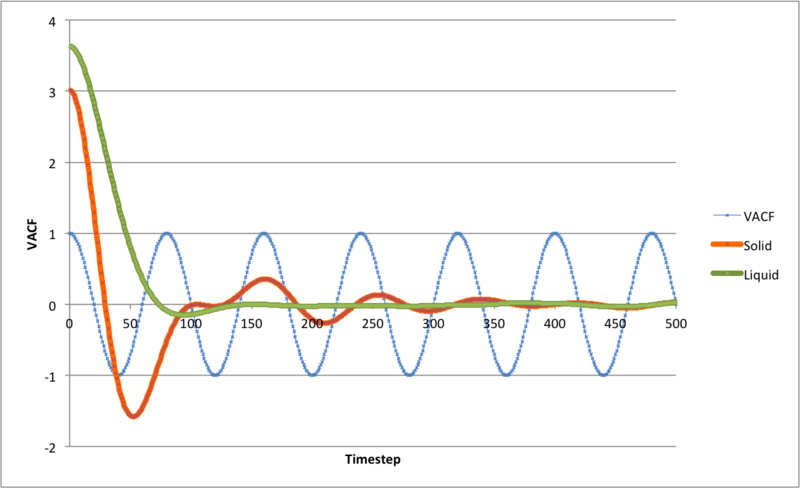
From the graph note that the liquid VACF tends quickly to zero, and the solid has small fluctuations. The difference arises as the in the liquid phase the particles have more translational freedom and can collide, exchanging energy between particles. Solid phase atoms retain a relatively static position around their equilibrium position. Also the solid rate will decay slower than in liquids.
For the harmonic oscillator, the VACF will not decay to zero as the there are atoms exchanging with their neighbours, which do not occur in harmonic oscillation.
JC: The running integral plot has not uploaded properly. What does the minimum in the solid VACF represent physically?
The values for D from the VCAF model were greater in magnitude than those from the MSD calculations. The greatest source of error is most likely to be the use of the trapezium rule instead of an exact integral of each function.

