Talk:MRD:TTCY
Molecular Reaction Dynamics: Applications to Triatomic systems
Exercise 1: H + H2 system
Determination of the TS geometry.
What value does the total gradient of the potential energy surface have at a minimum and at a transition structure? Briefly explain how minima and transition structures can be distinguished using the curvature of the potential energy surface.
The total gradient of the potential energy surface at a minimum must be zero, as a minimum is also defined as a turning point where the gradient = 0. The same goes for the transition state as it is defined as a saddle point. The two points are known as the stationary points.
LT: This is correct.
In order to distinguish between the minimum and the transition structure, one must derive the second derivative of the function. If the second derivative is >0, then it must be a minimum. If the second derivative is <0 then the stationary point is a transition state.
LT: This is incorrect. If your second derivative is >0 you are at a minimum. If your second derivative is <0 then you are at a maximum. A saddle point is one where you have a minimum in the potential energy surface along one axis and maximum along the other axis.
Report your best estimate of the transition state position (rts) and explain your reasoning illustrating it with a “Internuclear Distances vs Time” screenshot for a relevant trajectory.

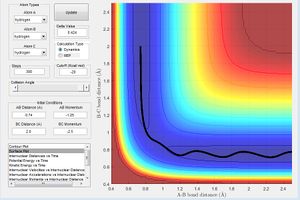
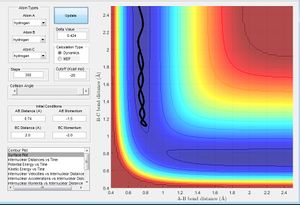
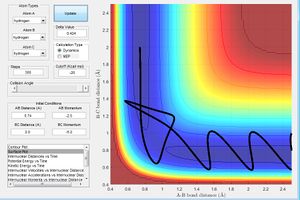
From the initial conditions as shown in figure above, where r1=2.3, r2=0.74, p1=-2.7, p2=0, a crossing point can be seen on the internuclear distance vs time graph, at this point, r1 and r2 are equal at 0.9176 at time = 0.38s, estimating that rts =0.9176 However by animation simulation, it can be seen that the true rts = 0.90775 as shown in the figure below.
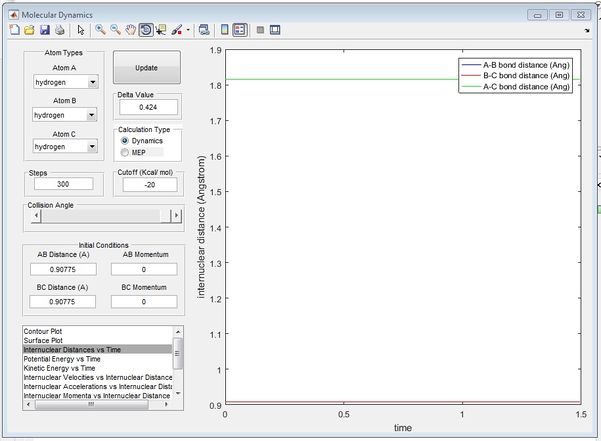
In figure 2, it can be seen that at r1=r2=0.90775, the internuclear distances are no longer varying over time suggesting the absolute transition state position as at transition state, the atoms should be stationary, exhibiting no motion hence no changes in the internuclear disances.
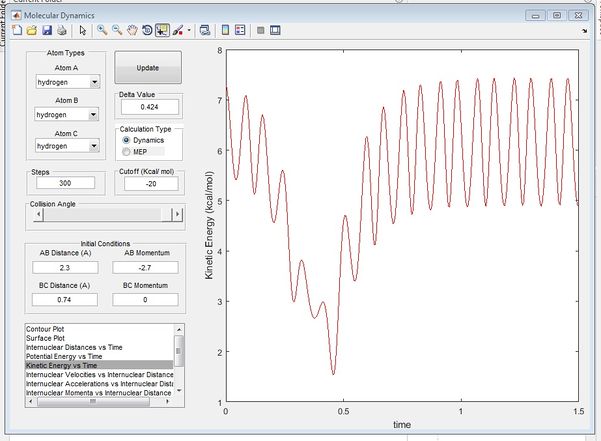
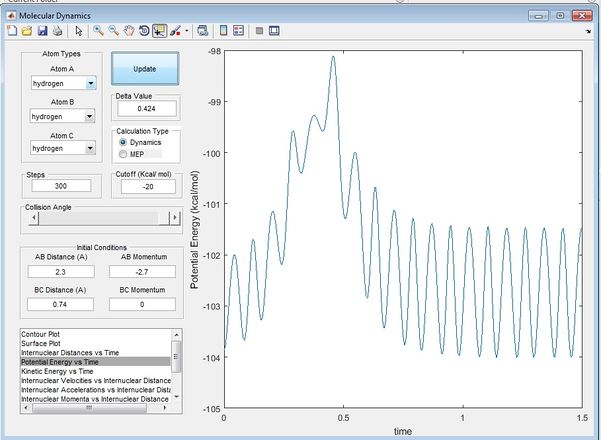
From figure 3 and 4, it can be seen that at time ~0.38s, the kinetic energy of the system is reaching a minimum while the potential energy of the system is reaching a maximum, showing characteristics of transition state, confirming findings from figure 1. Beyong the transition state it can be seen that potential energy is transferred to kinetic energy as the trajectory heads towards the exit channel. The true rts is found by animation simulation and is determined to be 0.90775.
LT: Good.
Trajectories from r1 = rts+δ, r2 = rts
Repeat the calculation with the same initial conditions used to calculate the reaction path, but change the calculation type back to Dynamics.
Comment on how the mep and the trajectory you just calculated differ.

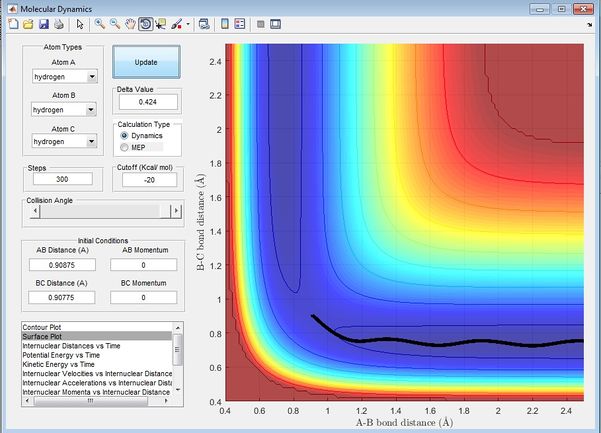
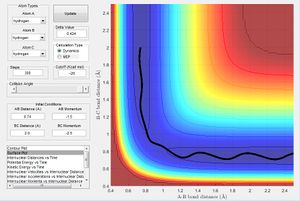
By comparison, it can be seen that in the MEP simulation, the MEP trajectory from the transition state follows the valley point along the minimum point on the trajectory, this is due to the MEP simulation omitting vibrational energy of the atoms, the motion of the atoms is purely dependent on transfer of potential energy to kinetic energy as the atoms go towards the exit channel. Vibrational energy of the atoms is however included in the dynamics simulation therefore it can be seen in figure 6 that the Dynamics trajectory does not follow the bottom of the valley it now possess more energy to travel on either side of the valley due to the vibrational energy of the atoms. producing an oscillatory behaviour.
At large t, r1=0.7452 r2=4.666 p1=1.47 p2 = 2.485
What would change if the reverse of the initial conditions r1 = rts and r2 = rts+0.01 are used instead?
The trajectory would remain the same but towards the other exit channel.
Setup a calculation where the initial positions correspond to the final positions of the trajectory you calculated above, the same final momenta values but with their signs reversed. Observation:
The trajectory heads towards the transition energy from the exit channel as the energy input is now opposite to previously.
LT: Good.
Reactive and unreactive trajectories
LT: Well explained.
State what are the main assumptions of Transition State Theory. Given the results you have obtained, how will Transition State Theory predictions for reaction rate values compare with experimental values?
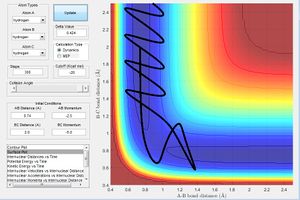
The transition state theory states that as long as a structure reaches its transition state(minimum energy surface), it goes on to form the products. The transition state theory would overestimate the reaction rate values compared with experimental values as for a new bond to form successfully, the incoming atom i.e. Hc in the above cases must first have sufficient energy to cross the transition state but also the right vibrational modes while approaching the already existing bond AB so that the new bond formed possesses a potential energy near the minimum of the potential energy curve (valley of the trajectory). If there's an excess of potential energy, the new bond would form and dissociate immediately, kicking the approaching atom back, hence no reaction occurs.
LT: Is this the only assumption of TST?
EXERCISE 2: F + H2 system
The atoms are changed to F, H and H in the GUI for below simulations
PES inspection
Classify the F + H2 and H + HF reactions according to their energetics (endothermic or exothermic). How does this relate to the bond strength of the chemical species involved?
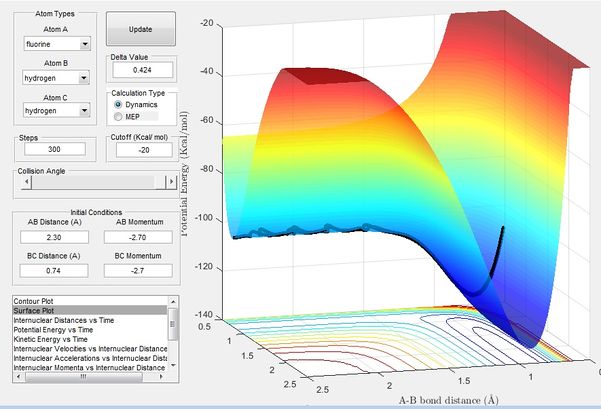
Figure 7 simulates the the reaction of F + H2, it can be seen that the the reaction is extremely exothermic i.e. the exit channel is much lower in energy than the entrance channel. This shows that FH bond is much stronger than a H-H bond.
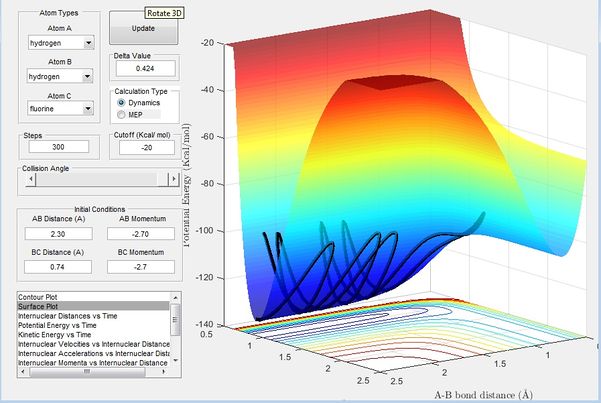
Figure 8 shows the reaction of H + HF. It can be seen here that the reaction is endothermic where the exit channel is much higher in energy than the entrance channel, therefore a significant amount of energy is required for the formation of the new H2 bond, This again shows that F-H bond is much stronger than a H-H bond.
LT: Correct.
Locate the approximate position of the transition state.
It is hard to locate the transition state of the system since one of the activation energies is really low. Hammond's Postulate states that in an exothermic reaction, the structure of the transition state resembles that of its reactants and vice versa for endothermic reactions. Therefore for the exothermic reaction F + H2, the transition state would be closer to the entrance channel rather than the exit channel and can be found by examining the entrance channel as shown in figure 7. Through trial and error near the entrance channel, the approximate transition state was found through animation simulation to be at r1 = 1.80055 and r2 = 0.75050 where r1 is between F-H and r2 is between H-H as shown below in figure 9.
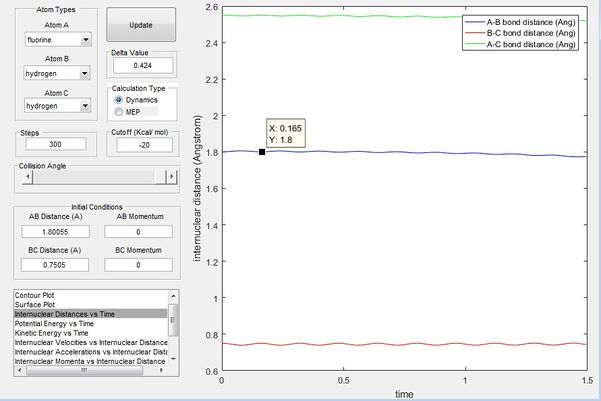
It can be seen from figure 8 that at this approximate transition state there's minimal variation in internuclear distances between all the atoms, showing approximate characateristics of a transition state(maximum on the minimum potential energy surface plot) where the change in bond distances should be 0 since it represents a saddle point where the atoms should remain stationary.
LT: Good.
Report the activation energy for both reactions.
Using the position obtained for the transition state, by offsetting the position of the fluorine atom in relation to the H2 atoms slightly, the activation barrier could be obtained, as the trajectory essentially rolls off the transition state. By offsetting the fluorine atom slightly further away from H2 from the T.S, the activation barrier of the exothermic reaction(F + H2) could be obtained, while by offsetting the fluorine atom closer to H2 from the T.S., the activation barrier of the endothermic reaction(FH + H), this is better illustrated in figure 9.

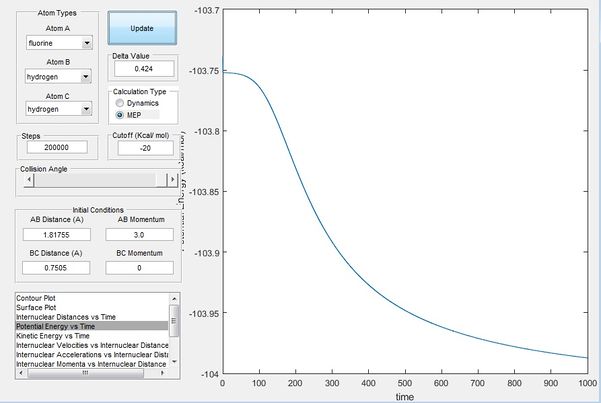
Figure 10 is simulated as the F atom is displaced slightly away from the H2 bond, whereby the trajectory essentially just rolls off the transition state to further separate F and H2, this then gives the activation barrier of F + H2, an exothermic reaction, which is measured to be 0.2 kcal/mol as shown in figure 10.
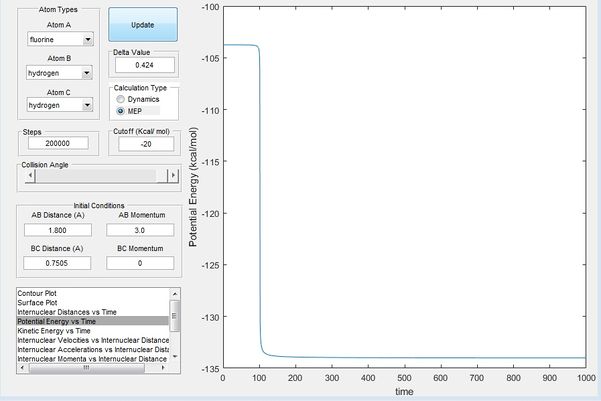
in Figure 11, the fluorine atom is displaced slightly towards H2 this time, and hence the trajectory rolls off the transition state towards FH + H, an endothermic reaction. The activation barrier of this endothermic is then observed to be 30.3 kcal/mol from figure 11.
LT: Figure 9 needs to be cited.
Reaction dynamics
In light of the fact that energy is conserved, discuss the mechanism of release of the reaction energy. How could this be confirmed experimentally?

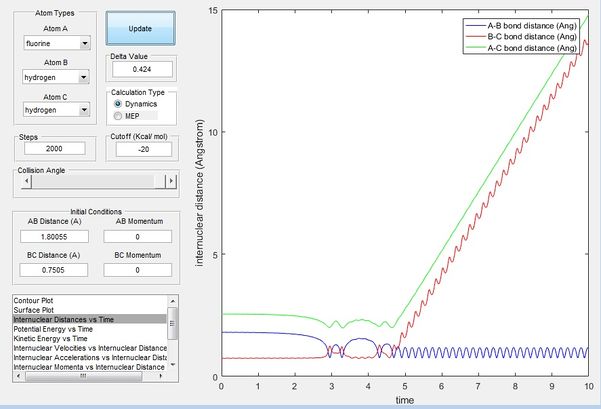
From both figure 12 and 13, it can be seen that the reaction goes through two transition states, as the potential energy peaks twice before settling and forming the new HF bond. The internuclear distance vs time pattern also suggests that the reaction goes through two transition states. As F approaches the H2 atoms, the F-H distance decreases while the H-H bond distance increases as shown at around 3.2 time unit in figure 13, however, a F-H bond does not form instantaneously, as the F atom bounces off therefore the F-H distance increases while H-H bond distance decreases once again. The F atom then approaches the H2 atoms again at around 4.6 time unit with translational energy, and this time a new bond F-H bond is formed while one H breaks off, as explained by the constant distance of the F-H bond and ever increasing distance between H-H in figure 13. The can be confirmed experimentally by calorimetry whereby the amount of heat released can be measured over a small amount of time, the amount of heat varies as the potential energy of the system changes as the reaction progresses and produces a specific pattern, therefore able to confirm our findings.
LT: Missed the point of the question here. A discussion of the fact that if translational energy decreased going from reactants to products it must have been converted to either potential or vibration energy in order to be conserved. Calorimetry is a valid experimental technique. IR valid also.
The cases studied are an illustration of Polanyi's empirical rules. Discuss how the distribution of energy between different modes (translation and vibration) affect the efficiency of the reaction, and how this is influenced by the position of the transition state.
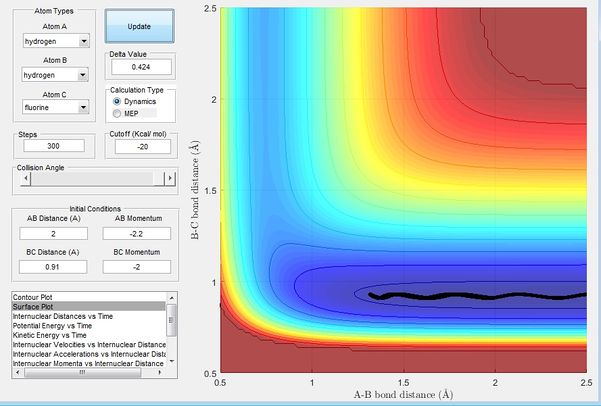
Figure 14 shows initial condition with r1 = 2, r2 = 0.91, p1 = -2.2, p2 = -2
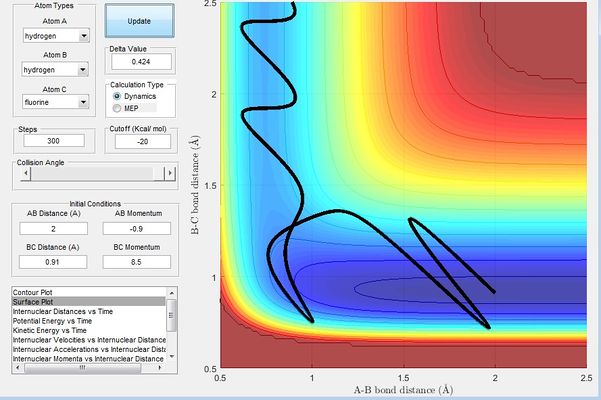
Figure 15 shows initial condition with r1 = 2, r2 = 0.91, p1 = -0.9, p2 = 8.5. A reactive trajectory was obtained by decreasing the momentum of the H atom and increasing the vibrational energy of the HF bond.
The Polanyi's empirical rules states that the vibrational energy is more efficient in promoting a late-barrier reaction than translational energy. H + HF reaction is endothermic and has a late transition state. Figure 14 shows an example of combination of a low vibrational energy and a high translation energy. The H atom moves towards the HF bond with low vibrational energy as the it is cancelled out by the momentum by HF(pHF). Figure 15 shows an example of combination of a low translational energy and high vibrational energy, the overall energy resulting from the momentums of HH and HF means that HF has a high vibrational energy; these two examples obey the Polanyi's empirical rules stating that the vibrational energy is more efficient in promoting a late-barrier reaction than translational energy. This is a consequence of a late-barrier traction where the transition state resembles the products, the opposite would be expected of early-barrier reactions where the translational energy would be expected to be more efficient in promoting the reaction.
LT: Good.

