Talk:MRD:Joseph.H
Molecular Reaction Dynamics
H + H2 system
Question: On a potential energy surface diagram, how is the transition state mathematically defined? How can the transition state be identified, and how can it be distinguished from a local minimum of the potential energy surface?
Answer:
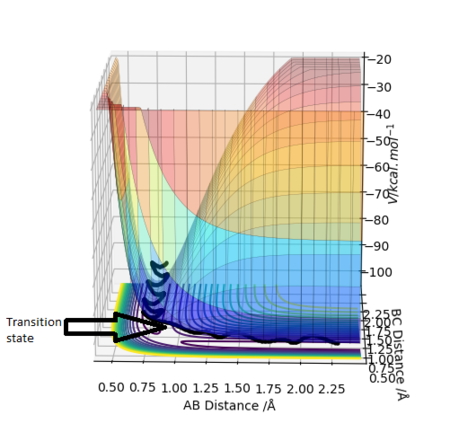
The transition state is defined as the maximum on the minimum energy path linking reactants and the products. It can also be viewed as a saddle point using mathematical terms as it is a maximum in one direction and a minimum in the other. Also at a saddle point on a surface all the first derivatives are zero and the sum of the second derivatives comes to zero. Shown below is the surface plot of the reaction between molecule A-B and C. The arrow shows shows the Transition state which corresponds to a saddle point.
Good, then what about the local minima?.Sw2711 (talk) 13:45, 16 May 2019 (BST)
Question: Report your best estimate of the transition state position (rts) and explain your reasoning illustrating it with a “Internuclear Distances vs Time” plot for a relevant trajectory.
Answer:
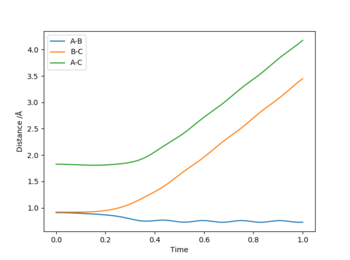
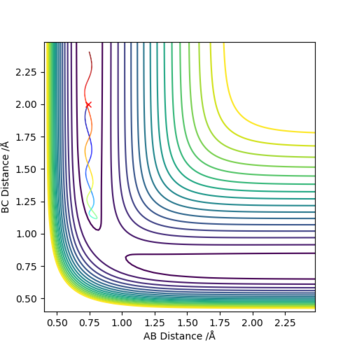
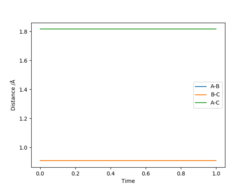
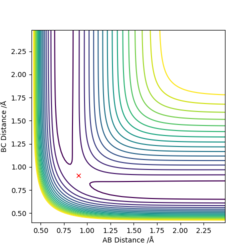
The best estimate for rts was found to be 0.908. The plot to the left below shows inter-nuclear distance against time and when atom A and C are at this distance from atom B there is little oscillation which can only be seen by zooming into the graph (also shown below). This shows that the trajectory will oscillate on the ridge and never fall off. The image to the right shows a contour plot of this reinforcing the idea that 0.908 is a good estimation as the atoms are in the same position and stay on the ridge.
Good, but how did you get the 0.908?Sw2711 (talk) 13:46, 16 May 2019 (BST)
Question: Comment on how the mep and the trajectory you just calculated differ.
Answer:
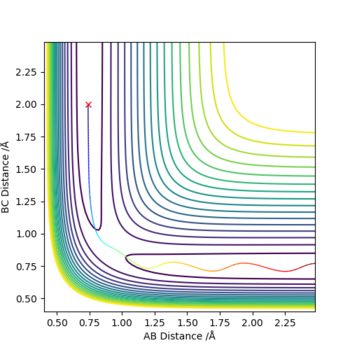
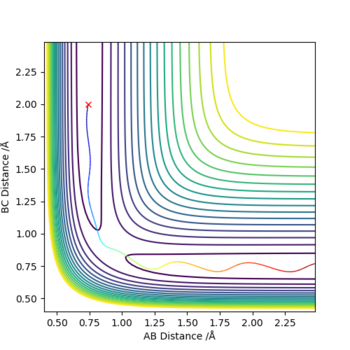
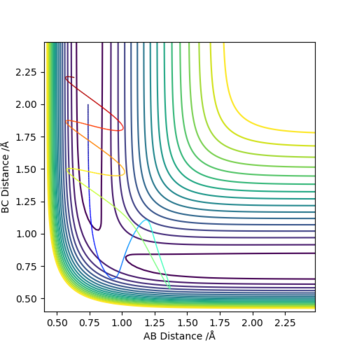
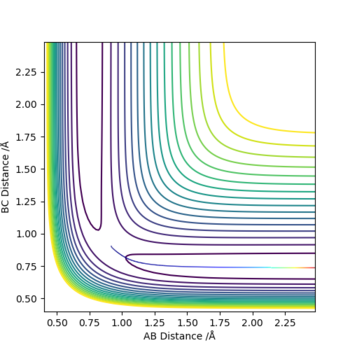
The minimum energy pathway (mep) shown in figure 4 corresponds to infinitely slow motion as momenta/velocities are always reset to zero in each time step. This means the motion of the atoms shown in the mep is not an accurate representation of the atoms in real life. in the H + H2 system atoms have mass and the reaction is carried out in the gas phase and in the gas phase the motion of the atoms will be inertial. Mep doesnt take this into account and assumes the atoms have no mass (which is why it produces a straight line). Running a dynamic calculation (as shown in figure 5) gives a more realistic trajectory than mep.
Good, so why do we need to use MEP sometimes? What does that 'straight line' mean?Sw2711 (talk) 13:49, 16 May 2019 (BST)
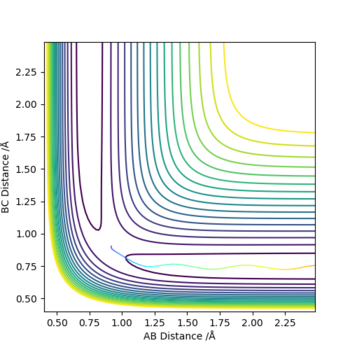
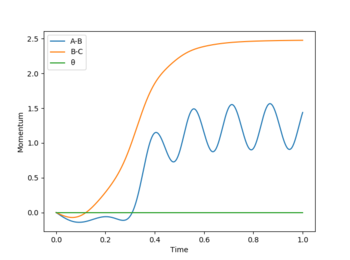
Reversing the initial conditions would result in a flip on the "Internuclear Distances vs Time” and “Momenta vs Time” graphs (as shown below). When time is large we see the distance between B-C increases from 1 to 10 armstrongs and the A-B bond length remains constant as the atoms don't move (approximately 0.75 Å). As time increases momentum also increases overall. As t increases momentum of A-B increases as we are moving from vibrational to translational energy and B-C momentum oscillates as as the reaction occurs its translational energy is turned into vibrational energy.
Reactive and unreactive trajectories:
- For the initial positions r1 = 0.74 and r2 = 2.0, run trajectories with the following momenta combination and complete the table.
Good prediction of the reactivity. However, you'd better explain it in terms of transition state for all cases or energies. Do they have enough energy to overcome the energy barrier? Sw2711 (talk) 13:52, 16 May 2019 (BST)
| p1 | p2 | Etot | Reactive? | Description of the dynamics |
|---|---|---|---|---|
| -1.25 | -2.5 | -99.119 | yes | Graph 1 shows the reaction occurs as the A-B bond length increases then the bond breaks. B-C forms after |
| -1.5 | -2.0 | -100.456 | no | Graph 2 shows that atom C comes close to the A-B molecule but no reaction occurs |
| -1.5 | -2.5 | -98.956 | yes | Graph 3 shows a reaction similar to that of graph 1 but occurs at lower energy |
| -2.5 | -5.0 | -84.956 | no | Graph 4 shows the reaction moving through the transition state and atom B moving from A onto atom C but then moves back onto atom A |
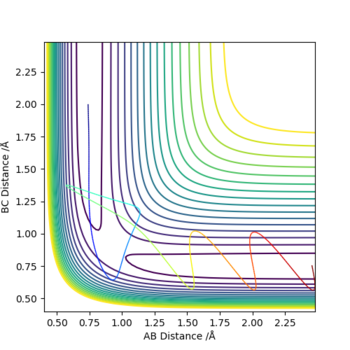
| -2.5 | -5.2 | -83.416 | yes | Graph 5 shows the reaction occurring but a long time is spent in the transition state and atom B goes back and fourth between A and C |
Question: State what are the main assumptions of Transition State Theory. Given the results you have obtained, how will Transition State Theory predictions for reaction rate values compare with experimental values?
Answer:
Transition state theory (TST) helps to explain the rates of reaction for elementary chemical reactions. It gives a qualitative approach to reactions but doesn't work for all reactions as it makes approximations. This theory does not take into account the quantization of molecular vibrations or quantum tunnelling. As the theory neglects theses aspects it assumes that if reagents have enough energy to reach the transition state the reaction will occur but the five graphs above show that this is not true as the reaction reaches the transition state in some but the reaction still doesn't occur. Another assumption is that once the reagents overcome the activation everngy (reach the energy maximum) they cannot turn back into products which is also shown in the graphs above to not be true.
Good. Just be aware there is no quantum tunnelling in our systemSw2711 (talk) 13:55, 16 May 2019 (BST)
F - H - H system
Question: By inspecting the potential energy surfaces, classify the F + H2 and H + HF reactions according to their energetics (endothermic or exothermic). How does this relate to the bond strength of the chemical species involved?
1) F-H + H --> F + H2
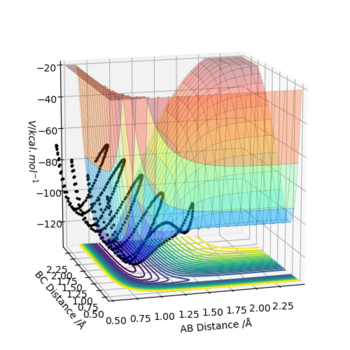
F-H distance: 0.74
H-H distance: 2.00
F-H momentum: -2.5
H-H momentum: -5.2
This shows that this reaction is endothermic as the products are higher in energy than the reactants Good. Just don't forget the units hereSw2711 (talk) 13:57, 16 May 2019 (BST)
2) H-H + F --> HF + H
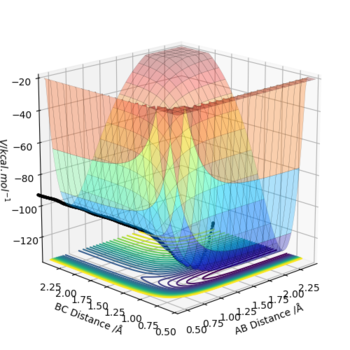
H-H distance: 0.74
F distance: 2.00
H-H momentum: -2.5
F momentum: -5.2
This shows that this reaction is exothermic as the reactants are lower in energy than the products Good.Sw2711 (talk) 13:57, 16 May 2019 (BST)
This shows the H-F bond is stronger than the H-H bond as the reaction in breaking the H-F bond requires lots of energy to be taken in for the reaction to occur
Good.Sw2711 (talk) 13:57, 16 May 2019 (BST)
Question: Locate the approximate position of the transition state
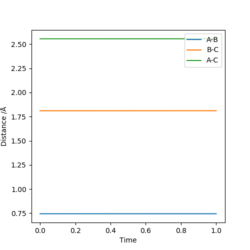
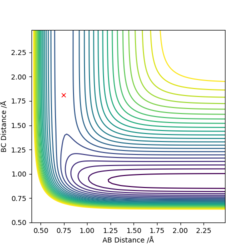 The products of one reaction here are the reactants of the other and so the reactions have the same transition state.
The transition state was located at:
H-H bond distance: 0.747
H-F bond distance: 1.810
A-B momentum: 0
B-C momentum: 0
Good. But it's better to tell me how you find those values.Sw2711 (talk) 13:57, 16 May 2019 (BST)
Activation Energy
The activation energy was found by finding the difference in energy between the transition state and the reactants.
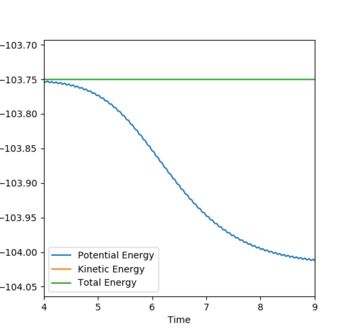 The activation energy for the H2 + F --> HF + F reaction was found to be approximately 2.5 kcal/mol
Repeating this process for the HF + F--> H2 + F reaction the activation energy was found to be approximately 30 kcal/mol
Good. Better to show me the other figure as well. Also. I think it is HF+H. Why do you have HF+F in both cases? Sw2711 (talk) 13:59, 16 May 2019 (BST)
Reaction dynamics
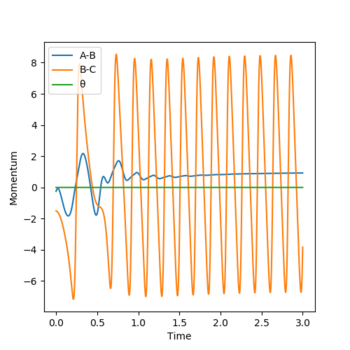
Question: In light of the fact that energy is conserved, discuss the mechanism of release of the reaction energy. Explain how this could be confirmed experimentally
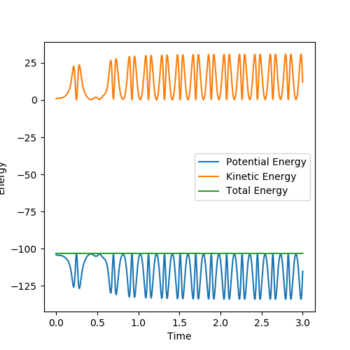
The first graph shows momentum over time and during the reaction we see the momentum of A-B over time level off and this is because B moves further away from A and there is no vibrations between the two.The second graph shows that energy is conserved as potential energy is mirrored by kinetic energy. This means that potential energy is being converted into kinetic energy and kinetic energy is being converted into potential energy. The green line on the graph shows total energy and because it remains constant this proves energy is conserved. The high oscillations could be a result of the H-F bond formation being very high energy. As stated before one reaction is endothermic and the other is exothermic and because heat will be released or taken in depending on the reaction calorimetry could be used to determine this experimentally.
Good.Sw2711 (talk) 14:00, 16 May 2019 (BST)
Momentum
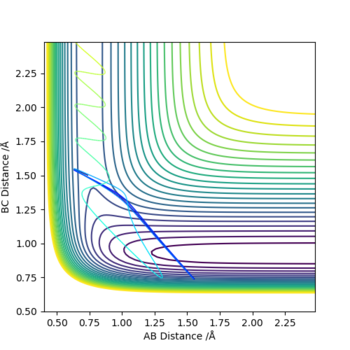
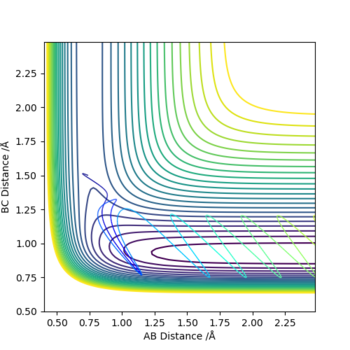
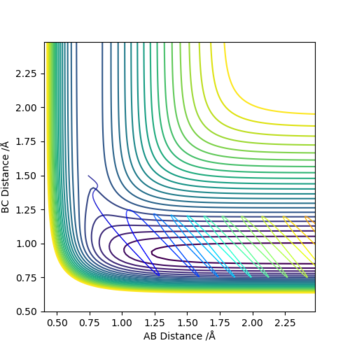
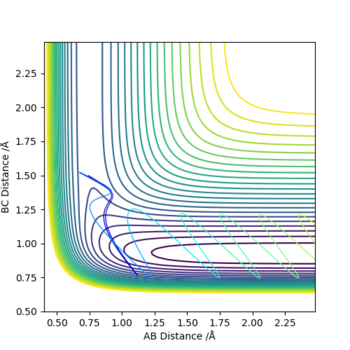
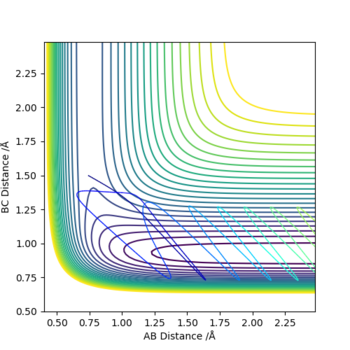
The graphs above show that as the momentum of the H-H bond is increased the reaction is more likely to occur.
H-H bond distance: 0.74
H-F bond distance: 1.50
H-F momentum: -0.5
Keeping the bond lengths the same but changing the H-H momentum to 0.1 and decreasing the H-F momentum from -0.5 to -0.8 led to a slow moving reaction.
Reverse reaction
Initial conditions for the reverse reactions were:
F-H bond distance: 0.74
H-H bond distance: 2
F-H momentum: -0.35
H-H momentum: -7.55
Changing these conditions so that:
F-H bond distance: 0.74
H-H bond distance: 2
F-H momentum: -6.55
H-H momentum: -0.55
means the reactions can successfully happen
Question: Discuss how the distribution of energy between different modes (translation and vibration) affect the efficiency of the reaction, and how this is influenced by the position of the transition state.
Answer:
Translational and vibrational distribution energy affect the efficiency of reactions. The efficiency is dependent on the transition state (whether it be early or late). When we have an endothermic reaction the transition state is late e.g. for the HF + H reaction, vibrational energy affects the efficiency. When we have an exothermic reaction the transition state is early e.g. for the H2 + F reaction, translational energy affects the efficiency.

