Talk:MRD:AS01081008
(Good report. Not sure if you wanted to copy here the complete wiki again. See my inline comments for feedback. Je714 (talk) 10:59, 15 May 2017 (BST) )
Molecular Reaction Dynamics
H + H2 System
Dynamics from the Transition State Region
The transition state (TS) can be observed as the maximum on the minimum energy path. As a maximum, the total gradient, its derivatives with respect to inter-nuclear distances (∂V(ri)/∂ri=0), must equal zero. The minimum must also have a gradient equal to zero. The TS can be considered to be the saddle point of the potential energy surface. As a result, to determine whether a point is a saddle and thus the TS, we use the following equation:
D(x,y) = det(H(x,y)) = fxx(x,y)*fyy(x,y)-(fxy(x,y))2
If D(a,b)<0 then (a,b) is a saddle point and (a,b) is the TS not the minima.
(Yes! Good one. First time I see someone using the derivative of the Hessian. Missing a reference to this, though: this method is called the second partial derivative test (https://www.wikiwand.com/en/Second_partial_derivative_test) Je714 (talk) 10:59, 15 May 2017 (BST))
Locating the Transition State
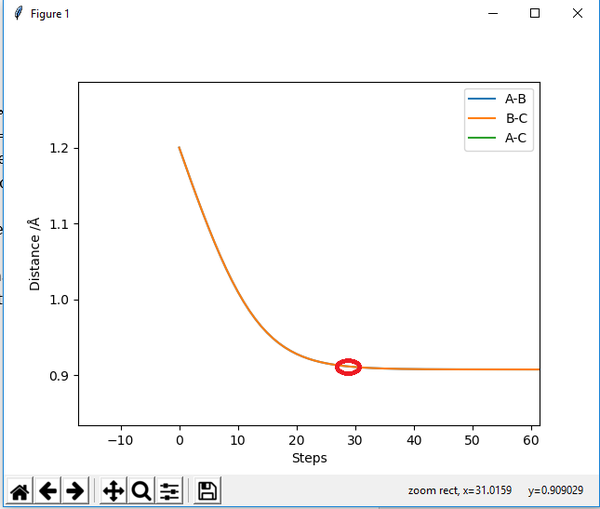
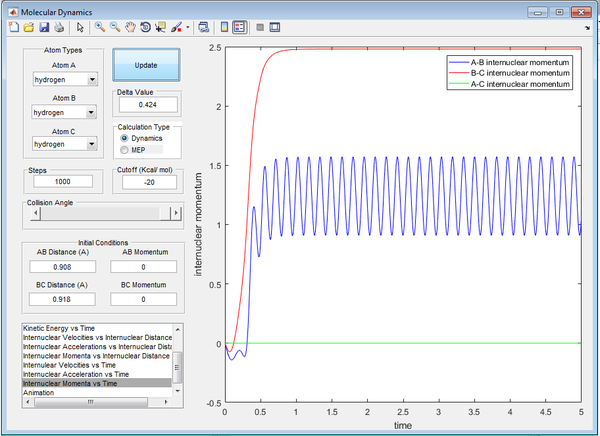
The transition state position is approximately 0.908Å. This was determined using trial and error calculations, varying both inter-nuclear distances, AB and BC, whilst maintaining the condition AB=BC. This condition was held as the system is symmetrical and thus the transition state has equal inter-nuclear distances. The momenta was also kept equal to zero as at the transition state, unless a force is applied, the atoms can be considered to be completely still.
At 0.908Å, the gradient in the Inter-Nuclear Distance vs Time plot (Figure 1.) was approximately zero with minimal vibration. However, this minimal vibration does demonstrate this is not the precise transition state.
(How precise you want to be? This is accurate enough. Remember, the TS is a 0-dimensional point, you can only get infinitesimally close to it. Je714 (talk) 10:59, 15 May 2017 (BST))
Calculating the Reaction Path
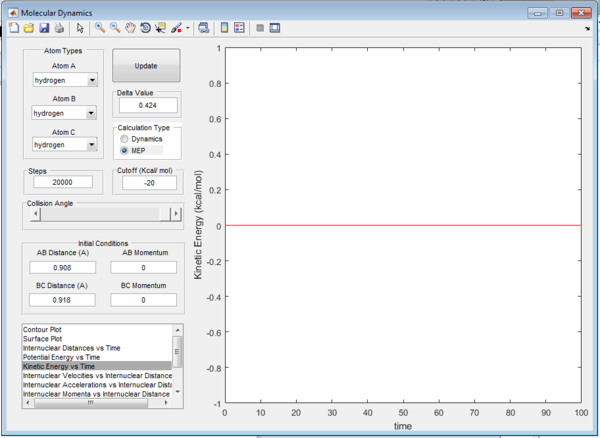
The minimum energy pathway (mep) follows the trajectory with the slowest motion. As can be seen in Figure 2. the mep shows the system as not vibrating, this occurs as a result of the calculation making the velocity zero after every subsequent step. This also results in the kinetic energy being determined as zero, shown in Figure 23., and thus is a false representation of the motion involved.
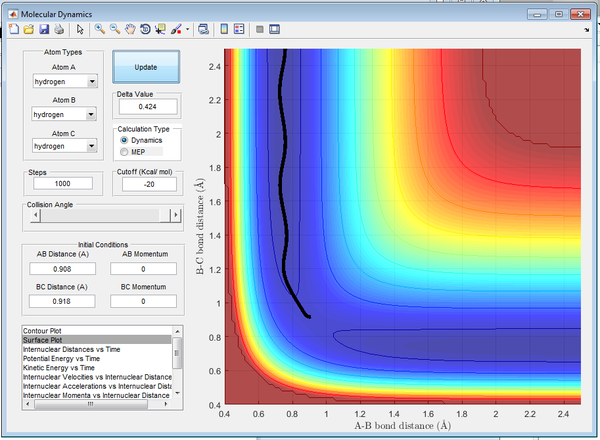
The Dynamics calculation is a more accurate representation of the motion involved; the curvy line demonstrates the vibrations of the atoms shown below in Figure 4..

At 5 seconds, approximate final values of position and momenta are recorded below from Figures 5/6.:
- r1(t) = 18.3Å
- r2(t) = 0.74Å
- p1(t) = 2.49
- p2(t) = 1.25 (Oscillating around)
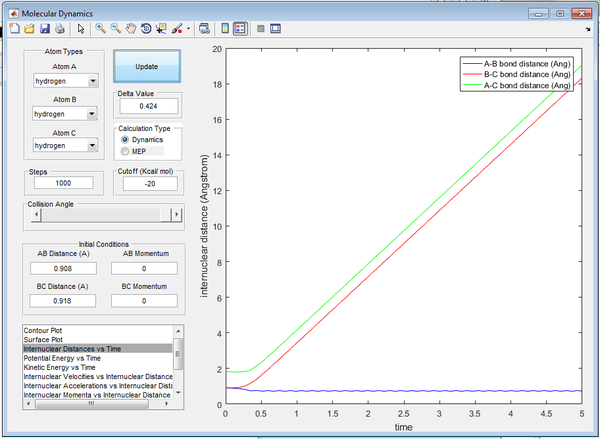
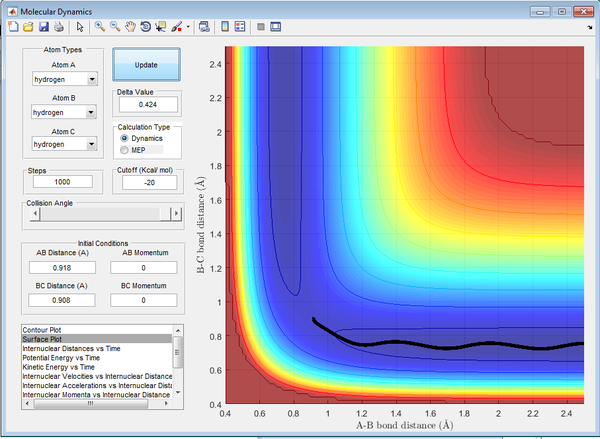
After reversing r1 and r2, the reaction path can be observed to reverse, and as a result the momenta and inter-nuclear positions have also reversed. This would suggest that the displacement from the transition state has caused the atoms to reform the reactants as appose to the products.
Reactive and Un-reactive Trajectories
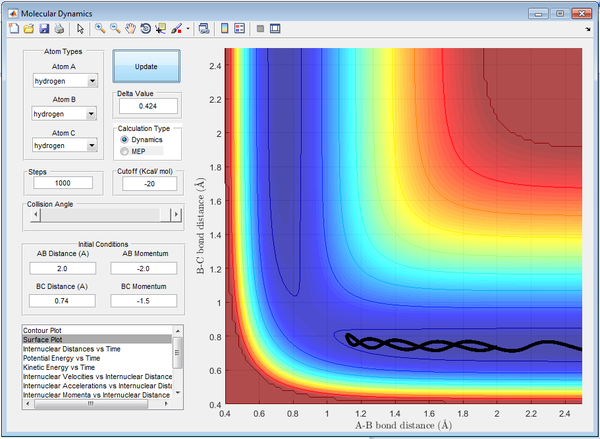
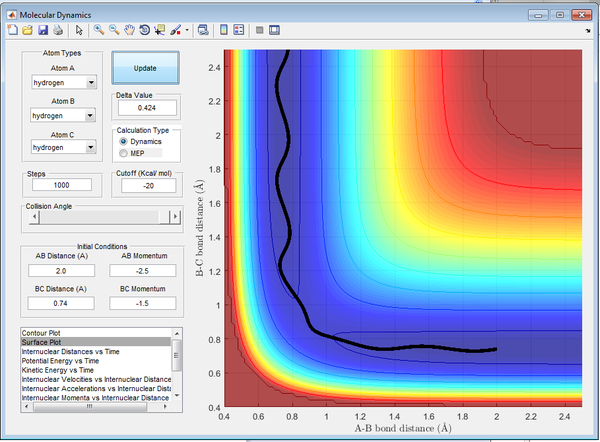
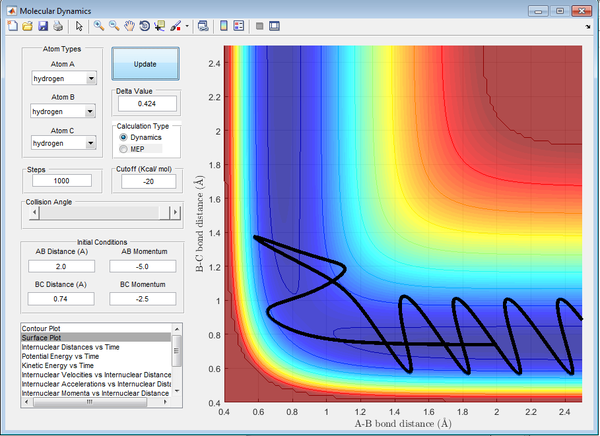
In order to test the hypothesis for initial conditions, trajectories were run varying the momenta of p1 and p2. The resulting trajectories are shown below in Figures 8-12. with the initial conditions included. The results are summarized below in Table 1.
| p1 | p2 | Reactivity | Figure | Description |
|---|---|---|---|---|
| -1.25 | -2.5 | Reactive | 8 | 'A approaches BC, AB diatomic formed and C leaves' |
| -1.5 | -2.0 | Un-reactive | 9 | 'A approaches diatomic BC, insufficient energy, momentum reverses and A leaves in opposite direction' |
| -1.5 | -2.5 | Reactive | 10 | 'A approaches diatomic BC, long transition state observed, then AB diatomic formed and C leaves' |
| -2.5 | -5.0 | Un-reactive | 11 | 'AB diatomic initially formed, then C momentum reverses and reforms original diatomic, A forced away, barrier recrossing observed. ' |
| -2.5 | -5.2 | Reactive | 12 | 'A approaches diatomic BC, AB diatomic formed, C momentum reverses and attempts to reform BC, A then forms AB and forces C to leave' |


Transition State Theory
The main assumptions of Transition State Theory are as follows:
- The atomic motion obeys classical mechanics.
- All 'supermolecules' that pass the TS from the reactant side become products.
- Throughout the reaction the Boltzmann distribution of energy is maintained for the reactants.
- Supermolecules that cross the TS from the reactants have a Boltzmann distribution of energy that correlates to the temperature of the system. 3
Experimental reaction rate values tend to be higher than that determined in theory. This occurs as a result of the activation energy being lower in practice due to alternate pathways that are possible through tunneling in quantum theory. Transition State Theory is disproved above as demonstrated by Figure 11. The reactants cross the transition state (saddle point), however do not go onto form the products. The atoms 'bounce back' via barrier recrossing and reform the reactants.
F - H - H system
PES Inspection
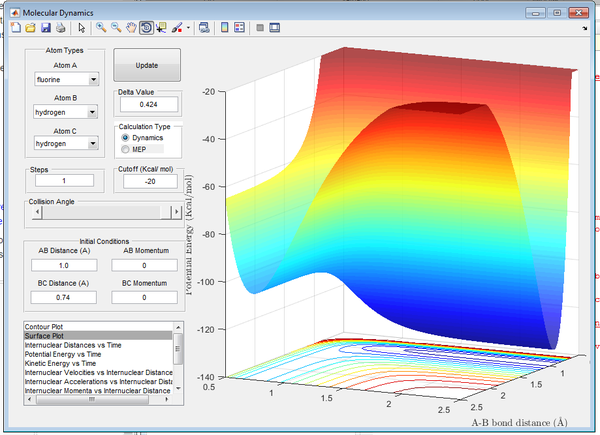
The surface plot in Figure 13. demonstrates the highly exothermic nature of the formation of H-F. This reaction is especially exothermic due to the large H-F bond strength, the H-F bond is especially strong due to the polar nature of the diatomic. This results in a large ionic contribution. As a result the transition state is observed to have a very low activation energy, and the potential energy drops sharply after the transition state, this is considered an attractive potential energy surface.
As the forward reaction is exothermic, the reverse (forming H2) must therefore be endothermic.
Transition State
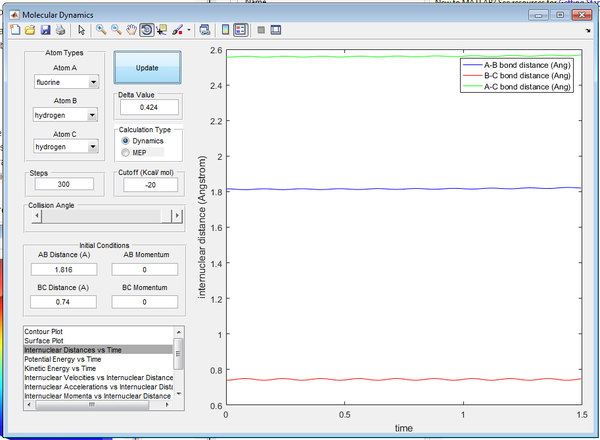
The approximate position of the TS was determined to be:
- r1 = 1.816Å
- r2 = 0.74Å
Activation Energy
The activation energies for the exothermic and endothermic reaction are shown below.
- Exothermic Activation Energy = 0.5 Kcal/mol
- Endothermic Activation Energy = 30.5 Kcal/mol
These values were determined by finding the difference between the nminimum and maximum (TS) energies of the minimum energy pathway.
(The exothermic Ea is not accurate enough. It's actually ~0.27 kcal/mol. You could have reported a better answer by running a sufficiently long MEP calculation starting slightly off the TS geometry pointing towards the reactants. Je714 (talk) 10:59, 15 May 2017 (BST))
Reaction Dynamics
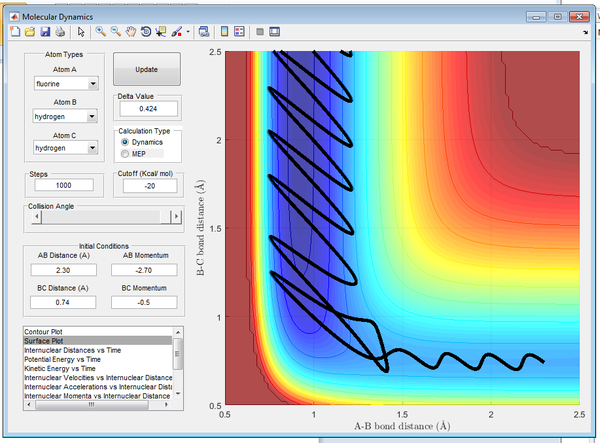
Initial reaction conditions were set up using:
- r1 = 0.74
- r2 = 2.3
- p1 = -0.5
- p2 = -2.7
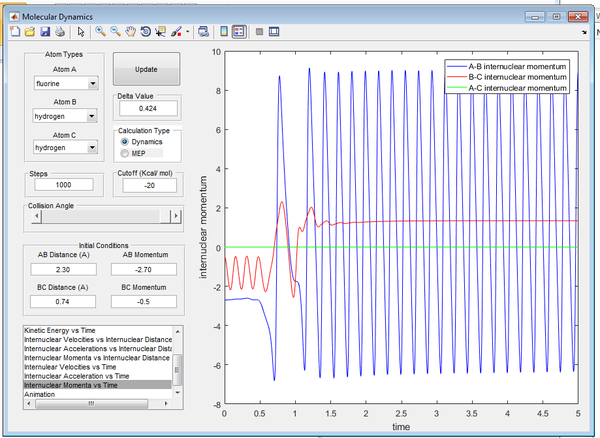
The conditions resulted in a successful reaction that produced a HF molecule that had large momenta. The trajectory and the inter-nuclear momenta of the reaction are shown below in Figures15/16.
The mechanism of release of the reaction energy involves the atoms gaining kinetic energy, as the atoms approach one another the energy is converted to potential energy, up to a maximum. As the TS is passed the energy is converted into vibrational energy of the diatomic product, this results in large frequency of oscillation. This could be confirmed experimentally via IR vibrational spectroscopy.
(How, though? Just stating that you would use IR spectroscopy alone is not enough -- a bit more detail is needed. What vibration would you follow to monitor the reaction? Also, what about calorimetry? That could also be used. Je714 (talk) 10:59, 15 May 2017 (BST))
Polanyi's Empirical Rules
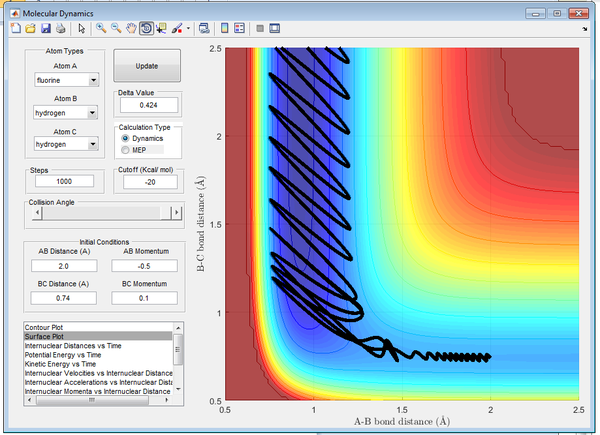
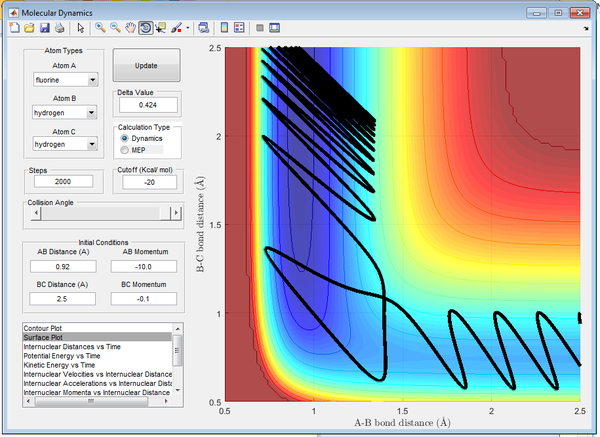
Polanyi's Empirical Rules states vibrational energy favours reactions with a late barrier and that translational energy favours reactions with an early barrier. Thus for the H2 + F reaction with an early TS, the reaction favours translational energy; it is more likely to be successful if the reactants have low vibrational energy. Alternatively the HF + H reaction with a late TS the reaction favours vibrational energy and thus is more likely to be successful with high vibrational energy.
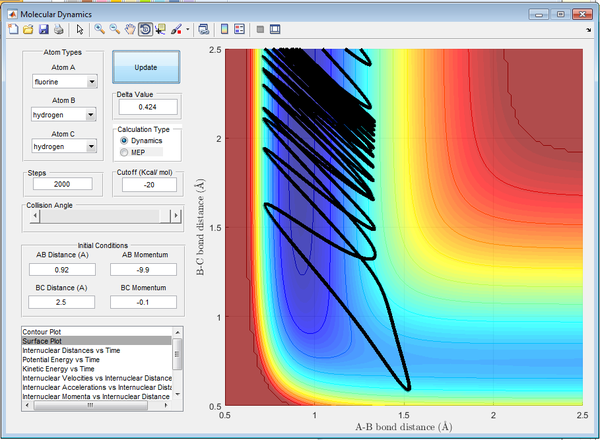
This is demonstrated below in Figures 17-20, where all factors are kept constant excluding vibrational frequency of the diatomics. In Figure 17 there is a small H2 momentum, as a result the H2 molecule has low vibrational energy and the reaction is successful. In Figure 18 there is a large H2 momentum, as a result the H2 molecule has high vibrational energy and the reaction is successful.
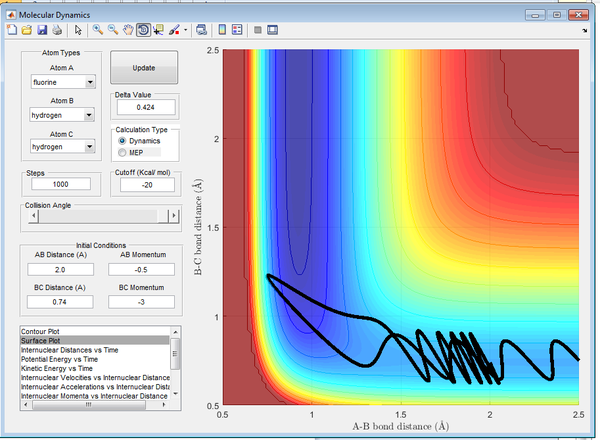
In Figure 19 there is a larger HF momentum, as a result the HF molecule has larger vibrational energy and the reaction is successful. In Figure 20 there is a smaller HF momentum, as a result the HF molecule has lower vibrational energy and the reaction is successful.
(Good job relating the empirical rules to your results as examples. Je714 (talk) 10:59, 15 May 2017 (BST))
References
- 1. Atkins P, De Paula. J, Atkin's Physical Chemistry, 8th Edition, 2006, Ch. 25,27, Oxford University Press.
- 2. Levine D, Molecular Reaction Dynamics, Ch. 5, 2005, Cambridge University Press.
- 3. Levine I, Physical Chemistry, Ch.22, 2009, 6th Edition, Pages 887-889
