
Talk:MRD:01389684
H + H2 system
Transition State Properties

The transition state can be mathematically defined as the point at which ∂V(ri)/∂ri=0, where (ri) = (rAB) = (rBC) . On a potential energy diagram the transition state is defined as the maximum on the minimum energy path, linking the reactants and products. This is also called the saddle point. If a rolling sphere were to be placed on the potential energy surface then the transition state could be identified by starting a trajectory near to the transition state and seeing whether sphere would roll towards the reactants or products. Therefore if you were to start a trajectory at the transition state, then with no initial momentum the sphere would stay there forever.
The transition state can be distinguished from a local minimum on the potential energy surface by drawing a tangent at the inflection point of the minimum energy path. The first and second derivative of this tangent would be ∂V/∂rBC=0=qBC and ∂V2/∂qBC 2 < 0 respectively, the second derivative would therefore give you a maxima. If you were to draw an orthogonal tangent to qBC and call it qAC and take the first and second derivatives of this then you would get a minima. This therefore shows the saddle point of the curve and therefore the transition state.

Well done. However, the last sentence is incomplete, how would the second partial derivative prove that you are at the local minimum? And it’s the second partial derivative. Also, for good practise, you shouldn’t mix up terms A, B and C are already defined as the reactants, it will be best to define the vectors as something else seen as only one vector is in the reaction path. Sf3014 (talk) 18:34, 21 May 2019 (BST)
Due to the H + H2 system being symmetric, at the transition state, r1 and r2 will be the same. Since there is no gradient orthogonal to the ridge, r1=r2, if a trajectory was started on the ridge, the trajectory would just oscillate on the ridge and never fall off. A plot of inter-nuclear distances vs time with a random value for r1 and r2 was plotted. The B-C line was zoomed in on and the mid-point between the peak and trough was taken and input as the new r values. This was repeated three times to give a rts value of 0.9077 Angstroms.
Well done, it’s also good to show your workings through a graph or two for a reference to your statement. Sf3014 (talk) 18:34, 21 May 2019 (BST)
A minimum energy path of a reaction will always reset the momenta of each particle to zero at each time step. Therefore the MEP contour plot will produce a straight line instead of an oscillating line as there will be no vibrations of the molecules. The MEP plot will also have a shorter trajectory due to momenta and therefore energy being lost at each time step.
Good comparison. Sf3014 (talk) 18:36, 21 May 2019 (BST)
| Dynamic | MEP |
|---|---|
 |
 |
| p1 | p2 | Etot | Reactive? | Contour Plot | Description of the Dynamics |
|---|---|---|---|---|---|
| -1.25 | -2.5 | -99.018 | yes |  |
This reaction has enough energy to overcome the activation barrier and therefore the trajectory goes through the transition state, the B-C bond breaks and the A-B bond forms. |
| -1.5 | -2 | -100.456 | no |  |
This reaction doesn't have enough energy to overcome the activation barrier and therefore the trajectory doesn't go through the activation barrier. |
| -1.5 | -2.5 | -98.956 | yes |  |
This reaction has enough energy to overcome the activation barrier and therefore the trajectory goes through the transition state, the B-C bond breaks and the A-B bond forms. |
| -2.5 | -5 | -84.956 | no |  |
This reaction went through the transition state and formed the products however the trajectory then reverted back to the reactants. |
| -2.5 | -5.2 | -83.416 | yes |  |
This reaction went through the transition state and formed the products, then the trajectory reverted back to the reactants and then reformed the products. |
This table shows that the higher the Etot the more likely the energy will be higher than the activation energy and therefore the reaction will go to completion. However in the last two examples the energy was higher than the activation energy but the penultimate set of conditions did not form the products. This therefore means that something other than the activation energy affects the outcome of the reaction.
Transition state theory explains the reaction rates of elementary chemical reactions by showing the reaction proceeding through a hypothetical transition state/activated complex which is between the reactants and products. The transition state theory has three key assumptions:
1. The energy of the particles follow a Boltzmann distribution
2. The transition state structure and reactants are in constant equilibrium
3. Once reactants become the transition state, the transition state structure does not revert back to the reactants
The last two set of conditions showed a case of barrier crossing. The reactants went through the transition state but then reverted back to the reactants. The transition state theory would not allow for this, therefore the theoretically calculated reaction rate value would differ from the experimental value. Very good observation on your table of trajectories and comparison to transition state theory (TST). How will the reaction rate differ in comparison to TST and your trajectories?. Sf3014 (talk) 18:36, 21 May 2019 (BST)
F-H-H System
The H2 + F forward reaction is exothermic as the reactants are higher in energy than the products and therefore the HF + H reaction is endothermic. This therefore implies that the H-F bond is stronger than the H-H bond.This can be seen in the surface plot.

Good, but what are you referring to when you stated the reaction energies? Must refer to graph that you provided. Also, it would be good if you compared your statement on the bond energies to the reported values for the bond energies of HF and H2. Sf3014 (talk) 18:40, 21 May 2019 (BST)
An approximate position of the transition state was found to be AB= 1.808Å and BC=0.745Å. A MEP contour plot was used to find the point at which the trajectory stays at the transition state when there is no momentum, the saddle point. This can be seen in the contour plots shown.
-
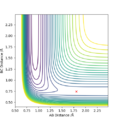 Contour plot of trajectory
 -
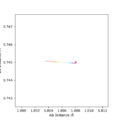 Contour plot of trajectory zoomed in


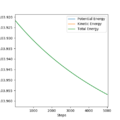
An energy vs time graph was used to calculate the activation energy. The conditions were set to be slightly different to the transition state energy conditions which would therefore show the product energy and the transition state energy. The difference equals the activation energy which equals 29.685 kcal/mol for the HF + H reaction. The activation energy for the H2 + F reaction was found to be 0.036 kcal/mol.
-
 Energy vs time graph to show the activation energy of HF+F
 -
 Energy vs time graph to show the activation energy of H2 +F (zoomed in)


Well done, but how was the initial conditions slightly different to the transition state position?. Sf3014 (talk) 18:40, 21 May 2019 (BST)
To get a complete reaction between H2 and F the initial conditions were set to:

HH distance- 0.74Å
HF distance- 2.3Å
HH momentum- -1.9
HF momentum- -2.2
The energy vs time graph shows a mirror image between the potential energy and the kinetic energy. This therefore means as the potential energy increases, the kinetic energy decreases and vice versa. This shows the conservation of energy. Overall, the potential energy decreases during the reaction and the kinetic energy increases. The increase in kinetic energy correlates with the reaction being exothermic and it being released as heat energy. With heat energy being released, a calorimetry experiment could be done as this experiment can effectively measure the change in temperature during the course of a reaction.
Polanyi's empirical rules state that more vibrational energy than translational energy is more efficient in promoting a late-barrier reaction (a transition state resembling the products) whereas more translational energy than vibrational energy is more efficient in promoting an early-barrier reaction.
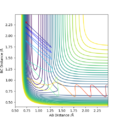
The H2 + F reaction is exothermic and so has an early transition state therefore according to Polanyi's rules, there should be more translational energy than vibrational. This was then tested. In this case, rHH momentum corresponds to vibrational energy and rHF momentum corresponds to translational energy. The figure on the left shows conditions with high vibrational energy and low translational energy, this reaction was incomplete. The figure on the right shows a contour plot with conditons of high translational energy and low vibrational energy, this reaction went to completion and therefore is an efficient reaction.
-
 Contour plot of incomplete H2 + F reaction
 -
 Contour plot of complete H2 + F reaction


The HF + F reaction is endothermic and so has a late transition state therefore according to Polanyi's rules, there should be more vibrational energy than translational. In this case, rHH momentum corresponds to translational energy and rHF momentum corresponds to vibrational energy. The left figure shown shows high translational energy and low vibrational energy, this reaction was incomplete whereas the right figure shows high vibrational energy and low translational energy and this reaction went to completion, therefore it is an efficient reaction. These reactions follow Polanyi's Rules.
-
 Contour plot of incomplete HF + F reaction
 -
 Contour plot of complete HF + F reaction


Very good. Next time it will be best if you include the initial values of each trajectory and included references for Polanyi’s rules. Sf3014 (talk) 18:40, 21 May 2019 (BST)