Talk:MDS:Yiming Xu
You've certainly made some effort here and what you've done has been good although quite a few of your explanations need a bit of refinement and your report style needs some work before moving onto BSc/MSci projects. Ensure you're delivering a theme and always deliver to that theme! Read through the comments and ask me if you have any queries. Also be careful of grammar - read through your work carefully prior to submission. Mark:63/100
Abstract
This isn't really an abstract - sum up what you've done i.e. calculate diffusive and dynamic properties of phase under varying thermodynamic conditions. What results did you get? What's the summary of your conclusions?
Molecular dynamics simulation is an important tool to give macroscopic properties from microscopic interactions. A simple simulation of neutral partciles - a Lennard-Jones fluid can be carried out. The simulation was able to calculate the various behaviours of a model LJ fluid at different density and temperature conditions. The results was also used to illustrate the heat capacity and diffusion of the system.
Questions and Answers
Questions 1
TASK: For a single Lennard-Jones interaction, , find the separation, , at which the potential energy is zero. What is the force at this separation? Find the equilibrium separation, , and work out the well depth (). Evaluate the integrals , , and when .
For the standard Lennard-Jones potential:
| (1) |
To find for the separation distance with a potential of 0, we set:
As , we have . I wouldn't say as a result of r being a member of pos reals that r_0 = sigma... In addition, as .
Given that , we can the first derivative of :
| (2) |
At , where ,
For equilibrium separation at , . Setting eq (2) to 0 at , we have:
Solving for , we have , with a corresponding well depth
For , we have . Thus:
Tick
Questions 2
TASK: Estimate the number of water molecules in 1 ml of water under standard conditions. Estimate the volume of 10000 water molecules under standard conditions.
Under standard conditions, the density of water is 0.9970 g/ml.[1]. As the molar mass of water is 18.015 g/mol, there are 0.05534 mols (3.3326528 x 10²²) water molecules in 1 ml of water.Tick
Similarly, 10000 water molecules has a mass of 2.0959 x 10⁻¹³ g, and occupies 2.1022 x 10⁻¹³ ml.Tick
Questions 3
TASK: Consider an atom at position (0.5, 0.5, 0.5) in a cubic simulation box which runs from (0, 0, 0) to (1, 1, 1). In a single timestep, it moves along the vector (0.7, 0.6, 0.2). At what point does it end up, after the periodic boundary conditions have been applied?
From (0.5, 0.5, 0.5), after a step of (0.7, 0.6, 0.2), it will end up at (1.2, 1.1, 0.7) without periodic boundary conditions (PBC). With PBC, any coordinate > 1.0 will be translated by 1.0 to the negative direction, and it will end up at (0.2, 0.1, 0.7).Tick
Questions 4
TASK: The Lennard-Jones parameters for argon are σ = 0.34 nm, ε/kB = 120 K. If the LJ cutoff is r* = 3.2, what is it in real units? What is the well depth in kJ mol-1? What is the reduced temperature T* = 1.5 in real units?
The real units of radius for LJ cutoff can be converted as , thus:
The absolute well depth is given by
The real units of temperature can be converted as Tick
Questions 5
TASK: Why do you think giving atoms random starting coordinates causes problems in simulations? Hint: what happens if two atoms happen to be generated close together?
The atoms may be too close together than expected from their interactions, or even directly overlapping. In addition, there may be arbitrary large gaps that do not exist in actuality.Tick but larger gaps are not such an issue as they even out over equilibration
Questions 6
TASK: Satisfy yourself that this lattice spacing corresponds to a number density of lattice points of 0.8. Consider instead a face-centred cubic lattice with a lattice point number density of 1.2. What is the side length of the cubic unit cell?
In a simple cubic lattice, each unit cell has 1 atom, and the number density can be found as:
Tick
In a face-centred cubic lattice, each unit cell has 4 atoms. With a lattice point number density of 1.2, the unit cell side length will be:
Tick
Questions 7
TASK: Consider again the face-centred cubic lattice from the previous task. How many atoms would be created by the create_atoms command if you had defined that lattice instead?
For a box of 10x10x10 unit cell of a FCC lattice, there will be 4000 atoms.Tick
Questions 8
TASK: Given that we are specifying and , which integration algorithm are we going to use?
We will be using the Velocity Verlet Algorithm.Tick
Questions 9
TASK: The second line (starting "variable timestep...") tells LAMMPS that if it encounters the text ${timestep} on a subsequent line, it should replace it by the value given. In this case, the value ${timestep} is always replaced by 0.001. In light of this, what do you think the purpose of these lines is?
By using a variable n_steps, the computer is able to automatically calculate how many steps it requires to run to get to 100 unit time. and what's unit time? what's the unit of timestep? Otherwise, by specifying a fixed number of steps, the program will either simulate to a different total time, or we have to manually calculate how many steps it would take.In our code, we don't calculate varying total times - this is constant. We calculate how many steps we need, for a given timestep, to achieve the same total time as a simulation with a different timestep. This question is more general.. why do we define variables?
Questions 10
TASK: Make plots of the energy, temperature, and pressure, against time for the 0.001 timestep experiment (attach a picture to your report). Does the simulation reach equilibrium? How long does this take?When you have done this, make a single plot which shows the energy versus time for all of the timesteps (again, attach a picture to your report).
Choosing a timestep is a balancing act: the shorter the timestep, the more accurately the results of your simulation will reflect the physical reality; short timesteps, however, mean that the same number of simulation steps cover a shorter amount of actual time, and this is very unhelpful if the process you want to study requires observation over a long time. Of the five timesteps that you used, which is the largest to give acceptable results? Which one of the five is a particularly bad choice? Why?
The largest time step to give acceptable results is 0.0025. As can be seen from the graph, It produces nearly identical results with the lower timestep of 0.001. The timestep of 0.015 is a bad choice as the energy appears to diverge over time.Where is this graph? Why does 0.015 'diverge'? Blow-up.
Questions 11
We need to choose so that the temperature is correct if we multiply every velocity by . We can write two equations:
| (3) | |||
| (4) |
Solve these to determine .
We have from eq (4)ː
Rearranging,
Substituting eq (3) to LHSː
Rearranging, we obtain Tick
Questions 12
TASK: Use the manual page to find out the importance of the three numbers 100 1000 100000. How often will values of the temperature, etc., be sampled for the average? How many measurements contribute to the average? Looking to the following line, how much time will you simulate?
The three numbers are Never, Nrepeat and Nfreq. In this case, every 100th values of the preceding 1000 x 100 = 100000 values are used for the average, which is reported on every 100000th timestep. This isn't clear... ask
As only 100000 timesteps are run, the average of the every 100th value is reported. 100000 timesteps with a timestep of 0.0025 fs will give a total time of 250 fs.
Questions 13
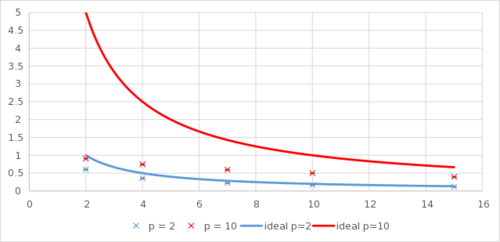
TASK: When your simulations have finished, download the log files as before. At the end of the log file, LAMMPS will output the values and errors for the pressure, temperature, and density . Use software of your choice to plot the density as a function of temperature for both of the pressures that you simulated. Your graph(s) should include error bars in both the x and y directions. You should also include a line corresponding to the density predicted by the ideal gas law at that pressure. Is your simulated density lower or higher? Justify this. Does the discrepancy increase or decrease with pressure?
With reduced LJ units, the ideal gas law can be stated as:
The ideal density is therefore simply . As can be seen from the graph, the ideal gas law overestimates the density, and the overestimation is more severe at a higher pressure.
This effect can be most readily explained by realising that the ideal gas law assumes particles have no volume, whereas particles have volume in the actual simulation. At a constant density, having a finite volume will increase the rate of collision and thus increase the pressure. Correspondingly, at the same pressure, having a finite volume means that less particles can be packed into the same space, with a lower simulated density than the ideal density. Does a Lennard-Jones particle 'have volume'? Not quite right - this is due to the ideal gas law assuming no interactions... specifically repulsions thus you can fit more ideal gas into a smaller space. Why do the graphs tend to each other at high T?
Introduction
The introduction should be a way to introduce not only the background of the area but, fundamentally, why the work is of importance. We have calculated the dynamics and diffusion based properties of phases and this should therefore be the subject of the introduction. Milk is certainly interesting and as you have correctly mentioned, collioid science is a crucial part of the Chemistry of phase. Not bad - just your first paragraph needs work..
Molecular dynamics (MD) simulation is an important technique in the modern repetoire of tools in chemistry. It provides information that complements what is normally available from experiments, by providing insight into molecular-level processes. One important advantage of MD simulation is its computational efficiency by using force fields that relatively simple to calculate, enabling studying of behaviours of properties that are inaccessible to ab initio calculations. [2] This is quite vague.. Why am I interested in your work? Your work is by definition MD so it's of no interest to me the benefits of mechanics over quantum calculations.
One example that can illustrate the power of MD simulation is milk, the origin of all the dairy product in the world. First, MD allows us to determine the fluid processes and behaviour under different storage conditions.[3] In addition, there are a variety of proteins within milk that are of interest, and MD simulation allows modelling of the structure and folding of the various milk proteins. [4] Lastly, as a colloidal suspension, MD simulation allows probing of the formation and stability of the colloids to various effects, such as temperature or pH.Tick, good
Aims and Objectives
Aims and objectives could also be written in bullet points. Could make it more concise and heighten clarity?
In this experiment, a model Lennard-Jones (LJ) fluid was simulated to provide information on similar systems that are neutral and only weakly interacting via the London Dispersion Force (LDF), such as Argon. Bulk properties such as heat capacities, structural properties and the radial distribution function, as well as the dynamical properties and the diffusion coefficient was (were) gram also calculated and compared to literature.Tick
Methods
This is, on the whole, a good computational methods section, well done!
The parallel computational pacakge LAMMPS (r11423) was used for the simlation. As a model fluid was simulated, only the LJ potential was applied with cut-off radius of σ=3. Long tail correction was not applied in order to improve computational efficiency. Liquid and vapour phase was melted from a simple cubic crystal (sc), whereas the solid phase was simulated with a face-centered cubic (fcc) lattice. Where possible, relevant thermodynamic properties were calculated directly within LAMMPS, and then analysed with Microsoft Excel. All data were reported in reduced LJ units unless stated otherwise. There may be graphical glitches for graph thumbnail due to limitations in the current mediaWiki software, and a correct version will be shown upon opening the actual file.
Results and Discussion
Heat Capacities

From Figure 1, it can be seen that at both densities 0.2 and 0.8, decreases as temperature increases. In addition, is higher at a higher density. Both of these trends were expected of a real gas.
The heat capacity is often defined as:
In a real fluid, the change in internal energy can be related to movements along the LJ potential. Not directly.. think first law In cases where the fluid has a higher density, the particles are more often found near each other, thus deepter gram in the potential well. Each energy level is further-spaced and more heat energy is needed to raise the temperature, thus resulting in a higher heat capacity. Think less density of states here and more how many more energy levels per unit volume in a system with higher density.
Similarly, at a higher temperature, the particles already have a higher energy and are found at the top of the well. DUe gram to the anharmonicity of the potential, lesser gram, not comparative energy is required to further raise its temperature. This results in a lower heat capacity at a higher temperature. Now this is argument should be density of states.. not potential anharmonicity.
The tempearture gram dependence of the heat capacity of what? differs from that of the ideal gas. In an ideal gas, the heat capacity is solely a function of its kinetic energy and is a constant () for a monoatomic gas Tick). The difference may be of interest in cases where the heat energy is required to do work with the gas, such as the case of combustion engines, or explosions.why is ideality of importance if we require heat energy to do work?
Lastly, this may also be explained using the relationship between heat capacity and Var[E]:
This is due to the fact that variance in energy will increase at a higher fluid density, leading to higher heat capacity.why? In addition, the term in the denominator outweights gram the temperature dependence in the numerator () and decreases the heat capacity at higher temperatures.
Due to the LJ cut-off at σ=3, the heat capcacity measured was expected to be lower than expected, due to losing the long-range interactions. Another important distinction between the simulated and actual experimentation may be the method of heating - LAMMPS brings up (or down) the system temprature by adjusting the velocity of all particles, whereas a real system may have heat introduced to system through contact at the boundary of the system. This may introduce other effects, such as the different rate of heat conductivity and the rate of heating. Distributing velocities by the Maxwell-Boltzmann is fine - imagine we're heating the system up from all directions! However, simulating bulk properties in this manner may be difficult due to the need to have a 'wall' and thus precluding the use of periodic boundary conditions, necessitating a large number of particles ot gram be simulated. Although, this is nice. We could indeed use a slab to control the temperature in the system and this would require more particles. Well thought through.
Structural Properties and the Radial Distribution Function
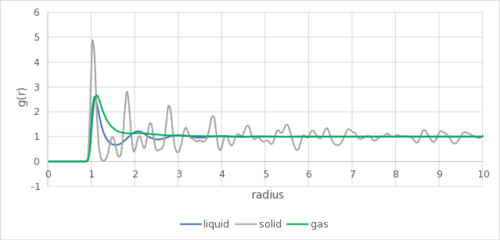
As shown in Figure 2, the RDF of the gas phase shows only a single broad peak, before tapering off to a constant of one gram. In a gas, there is no long-range order, and the distribution quickly approach gram one, showing that it is effectively random as to where the particle is located. There is a single broad peak, showing the attractive interaction between particles, as given by the LJ potential in this simulation.Tick
In a liquid, with a higher density, the there gram are few peaks with decreasing amplitude before tapering off, showing some short-range order but no long range order. but comparatively large relative to gas The peaks can be interpreted as successive coordination spheres of the liquid particles. This forms due to the higher density of the liquid particles, resulting in them being much closer together than the gas on average (density of 0.8 vs 0.08). This forms due to attraction and correlation... This enables the interaction to potentially affect multiple particles, forming a coordination sphere.

In a solid, the particles are ordered. In this case, as shown in Figure 3, the solid phase is simulated as a fcc lattice, and the first 3 peaks are found at distances of 1.025σ, 1.475σ and 1.825σ. The corresponding lattice sites are shown in the figure, and are in the position (black line), (red line)and (green line).Tick
The lattice spacing is the position of the second peak, which is 1.475σ. As the data is reported with a precision of 0.05σ, it may be anywhere between 1.475σ and 1.525σ. From question 6, it is reported to be 1.494σ, in agreement with the simulation.Tick
It can be noted that the first peak is located slightly more than 1σ away, despite σ to be set to 1 in the simulation. This could be the result of the minima of a LJ potential being located at 1.122σ. It is less than 1.122σ due to repulsion from nearby atoms, and the observed 1.025σ distance is a balance of the different forces.
As with the previous section, the LJ cut-off resulted in no interactions with radius longer than 3.2σ in this case. A more realistic simulation with error correction may see a broad peak for gas and liquid around and above 3σ, and slightly closer and sharper peaks within 3σ.Tick
Dynamical Properties and the Diffusion Coefficient

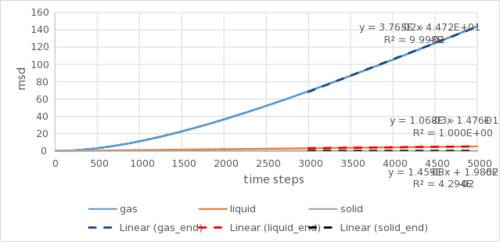
The mean squared displacement (MSD), , effectively measures how much the particles vibrate, or 'giggle' about their equilibrium configurations. Does it? IT can provide insight into collision dynamics within the system but I wouldn't define msd this way... This is a result of the random carried out by each particle, and can be effectively used to measure the diffusion of the system. The diffusion coefficient is related to the MSD through the following equation:
The interpretation of the equaiot gram is very natural: the diffusion of the coefficient is simply how much each particle move per unit time.
As it takes time for the system to reach equilibrium, only the last 2000 timesteps (linear regions in Figure 4) are used for the calculation of the diffusion constant. To disregard the ballistic dynamics The timestep of 0.002fs is the in the equation. The results for the limited simulation using Argon as an example are as follows:
| Gradient | D /σ2 (0.002 fs)-1 | D /cm2 s-1 | |
|---|---|---|---|
| Gas | 2.16 x 10⁻² | 3.60 x 10⁻³ | 4.16 |
| Liquid | 8.81 x 10⁻⁴ | 1.47 x 10⁻⁴ | 0.170 |
| Solid | 9.55 x 10⁻⁶ | 1.59 x 10⁻⁶ | 0.00184 |
Similar calculations cannot be carried for the larger simulation as the duration of each timestep was not provided. However, qualitative information can be drawn. There are two more orders of magnitude difference between the solid and the rest (liquid and gas) in the larger simulation than the smaller one. Assuming identical conditions, it may imply that with a larger simulation, the solid is packed more efficiently and effectively, resisting movements through the lattice. Maybe or the diffusion coefficient - a material dependent not size dependent property - is more accurately measured with a larger system size. The general trend of decreasing rates of diffusion going from gas to liquid to solid is expected, as density decreases and particles are less prone to collision, as well as further away from each other and are less attracted, being more free to move.Tick
Velocity Autocorrelation Function
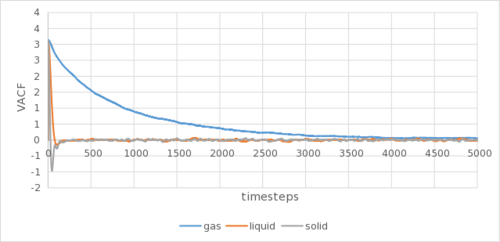

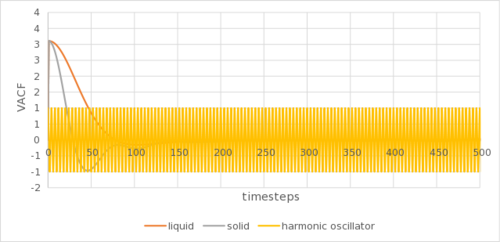
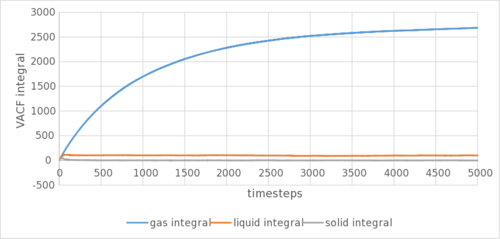
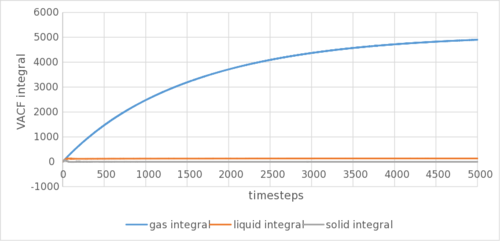
The analytical derivation of the normalized VACF of a 1D harmonic oscillator can be found in the appendix. Tick
The VACF indicates the velocity of the atoms in the simulation. The minima in the VACF arose due to repulsion from each other, as the particles oscillate to their equilibrium position at the initial stages of the simulation. The decay of the amplitude shows the damping effect of the surrounding particles. Overtime, through extra collisions, such oscillations tend to randomness and VACF tends to zero. Not quite, the minima provide insight into the collision dynamics in the system - the first minimum shows us the time at which all particles have collided at least once.
The gaseous VACF shows no oscillation due to its low density, reducing the back and forth oscillation to reach an equilibrium position. The solid show marked sharper and more oscillations than the liquid due to it being more ordered, as well as being arranged in a better packed (fcc lattice as compared to sc lattice) structure. The harmonic oscillator show no damping in VACF due to the lack of neighbouring atoms that can collide into the harmonic oscillator to reduce its autocorrelation. This can be shown in Figure 5c. They are as expected and show a similar trend to the calculation using MSD. The biggest source of error could be the LJ cut-off as above. or the method by which you are numerically calculating the integral?
Conclusion
This isn't really a conclusion - you need a summary of your results and you need to state your ultimate conclusions. Tie this in with the underlying theme and why your work has been important.
Molecular dynamics simulation of a Lennard-Jones fluid was carried out and results were obtained. "results were obtained" is hardly a conclusion! I would hope so. The simulation was able to calculate the various behaviours of a model LJ fluid at different density and temperature conditions. The results was also used to illustrate the heat capacity and diffusion of the system.
Appendix
Input Script for Heat Capacity
### DEFINE SIMULATION BOX GEOMETRY ###
variable d equal 0.2
lattice sc ${d}
region box block 0 15 0 15 0 15
create_box 1 box
create_atoms 1 box
### DEFINE PHYSICAL PROPERTIES OF ATOMS ###
mass 1 1.0
pair_style lj/cut/opt 3.0
pair_coeff 1 1 1.0 1.0
neighbor 2.0 bin
### SPECIFY THE REQUIRED THERMODYNAMIC STATE ###
variable T equal 2.0
variable timestep equal 0.0025
### ASSIGN ATOMIC VELOCITIES ###
velocity all create ${T} 12345 dist gaussian rot yes mom yes
### SPECIFY ENSEMBLE ###
timestep ${timestep}
fix nve all nve
### THERMODYNAMIC OUTPUT CONTROL ###
thermo_style custom time etotal temp press
thermo 10
### RECORD TRAJECTORY ###
dump traj all custom 1000 output-1 id x y z
### SPECIFY TIMESTEP ###
### RUN SIMULATION TO MELT CRYSTAL ###
run 10000
unfix nve
reset_timestep 0
### BRING SYSTEM TO REQUIRED STATE ###
variable tdamp equal ${timestep}*100
fix nvt all nvt temp ${T} ${T} ${tdamp}
run 10000
reset_timestep 0
### MEASURE SYSTEM STATE ###
unfix nvt
fix nve all nve
thermo_style custom step etotal temp press density atoms vol
variable dens equal density
variable dens2 equal density*density
variable temp equal temp
variable temp2 equal temp*temp
variable press equal press
variable press2 equal press*press
variable etot equal etotal
variable etot2 equal etotal*etotal
variable atms equal atoms
variable atms2 equal atoms*atoms
variable vol equal vol
fix aves all ave/time 100 1000 100000 v_dens v_temp v_press v_dens2 v_temp2 v_press2 v_etot v_etot2 v_atms2 v_vol
run 100000
variable avedens equal f_aves[1]
variable avetemp equal f_aves[2]
variable avepress equal f_aves[3]
variable errdens equal sqrt(f_aves[4]-f_aves[1]*f_aves[1])
variable errtemp equal sqrt(f_aves[5]-f_aves[2]*f_aves[2])
variable errpress equal sqrt(f_aves[6]-f_aves[3]*f_aves[3])
variable heatcapacityv equal f_aves[9]*(f_aves[8]-f_aves[7]*f_aves[7])/(f_aves[5])
variable avevol equal f_aves[10]
print "Averages"
print "--------"
print "Density: ${avedens}"
print "Stderr: ${errdens}"
print "Temperature: ${avetemp}"
print "Stderr: ${errtemp}"
print "Pressure: ${avepress}"
print "Stderr: ${errpress}"
print "Cv: ${heatcapacityv}"
print "Volume: ${avevol}"
Derivation of VACF for Harmonic Oscillator
The normalised velocity correlation function is as follow:
| (5) |
For a 1D simple harmonic oscillator, , we have a well-known solution, assuming a boundary condition with a phase to be 0:
| (6) |
where , where k and m are the the force constant and mass of the oscillator respectively.
Correspondingly, for the velocity, we have:
| (7) |
Substiting eq (7) into eq (5), we have the following integral:
Simplifying using trigonometric identities,
As is an odd function, and we have directly:
| (8) |
References
- ↑ "Pure Water Density Standard DENWAT." Sigma-Aldrich, 2017, http://www.sigmaaldrich.com/catalog/product/sial/denwat?lang=en®ion=GB
- ↑ Gelpi, J., Hospital, A., Goñi, R. and Orozco, M. (2015). Molecular dynamics simulations: advances and applications. Advances and Applications in Bioinformatics and Chemistry, p.37.
- ↑ Ubbink, J., Burbidge, A. and Mezzenga, R. (2008). Food structure and functionality: a soft matter perspective. Soft Matter, 4(8), p.1569.
- ↑ Ahmad, Ayaz. (2014). Structural Modeling and Molecular Dynamics Simulation Studies of Camel Milk Kappa Casein Protein. International Journal of Computational Bioinformatics and In Silico Modeling. 3. 483.
- ↑ Watanabe, H., Ito, N. and Hu, C. (2012). Phase diagram and universality of the Lennard-Jones gas-liquid system. The Journal of Chemical Physics, 136(20), p.204102.
