Talk:Ch3114
JC: General comments: Some parts of tasks missing, especially the radial distribution function and VACF sections, try to make sure that you attempt all parts of the experiment. Check that the density and temperature values that you chose for the solid, liquid and gas simulations were not within the coexistence region of the phase diagram.
2. Intro to MD Simulations
Task 1:
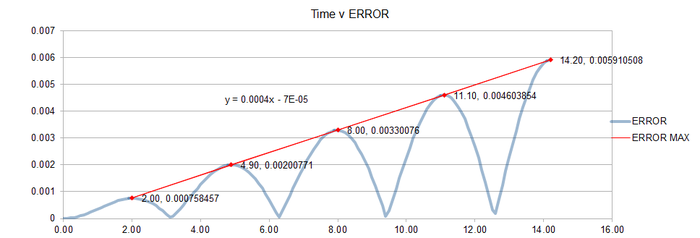
JC: Why does the error oscillate over time?
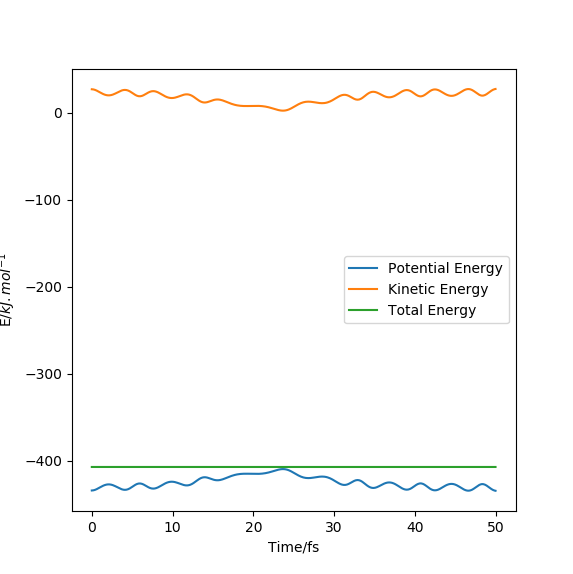

Task 2:
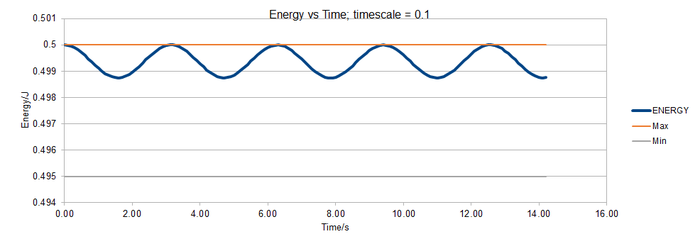
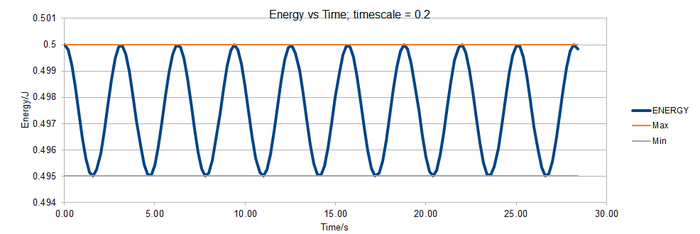
[[File:TASK1 energy v time 0.3.png|thumb|700px|Figure: Energy vs time; timestep = 0.3 including bounds of 1 % range.|none]
The graphs show that to ensure that the energy does not fluctuate by more than 1 %, a timestep ≤ 0.2 is required.
It is important to monitor the overall energy of a sytem to ensure that it behaves as expected and that it does not fluctuate too significantly. Energy must be conserved so the total energy should be montiored to ensure this law is obeyed.
JC: Good choice of timestep.
Task 3:
For a single Lennard-Jones interaction, , find the separation, , at which the potential energy is zero. What is the force at this separation? Find the equilibrium separation, , and work out the well depth (). Evaluate the integrals , , and when .
When ,
Hence:
At :
As when potential energy is zero:
At equilibrium, force is equal to zero.
when :
when ,
when ,
when ,
JC: All correct and working looks good.
Task 4:
1 mole water =
1 mL water =
Volume of 10000 water molecules =
Task 5:
After one timestep, the particle would be located at (1.2,1.1,0.7). This corresponds to (0.2,0.1,0.7) in this model as the particle reenters the opposite face of the box when it crosses the box boundary.
Task 6:
The Lennard-Jones parameters for argon are . If the LJ cutoff is , what is it in real units? What is the well depth in ? What is the reduced temperature in real units?
JC: Correct.
3. Equilibration
Task 1:
Why do you think giving atoms random starting coordinates causes problems in simulations? Hint: what happens if two atoms happen to be generated close together?
According to the Lennard-Jones Potential, there is a sharp increase in the interatomic potential when two atoms have a separation that is less than the equilibrium separation. When large numbers of atoms are given randomly generated initial coordinates, it is quasi-certain that some will be found very close to each other and will be in a high energy state. This means the simulation will not accurately reflect the real situation and will not give any useful information regarding properties of the system.
JC: The simulation will not stay in this state, but may be unstable and crash due to the high repulsive forces.
Task 2:
Satisfy yourself that this lattice spacing corresponds to a number density of lattice points of . Consider instead a face-centred cubic lattice with a lattice point number density of 1.2. What is the side length of the cubic unit cell?
FCC lattice has four lattice points per unit cell:
JC: Correct.
Task 3:
Consider again the face-centred cubic lattice from the previous task. How many atoms would be created by the create_atoms command if you had defined that lattice instead?
1000 unit cells would be created, each containing 4 atoms so 4000 atoms.
Task 4:
There is only 1 type of atom with a reduced mass = 1.0.
Lennard-jones interactions are used to compute the interactions between atoms that are with a distance of 3.0 reduced units of each other. As distance increases in a Lennard Jones potential plot, potential tends to 0 so this limit will not effect the overall simulation significantly and will significantly reduce the amount of computation required.
and for the interaction between any two pairs of atoms.
JC: Correct.
Task 5:
Initial velocity and position have been specified so the velocity-Verlet algorithm can be used. This was carried our to model a classical harmonic oscillator in section 2.
Task 6:
Using the original code allows the timestep to be changed without affecting the simulation time because the is automatically adjusted to give the same simulation time no matter the time step.
Task 7:


It can be seen that the system reaches equilibrium after 1 second. The running average for 100 timesteps is shown on each graph. It shows that the system has reached equilibrium after 100 timesteps.

The 0.15 timestep would be a bad choice because the energy is not fluctuating around a single value. It is generally increasing over time. This means the system does not obey the law of the conservation of energy.
TS=0.1 is the longest timescale to give acceptable results. The energy values are fluctuating around a similar value to other timescales.
JC: Should the total energy depend on the choice of timestep? 0.0025 might be a better choice as it is the largest timestep that gives the same average energy as smaller, more accurate timesteps.
4.Running simulations under specific conditions
Task 1:
JC: Good derivation.
Task 2:
Use the manual page to find out the importance of the three numbers 100 1000 100000. How often will values of the temperature, etc., be sampled for the average? How many measurements contribute to the average? Looking to the following line, how much time will you simulate?
100 instructs Lammps to take a sample value for the average every 100 steps.
1000 instructs Lammps to take 1000 samples to calculate the average.
100000 instruct lammps that the average must be calculated on every step that is a multiple of 100000.
Timestep = 0.001
0.001*100000= 100 seconds
JC: Time is not in seconds, remember reduced units are used throughout.
Task 3:

When your simulations have finished, download the log files as before. At the end of the log file, LAMMPS will output the values and errors for the pressure, temperature, and density . Use software of your choice to plot the density as a function of temperature for both of the pressures that you simulated. Your graph(s) should include error bars in both the x and y directions. You should also include a line corresponding to the density predicted by the ideal gas law at that pressure. Is your simulated density lower or higher? Justify this. Does the discrepancy increase or decrease with pressure?
The Number density of an ideal gas is higher than the simulated number density. The ideal gas law assumes that there are no interactions between individual molecules, hence there is no energy barrier to two molecules being found very close or on top of each other. This is not the case for the simulation as discussed in section 3. Therefore the ideal gas law will predict that molecules are found much more closely packed than the simulation. At higher pressure, the breakdown of this assumption is more evident as there are more inter-molecular interactions in the simulation when the pressure is greater that are not taken into account by the ideal gas law. There is also a greater discrepancy between the simulation and ideal gas at lower temperatures. Atoms have less kinetic energy at lower temperature, so the potential energy term, which is only found in the simulated system, is more important in determining the total energy of an atom. At higher temperatures, the kinetic energy term dominates and so there is less of a discrepancy between the ideal gas and the simulation.
JC: The ideal gas law is a good approximation to a dilute gas when interparticle interactions are less significant.
5. Calculating the heat capacities using statistical physics
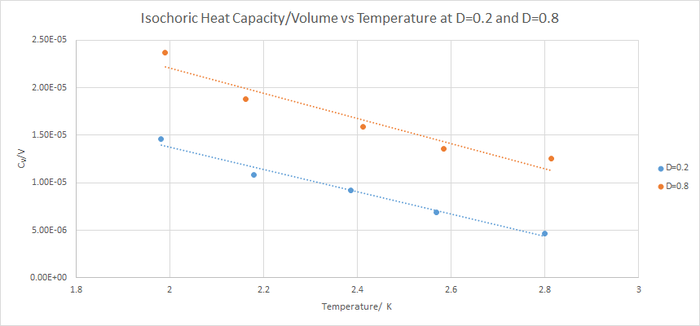
Isochoric heat capacity decrease as temperature increased. A decreased heat capacity means less heat energy is needed to require to increase the temperature of the system by the same amount. This is difficult to explain using a classical system. Rotational, vibrational and translational energy levels are quantised and they converge as energy increases. As temperature increases, higher energy levels are occupied. However, the difference between the energy levels is less so the heat capacity of the system will decrease as temperature increases.
JC: These simulations are classical, so quantum effects are not taken into account, and there are no rotational or vibrational energy levels since the simulation contains individual atoms.
Isochoric heat capacity is higher for a more densely populated system. There are more atoms per unit volume. So more excited state energy levels that will need to be occupied to give the same rise in temperature. So isochoric heat capacity will be larger for a more dense system.
 ### DEFINE SIMULATION BOX GEOMETRY ###
variable D equal 0.8
lattice sc ${D}
region box block 0 15 0 15 0 15
create_box 1 box
create_atoms 1 box

### DEFINE PHYSICAL PROPERTIES OF ATOMS ###
mass 1 1.0
pair_style lj/cut/opt 3.0
pair_coeff 1 1 1.0 1.0
neighbor 2.0 bin

### SPECIFY THE REQUIRED THERMODYNAMIC STATE ###
variable T equal 2.0
variable timestep equal 0.001

### ASSIGN ATOMIC VELOCITIES ###
velocity all create ${T} 12345 dist gaussian rot yes mom yes

### SPECIFY ENSEMBLE ###
timestep ${timestep}
fix nve all nve

### THERMODYNAMIC OUTPUT CONTROL ###
thermo_style custom time etotal temp press
thermo 10

### RECORD TRAJECTORY ###
dump traj all custom 1000 output-1 id x y z

### SPECIFY TIMESTEP ###

### RUN SIMULATION TO MELT CRYSTAL ###
run 10000
unfix nve
reset_timestep 0

### BRING SYSTEM TO REQUIRED STATE ###
variable tdamp equal ${timestep}*100
variable pdamp equal ${timestep}*1000
fix nvt all nvt temp ${T} ${T} ${tdamp}
run 10000
reset_timestep 0

### MEASURE SYSTEM STATE ###
thermo_style custom step etotal temp atoms
variable temp equal temp
variable atoms equal atoms
variable etotal equal etotal
variable etotal2 equal etotal*etotal
fix aves all ave/time 100 1000 100000 v_temp v_etotal v_etotal2
unfix nvt
fix nve all nve
run 100000

variable temp equal f_aves[1]
variable temp2 equal temp*temp
variable etotal equal f_aves[2]*f_aves[2]
variable etotalsq equal f_aves[3]
variable heatcap equal ${atoms}*${atoms}*(${etotalsq}-${etotal})/${temp2}
variable volume equal vol
variable hcov equal ${heatcap}/${volume}


print "Averages"
print "--------"
print "Density: ${D}"
print "AvTemperature: ${temp}"
print "HeatCap: ${heatcap}"
print "Volume: ${volume}"
print "HeatCapOverV: ${hcov}"
6. Structural properties of the RDF
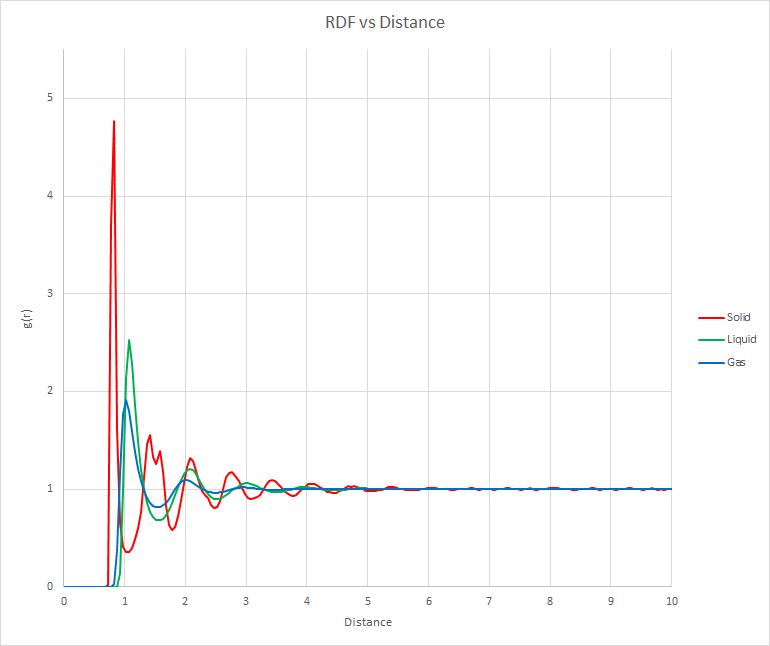
The RDF gives the probability of finding an atom at a given distance from any given atom. It can be seen that the solid produces the most distinct peaks because the atoms are held more rigidly in place. The first peak is also found at the lowest distance for a solid because atoms in a solid are generally found closer to each other. The gas RDF has the broadest peaks and troughs because the atoms are able to move more freely, hence there is a smaller probability that the atoms will be found in specific regions. This demonstrates that at any given snapshot in time, atoms in the vapour phase are more disordered than those in the solid or liquid phase. the liquid phase more closely resembles the gas than the solid as but it can be seen that the liquid phase is more ordered than the solid phase. All three RDFs show that the atoms repel any atom that approaches. This is in agreement with Lennard-Jones potential diagrams. It was surprising to see that the peaks of a solid were not observed after 5 reduced units of distance.
JC: All of these curves look quite liquid-like, what values did you choose for the density and temperature to simulate each phase, did you choose values in the coexistence region? Did you calculate the lattice parameter or the integral of the radial distribution function?
7. Dynamical properties and the diffusion coefficient
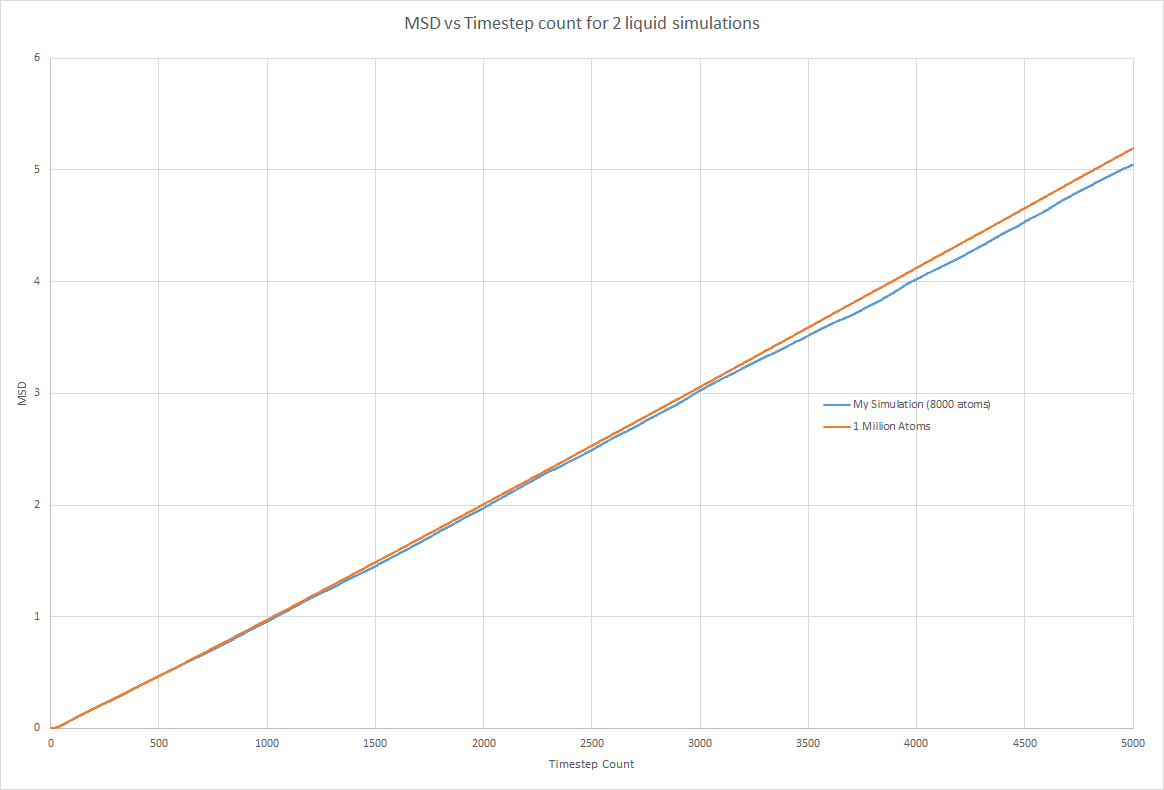
Both trend lines had a gradient of 0.0304 in timestep units. This corresponds to 15.2 as the timestep = 0.002.
Hence D = 2.53
My Simulation: gradient = 0.00102 (timestep units) gradient = 0.5 (time units) D = 0.0850
1000000 atoms: gradient = 0.00105 D = 0.0875
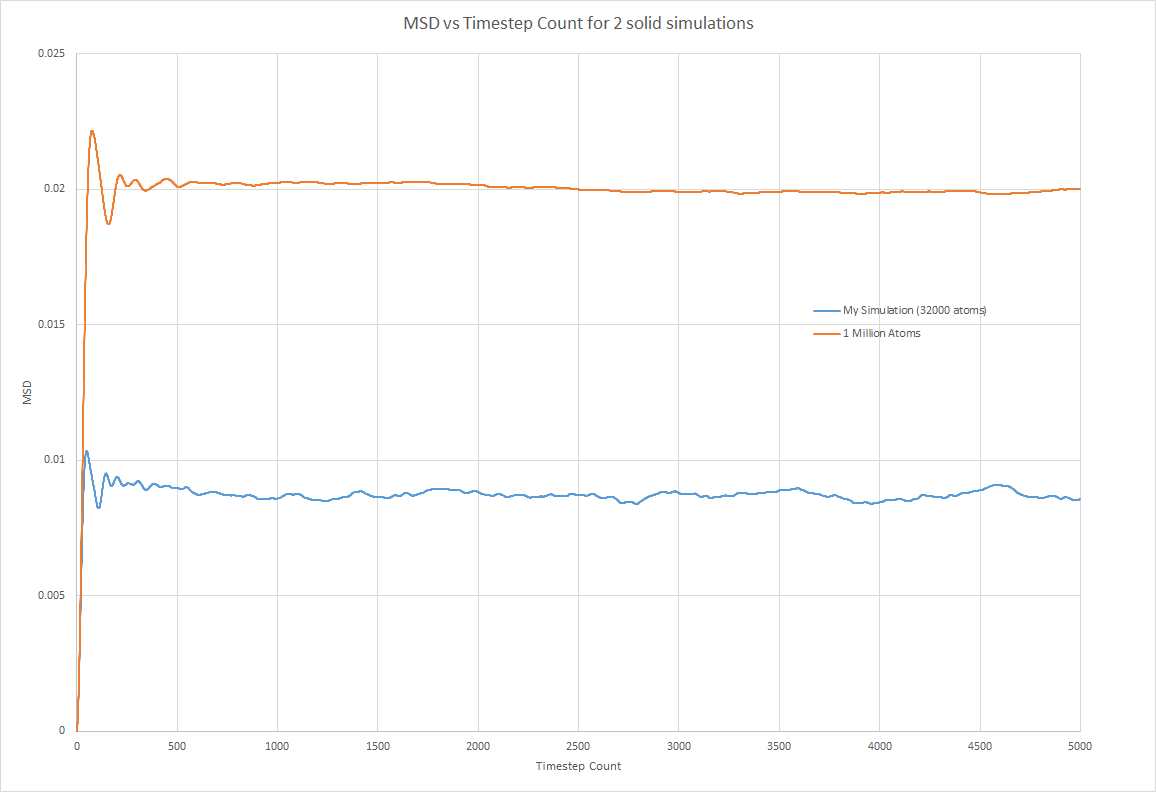
My Simulation: gradient = = 6E-09 (timestep units) D = 5E-07
1000000 atoms: gradient = 5E-08 D = 4.17E-06
The solid and liquid phase graphs show that there is no benefit to running a simulation using a larger number of atoms as the same plot is obtained using 8000 atoms in a simulation as 1000000 atoms. Mean squared displacement (MSD) increases linearly over time for liquid and gas phases as expected. The two simulations produced the MSD for both phases because the MSD was dependent on the number density of atoms in a unit cell. As this was similar for both phases, the MSD produced was very similar. I was surprised to find that the liquid phase has an MSD that is much closer to the solid phase than the gas phase.
The solid phase plot differed from the other two plots because the two simulations did not produced two superimposed lines. This is because each atoms is held in a fcc crystal configuration that, once it has stabalised does not allow atoms to move much. Therefore the displacement is dependent on the number of atoms and thus simulations using a greater number of atoms will have a higher MSD. Initially there was a significant increase in MSD which plateau after the optimum atom arrangement in the solid had been found. Once this arrangement was obtained, the atoms could not move position within the solid and so MSD remained roughly constant. Atoms in a solid only oscillate about a point.
However the values calculated for the diffusion coefficient of all three phases were very similar. This shows that when calculating the diffusion coefficient, there is no advantage in running a simulation with more atoms. The diffusion doefficients were as expected. D was highest for vapour and lowest for solids. Liquids were found inbetween but much a much closer vaklue to the vapour phase.
JC: Show the linear fits that you used to calculate the diffusion coefficient on the plots, did you fit to the full data range or just the linear section?
Hence,
As:
Separate into two terms and simplify:
The top of the fraction integrates to 0 as cos is an even function and sin is an odd function.
Hence:
JC: Correct.
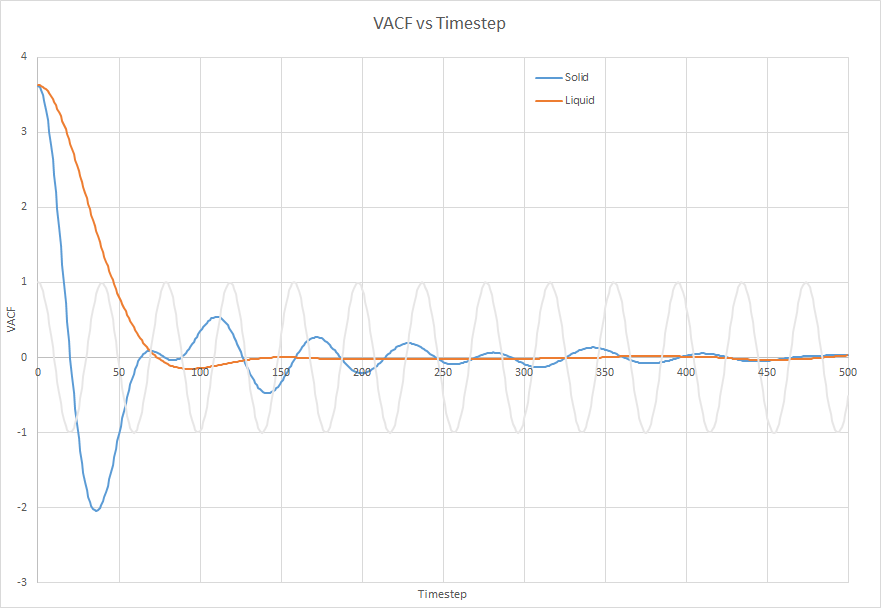
The VACF of the harmonic system differs strongly from the VACF calculated from a Lennard-Jones potential because it is a symettric function about the equilibrium bond length. This causes the VACF of the harmonic oscillator to oscillate about 0. There is also no initial period in which the atoms are reaching a dynamic equilibrium.
The minima occur when atoms collide and they have opposite velocity. The minima is much lower for a solid than a liquid because in a liquid, atoms are more likely to have a more random direction of movement. As atoms are moving in all directions, the total VACF will be close to 0 as velocity is a vecotr quantity. In solids, the direction of travel of an atom is much more dependent on the atoms around it as the atoms are more densely packed and held together more rigidly.
JC: Collisions between atoms cause the decay in the VACF and this is why there is no decay in the harmonic oscillator. Did you calculate the diffusion coefficient from the VACF?

