TAw0133700117
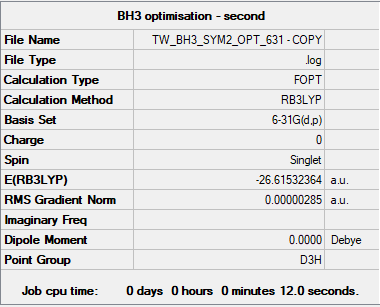
BH3
B3LYP/6-31G(d.p) level
         Item               Value     Threshold  Converged?
 Maximum Force            0.000006     0.000450     YES
 RMS     Force            0.000004     0.000300     YES
 Maximum Displacement     0.000023     0.001800     YES
 RMS     Displacement     0.000015     0.001200     YES
Frequency analysis log file bh3_frequency.log
 Low frequencies ---   -2.2126   -1.0751   -0.0054    2.2359   10.2633   10.3194
 Low frequencies --- 1162.9860 1213.1757 1213.1784
BH3 |
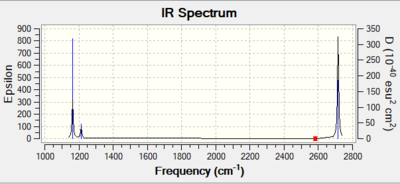
Vibrational spectrum for NH3
| wavenumber (cm-1 | Intensity (arbitrary units) | symmetry | IR active? | type |
| 1163 | 93 | A"2 | yes | out-of-plane bend |
| 1213 | 14 | E' | very slight | in-plane bend |
| 1213 | 14 | E' | very slight | in-plane bend |
| 2582 | 0 | A'1 | no | symmetric stretch |
| 2715 | 126 | E' | yes | asymmetric stretch |
| 2715 | 126 | E' | yes | asymmetric stretch |
In the spectrum there are less than 6 peaks. This is because there are two sets of vibrations with degenerate energies, these sets occur at frequencies 1213 and 2715. As a result, 4 vibrations are represented by two peaks. There is also a stretch at 2583, however since it is a symmetric stretch, it is not IR active and as a result does not appear on the spectrum. Therefore, only 3 peaks should be seen in the spectrum.
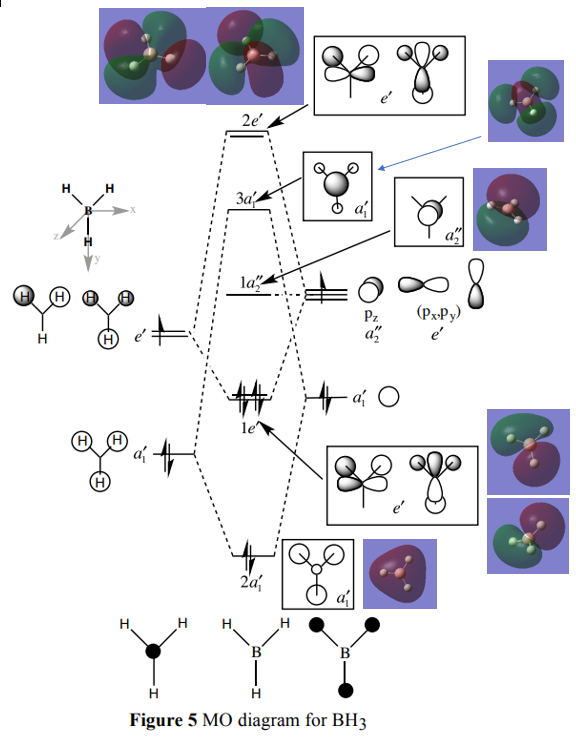
BH3 Molecular Orbital Diagram
MO diagram referenced fromː Hunt, P, 2018, MO Problem Class, ICL, http://www.huntresearchgroup.org.uk/teaching/teaching_MOs_year2/P1_BH3_MO_diagram.pdf
Are there any significant differences between the real and LCAO MOs? What does this say about the accuracy and usefulness of qualitative MO theory?
The LCAO MOs show the individual contributions from the orbitals on each atom however the real MOs may be much larger and cover multiple atoms e.g. 2a1'. For the LCAO MOs, the orbital contribution coefficients have been estimated, whereas for the real MOs these values have been calculated and will be more representative of what is actually happening.
The energy ordering and shape of the LCAO MOs predicted by MO theory compare well to the real MOs. MO theory allows us to generate these properties without having to carry out the complex calculations involved in solving the Schrodinger equation. As a result, MO theory is quite useful and accurate.
A very good discussion of the similarities and differences between the LCAO and calculated MOs. You've presented the MOs well on the diagram but have repeated the same one twice for the 1e' MOs, there should have been one with no contribution on one of the H atoms. Smf115 (talk) 10:22, 30 May 2019 (BST)
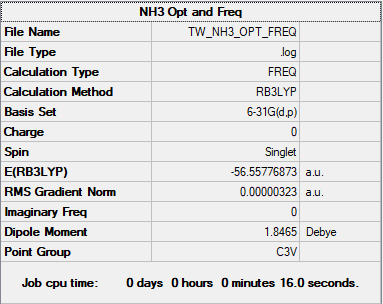
NH3
B3LYP/6-31G(d.p) level
         Item               Value     Threshold  Converged?
 Maximum Force            0.000006     0.000450     YES
 RMS     Force            0.000004     0.000300     YES
 Maximum Displacement     0.000014     0.001800     YES
 RMS     Displacement     0.000009     0.001200     YES
Frequency analysis log file NH3_frequency.log
Low frequencies ---   -0.0128   -0.0018   -0.0014    7.1032    8.1046    8.1049
Low frequencies --- 1089.3834 1693.9368 1693.9368
NH3 |
NH3BH3
B3LYP/6-31G(d.p) level
         Item               Value     Threshold  Converged?
 Maximum Force            0.000004     0.000450     YES
 RMS     Force            0.000001     0.000300     YES
 Maximum Displacement     0.000038     0.001800     YES
 RMS     Displacement     0.000020     0.001200     YES
Frequency analysis log file NH3BH3_frequency.log
Low frequencies ---   -5.6966   -0.3177   -0.0465   -0.0015    1.1645    1.2407
 Low frequencies ---  263.2815  632.9623  638.4593
NH3BH3 |
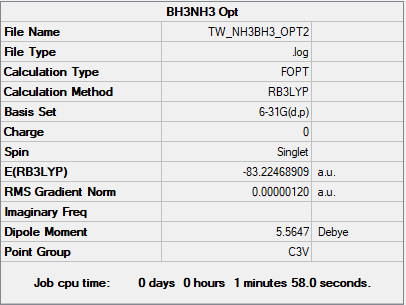
Energy of N-B Bond
E(NH3) = -56.55776873 a.u.
E(BH3) = -26.61532364 a.u.
E(NH3BH3) = -83.22468893 a.u.
Association energy = E(NH3BH3) - [E(NH3)+E(BH3)] = -83.22468893 - (-26.61532364 + -56.5577687) = -0.05159659 a.u. = -135.466847 = -135 kJ/mol
Compared to a C-C bond, which has a bond dissociation energy of 347 kJ/mol (1), the B-N bond is quite weak despite being isoelectronic.
Correct calculation, good consideration given to the accuracy of the final reported energy value and relevant (and referenced) comparison, excellent! Smf115 (talk) 10:25, 30 May 2019 (BST)
NI3
B3LYP/6-31G(d,p)LANL2DZ level
         Item               Value     Threshold  Converged?
 Maximum Force            0.000102     0.000450     YES
 RMS     Force            0.000075     0.000300     YES
 Maximum Displacement     0.000858     0.001800     YES
 RMS     Displacement     0.000629     0.001200     YES
Frequency analysis log file NI3_frequency.log
Low frequencies ---  -12.3847  -12.3783   -5.6131   -0.0040    0.0194    0.0711
Low frequencies ---  100.9307  100.9314  147.2333
NI3 |
The optimised N-I bond length is 2.184 A.
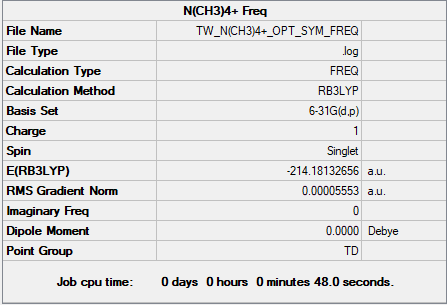
N(CH3)4+
B3LYP/6-31G(d,p)
        Item               Value     Threshold  Converged?
 Maximum Force            0.000091     0.000450     YES
 RMS     Force            0.000056     0.000300     YES
 Maximum Displacement     0.000765     0.001800     YES
 RMS     Displacement     0.000405     0.001200     YES
Frequency analysis log file N(CH3)4+_frequency.log
 Low frequencies ---   -0.0009   -0.0007   -0.0002   35.2870   35.2870   35.2870
 Low frequencies ---  217.1555  316.3089  316.3089
N(CH3)4+ |
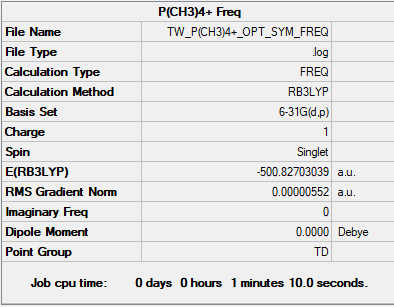
P(CH3)4+
B3LYP/6-31G(d,p)
        Item               Value     Threshold  Converged?
 Maximum Force            0.000011     0.000450     YES
 RMS     Force            0.000006     0.000300     YES
 Maximum Displacement     0.000038     0.001800     YES
 RMS     Displacement     0.000023     0.001200     YES
Frequency analysis log file P(CH3)4+_frequency.log
Low frequencies ---   -0.0003    0.0014    0.0015   24.7544   24.7544   24.7544
Low frequencies ---  160.0917  194.8201  194.8201
P(CH3)4+ |
P(CH3)4+ and N(CH3)4+ Comparison
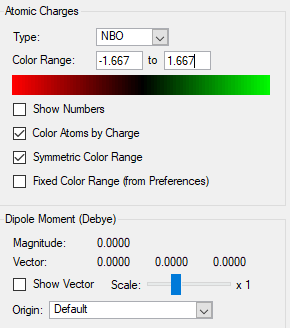
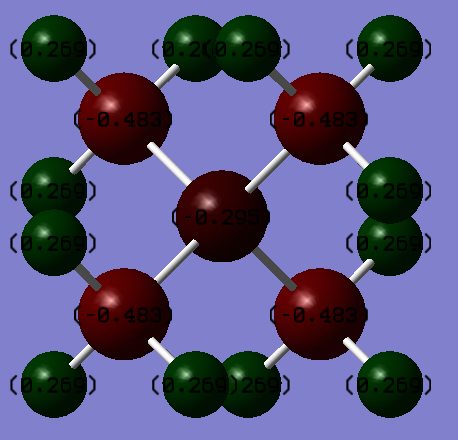
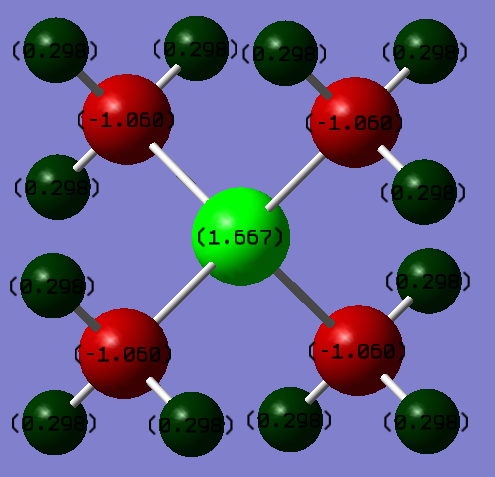
The top two pictures refer to the charge distribution on N(CH3)4+ and the bottom two refer to P(CH3)4+.
Compare the charge distribution for these cations, placing images side by side is not sufficient, list and discuss the charges. The key words here are "compare" and "discuss" just presenting the data is not sufficient, you must interpret your results. [NR4]+ (R=alkyl) is often depicted as shown, with the positive charge placed on the nitrogen centre. Based on your results for [N(CH3)4]+, discuss the validity of this traditional description. You should consider the following: What does the "formal" positive charge on the N represent in the traditional picture? On what atoms is the positive charge actually located for this cation?
As can be seen by the tables and the charge distribution pictures, the heteroatom in each compound affects how electrons are distributed. The charge on the P atom was worked out to be 1.667 whereas the charge on the N atom was calculated to be -0.295. In the N(CH3)4+ and P(CH3)4+, the charges on carbon were -1.060 and -0.483 respectively. These observations can be explained by the electronegatives of the atoms involvedː P = 2.19, C = 2.55 and N = 3.04 (2). Since P is less electronegative than C, the electron density resides on the carbon atoms which is why P is predicted to have a positive charge. N, on the other hand, is more electronegative than C and as a result withdraws electron density from the methyl groups, giving it a negative charge and making the charge on the C atoms more positive. The charges on the H atoms remain fairly constant at 0.298 for P(CH3)4+ and 0.269 for N(CH3)4+. This is because the inductive effect of changing the heteroatom falls away rapidly with distance.
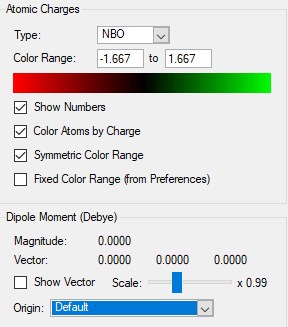
Good colour range used to highlight the charge distribution and correct NBO charges calculated. The use of referenced electronegativity values to justify the charges is good, however, other effects (e.g. symmetry) could have been considered too. Smf115 (talk) 18:11, 30 May 2019 (BST)
The formal positive charge on the N atom for this molecule using a traditional description is due to the N atom forming a dative bond to a methyl group. As a result, compared, to a neutral nitrogen atom, the nitrogen atom in this compound has one less electron. In reality, and as shown by the charge distributions, the positive charge is not located on a single atom but is actually spread out across the molecule. It is distributed over the H atoms on the methyl groups. In actual fact, the N atom actually has a negative charge. This is because the N atom is very electronegative and withdraws electron density from the methyl groups.
Nice mention of why the positive charge doesn't match the trasitional description, your explanation to why the +1 formal charge arises on the N though needed to think about Lewis structures and formal electron counting. Smf115 (talk) 18:11, 30 May 2019 (BST)
| Atom | N(CH3)4+ Charges |
|---|---|
| N | -0.295 |
| C | -0.483 |
| H | 0.269 |
| Atom | P(CH3)4+ Charges |
|---|---|
| P | 1.667 |
| C | -1.060 |
| H | 0.298 |
N(CH3)4+ Orbitals
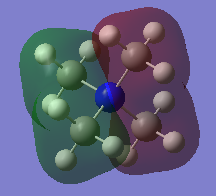
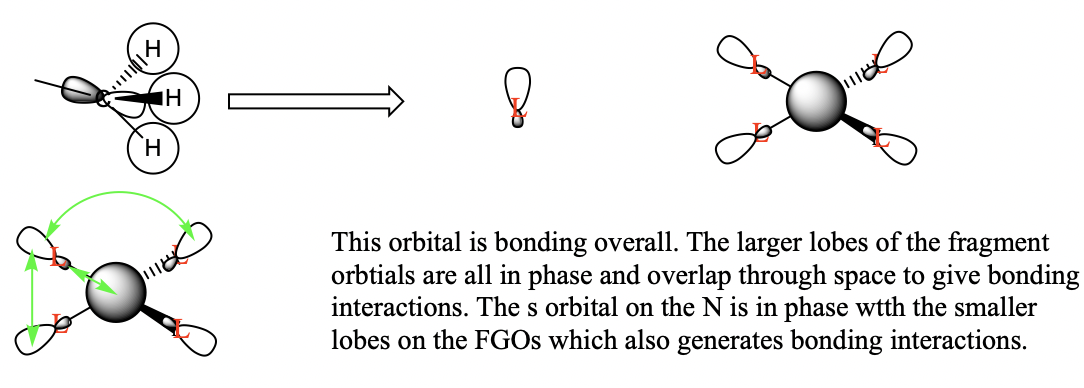
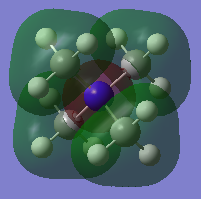
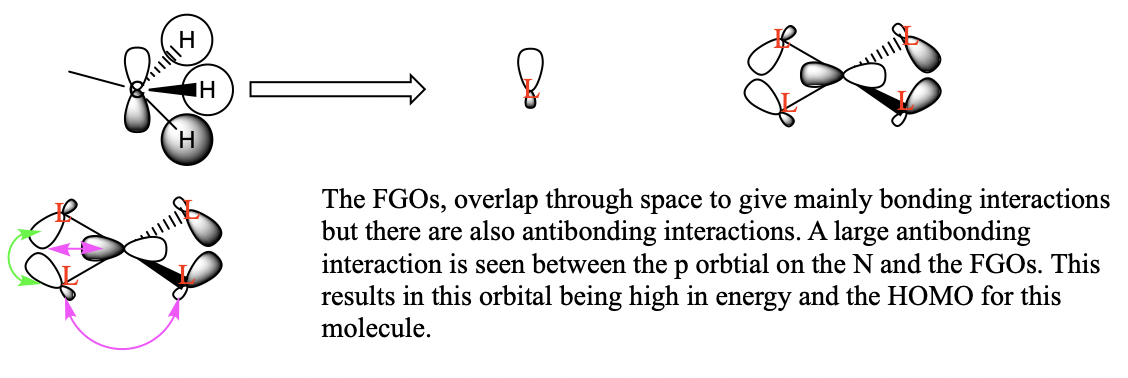
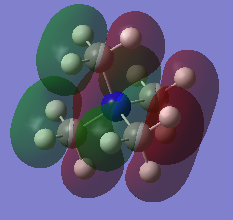
Three valence orbitals for this compound were examined. A LCAO MO diagram was drawn for each MO. In the LCAO diagrams, the green arrows represent the bonding interactions, and the pink arrows represent the antibonding interactions.
MO 8
MO 10
MO21
You've selected a good range of MOs to analyse and your FOs, LCAOs and analysis of the interactions are correct for MO8 and 21. The FO for MO 10 isn't correct and considering the BH3 MO diagram may have helped you identify the FO to use, the resulting bonding character is then largely anti-bonding. Smf115 (talk) 18:16, 30 May 2019 (BST)
Overall, a very good report with good structure calculations throughout. Smf115 (talk) 18:16, 30 May 2019 (BST)
References
Referencesː
(1) Yu-Ran Luo and Jin-Pei Cheng "Bond Dissociation Energies" in CRC Handbook of Chemistry and Physics, 96th Edition.
(2) J.E. Huheey, E.A. Keiter, and R.L. Keiter in Inorganic Chemistry : Principles of Structure and Reactivity, 4th edition, HarperCollins, New York, USA, 1993.

