Ss2310:Module 2
WEEK ONE
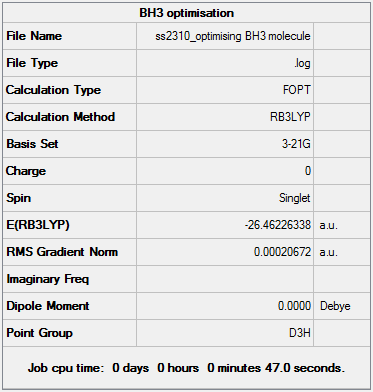
BH3 Optimisation & Analysis (3-21G Basis Set)

Optimal B-H Bond Distance: 1.19349Å.
Optimal H-B-H Bond Angle: 120.00°
File:SS2310 NEWOPTIMISING BH3 MOLECULE.LOG
Optimisation of a molecule involves trying to find the lowest energy, geometrically stable configuration. This process is simply a way of calculating and locating a stationary point e.g. minimum. The Born-Oppenheimer Approximation is used when setting up the ‘opt’ calculation in Gaussian. This states that: (i) nuclei are much heavier than electrons - much slower velocity in comparison, treated as being ‘fixed’ - motion can be disregarded when solving electronic Schrodinger (SCF) equation (ii) position of nuclei is changed slightly and the Schrodinger calculation repeated at each new geometry. Gaussian approaches optimisation in a sequential process: 1. The starting energy is noted and a geometry of lower, more stable energy is located 2. Each corresponding geometry should have a smaller gradient value as the net forces are decreasing 3. This approximation is repeated until the convergence allows us to identify a geometry with zero net forces - the optimised molecular structure. Slight problems may be encountered using this method, such as (i) each subsequent approximation is dependent on the results of the first approximation - this may be incorrect (ii) approximation is dependent upon the starting geometry - an ‘optimised’ geometry could potentially be a similar looking saddle-point rather than a true energy minimum. The ‘job convergence’ output tells us when the approximation is satisfactory and falls below a certain threshold value pre-determined by Gaussian. The optimisation calculation was set up as follows in Gaussian - 1. Job Type:' Optimisation 2. Method: B3LYP approximation chosen, DFT and using a 3-21G basis set 3. Titled the calculation file e.g. 'BH3 optimisation, and submitted to Gaussian. 4. After the job has completed, the output log file is selected and opened in Gaussview.
Opening Results Summary under the Results tab allowed general information such as Calculation type, Final Energy and Dipole moment to be reported. In order to check that the optimisation worked, the 'real' output that Gaussian cannot process graphically is opened to see if the job has converged properly. The 'force and displacements' information tells us if the optimisation is satisfactory and whether the placements have converged successfully.
        Item               Value     Threshold  Converged?
 Maximum Force            0.000413     0.000450     YES
 RMS     Force            0.000271     0.000300     YES
 Maximum Displacement     0.001610     0.001800     YES
 RMS     Displacement     0.001054     0.001200     YES
 Predicted change in Energy=-1.071764D-06
 Optimization completed.
    -- Stationary point found.
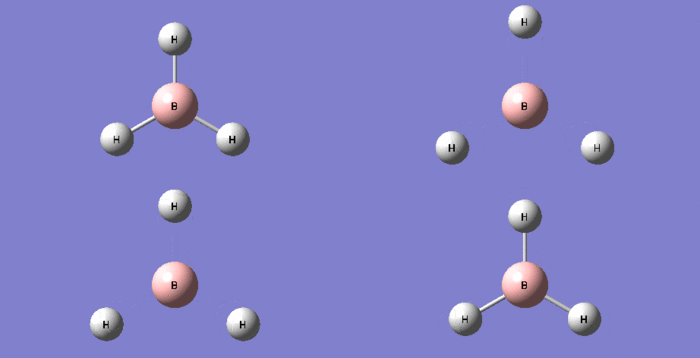
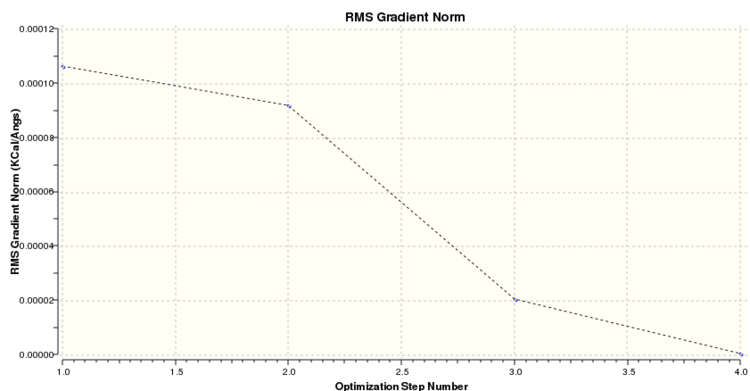
It is possible to look at each step of this process by opening the BH3 optimisation log file and ensuring that the Intermediate Geometries option is checked. The 'Results' tab is selected and 'Optimisation' chosen.
The gradient describes the slope of a line on a graph - specifically Δy / Δx. For example, the first derivative of potential energy will therefore give us an understanding of the net forces acting on a molecule. Also, when the gradient becomes zero, this means that there forces must also be zero - indicating the presence of a minima or stationary point. These are also known as ‘stationary points’ as even when small structural changes are made to the molecule, the overall acting forces remain zero.
A bond is a favourable electron density overlap between two atoms. If the energy of the resulting molecule is lower (more energetically favourable) than that of the separate atoms, then bonding will take place. The greater the extent of electron delocalisation in the molecule - the greater the overall stability. It is also important to consider other criteria such as: (i) orbital symmetry e.g. pi-pi interactions (ii) directional aspect (x,y,z) (iii) orbital energy e.g. lone pair involvement (iv) extent of orbital overlap e.g. diffusion. Good orbital overlap therefore leads to a shorter bond. At the minimum energy, the distance between the nuclei should correspond to the equilibrium bond length. In Gaussian, a quantum mechanics approach is used. This means that if two non-bonding atoms with large electron density are placed close to one another, the program will assume that a bond must be formed between the two in order to lower energy.
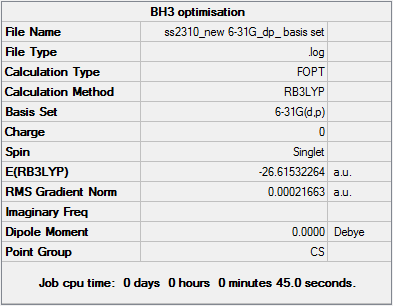
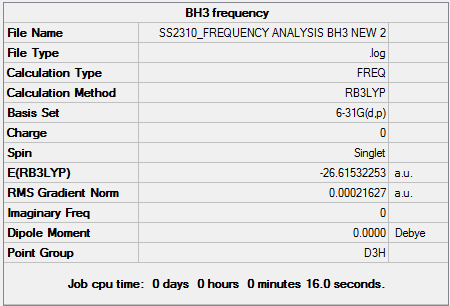
BH3 Optimisation & Analysis (6-31G d,p Basis Set)
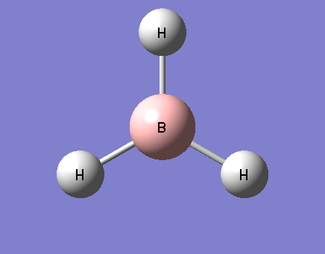
Optimal B-H Bond Distance:1.19143Å.
Optimal H-B-H Bond Angle:120.00°
File:SS2310 NEW 6-31G DP BASIS SET.LOG
A basis set is a rough representation of individual atomic orbitals. Using a higher basis set such as 6-31G (d,p) allows for greater accuracy when performing optimisation. A larger basis set means that more functions are used to determine electronic structure and greater attention given to electronic interactions. However, this means that it will take longer to reach the final optimised structure - a compromise must be struck between accuracy and time available. The optimisation calculation was set up as follows in Gaussian - 1. Opened 3-21G BH3 optimised log file 2. Method: B3LYP approximation chosen, DFT, used a 6-31G basis set alonsisde specifying specific d and p functions 3. Titled calculation file e.g. 'BH3 6-31G basis set optimisation' 4. Added the additional keyword 'nosymm' which ensured that the correct minimum energy was reached 5. Submitted new optimisation file to Gaussian
        Item               Value     Threshold  Converged?
 Maximum Force            0.000434     0.000450     YES
 RMS     Force            0.000284     0.000300     YES
 Maximum Displacement     0.001698     0.001800     YES
 RMS     Displacement     0.001114     0.001200     YES
 Predicted change in Energy=-1.188111D-06
 Optimization completed.
    -- Stationary point found.
| 3-21G | 6-31G d,p | |
|---|---|---|
| Total Energy (AU) | -26.46226338 | -26.61532264 |
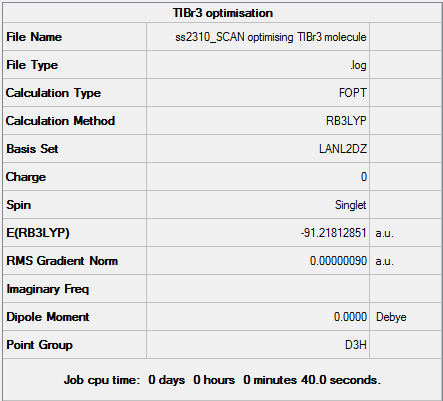
Pseudo-Potentials: TlBr3
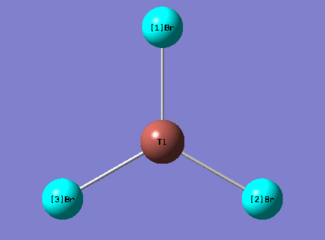
Optimal Tl-Br Bond Distance: 2.65095Å.
Optimal Br-Tl-Br Bond Angle: 120.00°
D-space TlBr3 Optimisation link [1]
Pseudo-potentials are used when dealing with heavy atoms with large electron densities e.g. Thallium (81 electrons). This makes solving the Schrodinger equation very difficult and some relativistic effects may be lost. In order to make the calculation easier, the following approximations can be made - (i) valence electrons are most important when dealing with bonding interactions (ii) core electrons are modelled on special function called a pseudo-potential. This is used when dealing with 3rd row atoms and even 2nd row elements such as P, if there are numerous atoms and therefore electrons involved. The calculation was set up as follows - 1. Restrict TlBr3 symmetry by enabling point group symmetry, selecting D3h and increasing tolerance to 'very high:0.0001'. 2. Opened Gaussian Calculation Set-up and chose Job Type: Optimisation 3. Methods: DFT, B3LYP, medium-level LanL2DZ basis set for heavier elements 4. Titled 'TlBr3 optimisation file' and submitted to SCAN.
         Item               Value     Threshold  Converged?model
 Maximum Force            0.000002     0.000450     YES
 RMS     Force            0.000001     0.000300     YES
 Maximum Displacement     0.000022     0.001800     YES
 RMS     Displacement     0.000014     0.001200     YES
 Predicted change in Energy=-6.084033D-11
 Optimization completed.
    -- Stationary point found.
The optimal literature Tl-Br bond distance value of: 2.468Å.(MP2,R) or 2.520Å.(MP,NR), is in close agreement with my value of 2.65095Å.
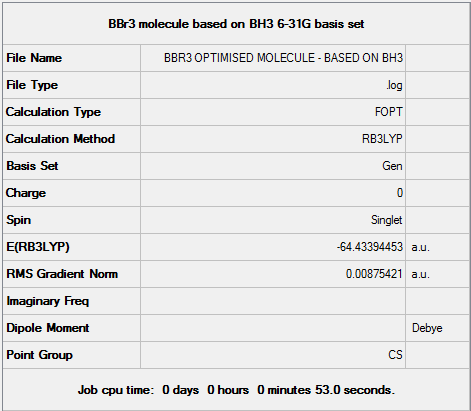
Basic Sets & Pseudo-Potentials: BBr3
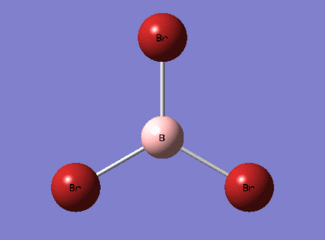
Optimal B-Br Bond Distance:1.98256Å.
Optimal Br-B-Br Bond Angle:119.999°
File:OPTIMISING BBR3 MOLECULE.LOG
         Item               Value     Threshold  Converged?
 Maximum Force            0.000005     0.000450     YES
 RMS     Force            0.000003     0.000300     YES
 Maximum Displacement     0.000027     0.001800     YES
 RMS     Displacement     0.000018     0.001200     YES
 Predicted change in Energy=-2.136864D-10
 Optimization completed.
    -- Stationary point found.
| BH3 | TlBr3 | BBr3 | |
|---|---|---|---|
| Bond distance | 1.19143 | 2.65095 | 1.98256 |
1.What is the effect of changing ligand (Br vs H) on bond distance? BH3 has a shorter optimal bond distance (1.19143Å) compared to BBr3 (1.98256Å). This difference can be attributed to the weaker orbital overlap and hence bonding interaction caused by the more diffuse bromide orbital. B and H are also more similar in energy which, according to the previously mentioned bonding criteria, will result in better orbital overlap. Since a good orbital overlap results in shorter bonds, this explains why BH3 has a shorter, stronger optimal bond length compared to BBr3. 2. What are similarities & differences between Br and H? Similarities: (i) Both the bromide and hydride ions act as Lewis bases - able to donate electron density to the electropositive boron (ii) Both need to form one covalent bond in order to complete their octet.
Differences: (i) The B-Br orbital overlap is based upon donation from a lone pair (Br) into an empty p orbital (B), whereas B-H overlap is purely sigma-based (ii) Bromide ion is much more electronegative and heavier than the hydrogen (iii) BH3 (borane) exists as B2H6 (diborane), whilst BBr3 exists as the specified structure. 3. What is the effect of changing central atom (B vs Tl) on bond distance?
There is an increase in bond length, from 1.98256Å to 2.65095Å when replacing the central boron atom with thallium. Compared to thallium, the boron atom has a closer energy match to the H and Br ligands, which according to the bonding criteria will result in better orbital overlap. The difference in atomic size also plays a role in assessing bond length. Boron (top of group 13) has more concentrated electron density compared to thallium (bottom of group 13) which is not only more diffuse but also has d-orbitals. These d-orbitals screen nuclear charge and lower energy. Again, a better orbital overlap will result in shorter, stronger bond lengths.
4. What are similarities & differences between B and Tl? Similarities: (i) Both Tl and Br are Group 13 elements with a general valence electronic configuration of ns2np1 and (ii) Both are able to form 3 covalent bonds, with 6 valence electrons (iii) Both behave like Lewis acids due to this incomplete octet and hence are electron deficient
Differences: (i) Whilst both can adopt +3 oxidation states, +1 is preferred when going down the group due to Inert Pair Effect (ii) Boron possesses concentrated electron density (atomic radius: 85pm) whereas thallium (atomic radius: 170pm) has more diffuse orbitals, leading to poorer overlap and therefore a longer, weaker bond (iii) Boron is more electronegative than thallium - hence BBr3 bond has higher covalent character.
BH3 Frequency Analysis
The frequency of vibrations can be determined by calculating the 2nd derivative of the potential energy graph. Whilst the 1st derivative tells us whether a stationary point is present, using a 2nd derivative allows us to identify whether it is a minimum or transition state. Specifically, it is a minimum when the 2nd derivative value is positive. It is important when carrying out freq. calculations that the theoretical method and basis set used are identical to that of the opt. calculation. The first derivative is dependent on the zero displacement of the atoms and therefore the second derivative is also dependent on exactly the same geometric arrangement. The 2nd derivative can also be described as a force constant (k) and is used to relate the interaction between vibrational motion and atomic mass. A general example of such a relationship would be Hooke’s Law, which is used to describe frequency modes in a diatomic. We can see from this equation that lighter atoms and stronger bonds will produce faster vibrations. The Frequency Analysis calculation was carried out as follows - 1. Opened 6-31G (d,p) BH3 optimisation file and saved a copy as back-up. 2. Set up Gaussian calculation by specifying Job Type: Frequency. 3. Titled file as 'BH3 frequency analysis' and submitted to Gaussian.
The first row of low frequencies relates to the degrees of freedom available for a non-linear molecule i.e. 3N-6. The closer to zero these values are, the better the opt+freq method used. If the values are less than zero - these are known as ‘imaginary’ frequencies. These may occur as a result of more method or simply the errors caused by modelling an anharmonic oscillation with a harmonic one instead. The second row of low frequencies are known as the ‘real’ normal modes and these are often observed.
Normal Frequency Method
File:SS2310 BH3 FREQUENCY ANALYSIS 5.LOG
 Low frequencies ---  -70.2729  -69.4833  -69.4831   -0.0054    0.0696    0.1596
 Low frequencies --- 1161.4050 1212.1106 1212.1133
 Harmonic frequencies (cm**-1), IR intensities (KM/Mole), Raman scattering
 activities (A**4/AMU), depolarization ratios for plane and unpolarized
 incident light, reduced masses (AMU), force constants (mDyne/A),
 and normal coordinates:
                     1                      2                      3
                    A2"                    E'                     E'
 Frequencies --  1161.4050              1212.1106              1212.1133
 Red. masses --     1.2531                 1.1072                 1.1072
 Frc consts  --     0.9959                 0.9584                 0.9584
 IR Inten    --    92.7100                13.9814                13.9851
  Atom  AN      X      Y      Z        X      Y      Z        X      Y      Z
     1   5     0.00   0.00   0.16     0.00   0.10   0.00    -0.10   0.00   0.00
     2   1     0.00   0.00  -0.57     0.00   0.08   0.00     0.81   0.00   0.00
     3   1     0.00   0.00  -0.57     0.39  -0.59   0.00     0.14  -0.39   0.00
     4   1     0.00   0.00  -0.57    -0.39  -0.59   0.00     0.14   0.39   0.00
                     4                      5                      6
                    A1'                    E'                     E'
 Frequencies --  2587.8017              2721.5056              2721.5067
 Red. masses --     1.0078                 1.1273                 1.1273
 Frc consts  --     3.9765                 4.9196                 4.9196
 IR Inten    --     0.0000               126.1380               126.1284
  Atom  AN      X      Y      Z        X      Y      Z        X      Y      Z
     1   5     0.00   0.00   0.00     0.11   0.00   0.00     0.00   0.11   0.00
     2   1     0.00  -0.58   0.00     0.02   0.00   0.00     0.00  -0.81   0.00
     3   1     0.50   0.29   0.00    -0.60  -0.36   0.00    -0.36  -0.19   0.00
     4   1    -0.50   0.29   0.00    -0.60   0.36   0.00     0.36  -0.19   0.00
Using a general frequency analysis preserves symmetry but results in very large 'imaginary' frequency values. This indicates there is something wrong with the optimisation used and therefore a 'tighter' approach must be used.
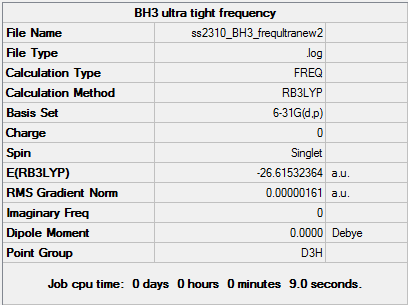
Ultra-tight Frequency Method
File:SS2310 OPTTIGHTFREQUENCY.LOG
This Frequency Analysis calculation was set up in a similar way to the previous one - 1. Opened 6-31G (d,p) BH3 optimisation file and saved a copy as back-up. 2. Set up Gaussian calculation by specifying Job Type: Opt&Freq 3. Additional keywords used were 'opt=tight' 4. Titled calculation as 'Tight BH3 frequency analysis' and submitted to Gaussian.
 Low frequencies ---   -0.7130   -0.4232   -0.0055   11.6926   15.5444   15.5607
 Low frequencies --- 1163.0296 1213.2051 1213.2078
 Harmonic frequencies (cm**-1), IR intensities (KM/Mole), Raman scattering
 activities (A**4/AMU), depolarization ratios for plane and unpolarized
 incident light, reduced masses (AMU), force constants (mDyne/A),
 and normal coordinates:
                     1                      2                      3
                    A2"                    ?A                     ?A
 Frequencies --  1163.0296              1213.2051              1213.2078
 Red. masses --     1.2531                 1.1072                 1.1072
 Frc consts  --     0.9987                 0.9601                 0.9601
 IR Inten    --    92.5448                14.0567                14.0603
  Atom  AN      X      Y      Z        X      Y      Z        X      Y      Z
     1   5     0.00   0.00   0.16     0.00   0.10   0.00    -0.10   0.00   0.00
     2   1     0.00   0.00  -0.57     0.00   0.08   0.00     0.81   0.00   0.00
     3   1     0.00   0.00  -0.57     0.39  -0.59   0.00     0.14  -0.39   0.00
     4   1     0.00   0.00  -0.57    -0.39  -0.59   0.00     0.14   0.39   0.00
                     4                      5                      6
                    ?B                     ?A                     ?A
 Frequencies --  2582.1603              2715.3191              2715.3203
 Red. masses --     1.0078                 1.1273                 1.1273
 Frc consts  --     3.9591                 4.8972                 4.8972
 IR Inten    --     0.0000               126.3342               126.3247
  Atom  AN      X      Y      Z        X      Y      Z        X      Y      Z
     1   5     0.00   0.00   0.00     0.11   0.00   0.00     0.00   0.11   0.00
     2   1     0.00  -0.58   0.00     0.02   0.00   0.00     0.00  -0.81   0.00
     3   1     0.50   0.29   0.00    -0.60  -0.36   0.00    -0.36  -0.19   0.00
     4   1    -0.50   0.29   0.00    -0.60   0.36   0.00     0.36  -0.19   0.00
Using an ultra-tight frequency analysis method ensured that the 'imaginary' low frequency values were close to 0. This leads to better electronic density and energy wave function. Whilst the new method was clearly superior to the first approach and D3h point group preserved, the symmetry of the system was broken.
The output from the Frequency analysis was analysed by observing the vibration animations of BH3. The calculation was carried out as follows - 1. Opened BH3 Frequency file, selected 'Results' tab and chose 'Vibrations' 2. In the 'Display Vibrations' window, select 'Show Displacement Vectors' and start animation.
BH3 Vibration Summary Table
| No. | Motions | Discussion | Frequency | Intensity | Symmetry D3h point group | |||
|---|---|---|---|---|---|---|---|---|
| 1 |
|
Out of plane bending: z direction. There is a back-and-forth motion of the 3 hydrogen atoms occurring in the z plane. There is a change in the angle between two B-H bonds. All three orbitals are moving in the same direction and hence we would expect to see movement in the z co-ordinate axis - this is confirmed by the frequency log file which tells us that were 3 changes of (-0.57) under the z column. This also makes sense when checking against the D3h point group which correlated A2’’ symmetry with (z) movement. | 1161.40 | 92.7100 | A2 | |||
| 2 |
|
Scissoring (in-plane bending): x,y direction. Two of the hydrogen atoms bend towards each other as the other hydrogen experiences a stretching vibration. Consequently, there is a change in dipole moment in both the x and y plane. We can check that this is correct by looking at the x and y columns under the E’ irreducible representation in the BH3 freq log file. Indeed, there is a change of (-0.39) in the x axis and two (-0.59) in the y axis. Again, checking against the D3h point group shows us that E’ expects to have movement in (x,y) directions. | 1212 | 13.9851 | E' | |||
| 3 |
|
Rocking (bending) : x,y direction. Two of the hydrogens rock at the same time towards the third hydrogen. This is slightly different to the asymmetric bending in vibration mode 3 as instead of hydrogen atoms no. 1&2 rocking and no. 3 stretching, this time all 3 are engaged in a rocking motion. This means there is a change in dipole moment in both the x and y plane again. The freq log file tells us that there was a change of (-0.36) in the y axis and two changes of (-0.6) in x axis. | 2587.80 | 13.9851 | E' | |||
| 4 |
|
Symmetrical stretching: all 3 B-H bonds are experiencing shortening and elongating. The charge across the molecule may be unevenly distributed due to symmetric deformations. An overall negative charge or positive charge is placed on the atoms | 2587.80 | 0.0000 | A1' bend | |||
| 5 |
|
Asymmetrical stretching: Two of the B-H bonds shorten and lengthen alternately. There is consequently a change in the dipole moment of the molecule. The freq log file tells us that there were two changes of (-0.60) in the x plane and a change of (0.36) in the y plane. | 2721.51 | 126.1380 | E' stretch | |||
| 6 |
|
Asymmetrical stretching: Two of the B-H bonds engage in shortening and lengthening of bonds at the same time. The third B-H bond also takes part in stretching vibrations but has opposite motion to the other two. That is, as first two B-H bonds shorten - the third B-H bond lengthens. This again leads to a change in dipole moment and is IR active. | 2721.51 | 126.1284 | E' stretch |
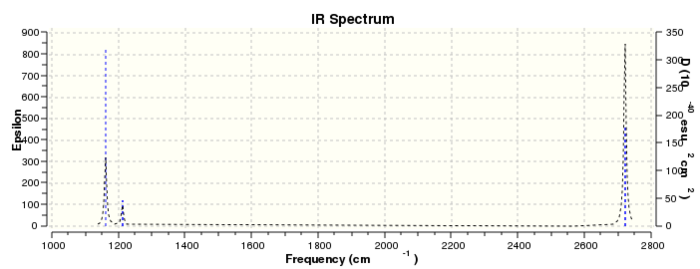
An IR peak is observed when there is an unequal electron density distribution across the molecule. A dipole moment is calculated by using values relating to the bond length and fractional charge on each atom. The reason why there are less than 6 peaks is because some of the BH3 vibrations do not result in a dipole moment change.
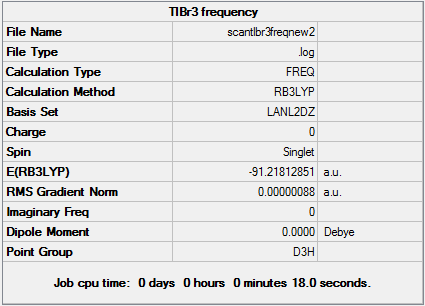
TlBr3 Frequency Analysis
D-space TlBr3 Frequency Analysis link [2]
 Low frequencies ---   -3.4213   -0.0026   -0.0004    0.0015    3.9367    3.9367
 Low frequencies ---   46.4289   46.4292   52.1449
 Harmonic frequencies (cm**-1), IR intensities (KM/Mole), Raman scattering
 activities (A**4/AMU), depolarization ratios for plane and unpolarized
 incident light, reduced masses (AMU), force constants (mDyne/A),
 and normal coordinates:
                     1                      2                      3
                    E'                     E'                     A2"
 Frequencies --    46.4289                46.4292                52.1449
 Red. masses --    88.4613                88.4613               117.7209
 Frc consts  --     0.1124                 0.1124                 0.1886
 IR Inten    --     3.6867                 3.6867                 5.8466
  Atom  AN      X      Y      Z        X      Y      Z        X      Y      Z
     1  81     0.00   0.28   0.00    -0.28   0.00   0.00     0.00   0.00   0.55
     2  35     0.00   0.26   0.00     0.74   0.00   0.00     0.00   0.00  -0.48
     3  35     0.43  -0.49   0.00    -0.01  -0.43   0.00     0.00   0.00  -0.48
     4  35    -0.43  -0.49   0.00    -0.01   0.43   0.00     0.00   0.00  -0.48
                     4                      5                      6
                    A1'                    E'                     E'
 Frequencies --   165.2685               210.6948               210.6948
 Red. masses --    78.9183               101.4032               101.4032
 Frc consts  --     1.2700                 2.6522                 2.6522
 IR Inten    --     0.0000                25.4830                25.4797
  Atom  AN      X      Y      Z        X      Y      Z        X      Y      Z
     1  81     0.00   0.00   0.00     0.42   0.00   0.00     0.00   0.42   0.00
     2  35     0.00  -0.58   0.00     0.01   0.00   0.00     0.00  -0.74   0.00
     3  35     0.50   0.29   0.00    -0.55  -0.32   0.00    -0.32  -0.18   0.00
     4  35    -0.50   0.29   0.00    -0.55   0.32   0.00     0.32  -0.18   0.00
The lowest 'real' mode of TlBr3 is 46.4289cm-1, in the 2nd row of low frequency values.
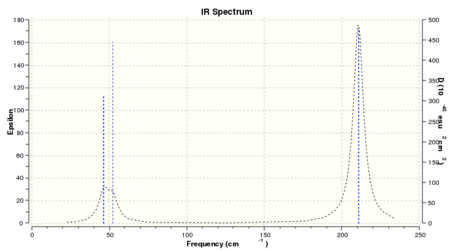
| No. | BH3 vibration frequencies | TlBr3 vibration frequencies |
|---|---|---|
| 1 | 1161.40 | 46.43 |
| 2 | 1212.11 | 46.43 |
| 3 | 2587.80 | 52.14 |
| 4 | 2587.80 | 165.27 |
| 5 | 2721.51 | 210.69 |
| 6 | 27221.51 | 210.69 |
There is a large difference in frequency values between BH3 and TlBr3 due to the size of atoms involved. If we remember that vibrational modes are dependent on how heavy the individual atoms are and the strength of the bond. It is therefore not surprising that TlBr3 has a much lower frequency value. Firstly, Tl is at the bottom of Group 13 with 81 electrons in total compared to B which lies at the top of Group 13 and has only 11 electrons in contrast. Based upon Hooke’s Law, Tl will have a heavier reduced mass compared to B and hence slower vibrations. Secondly, the orbital overlap between Tl-Br is poor compared to that of B-H. Thallium and bromine have large, diffuse orbitals which do not give good orbital overlap and consequently the bond strength for Tl-Br will be weaker than B-H. The spectra are similar in that there appear to be 4 primary peaks of interest - (A1’, 2E’ and A2’’) which are grouped together in pairs at each end of the spectrum. The stretching modes of A1’ and E’ lie at higher energy in comparison to the bending modes of A2’’ and E’. This is due to the differing energies when carrying out each type of vibration. Re-ordering of the modes has occurred when comparing the IR spectrum of BH3 and TlBr3. The lowest frequency peak in BH3 is now the second-lowest peak in TlBr3 which suggests that more energy is needed in order to carry out bending vibrations.
Why is it important to use the same method and basis set for opt and freq? As stated previously, it is important that the same theoretical method and basis set is used because the first derivative (force) is dependent on the zero displacement of the atoms and therefore the second derivative (force constant) is also dependent on exactly the same geometric arrangement. It is also important that a freq calculation is carried out a stationary point e.g. minimum, as otherwise the values do not make sense.
Molecular Orbitals
In order to assess the MOs and charge distribution of the BH3 molecule, a population analysis must be carried out. This involved the following steps: 1. Opened the BH3 optimised .chk file 2. Changed Job type: Energy, NBO: Full NBO and additional keywords: pop=full. 3. Titled file 'MO and NBO analysis' and submitted to HPLC. To visualise the MOs, the population analysis .chk file must be selected. Then select 'Edit', 'MOs' and use the 'Visualise' tab to look at HOMO, LUMO and occupied orbitals. D-space BH3 Population Analysis link [3]
MO Energy Diagrams

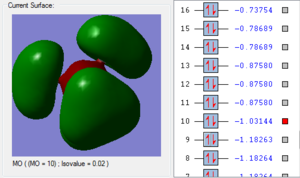
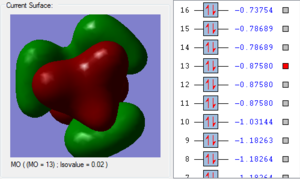
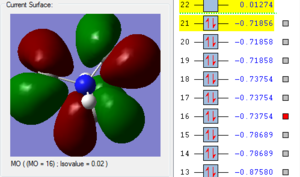
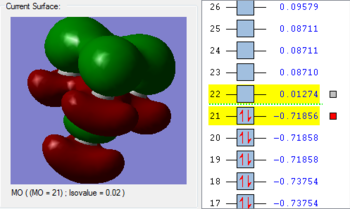
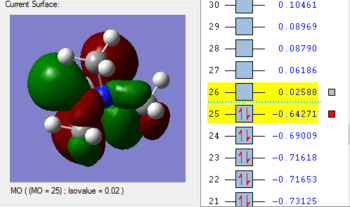
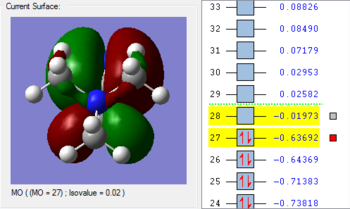
1. The 2a1’ MO has in-phase overlap and therefore experiences strong bonding interactions. The ‘real’ image shows that there is extensive electron delocalisation over the entire molecule. There is an increase in electron density between the B and H nuclei and therefore the molecule is stabilised. The interaction is sigma-sigma which fits the rule that bonding orbitals can only be formed if the separate orbitals possess the same symmetry. The MO does show that it is bonding overall but pays more detail to the relative contributions of each element to the overall electron delocalisation. There is an overall decrease in energy compared to the individual atomic orbitals as the system has been stabilised.
2. The 1e’ MO has in-phase overlap and therefore experiences strong bonding interactions. Again, an increase in electron density between the B and H nuclei means that the molecule is stabilised. The interaction is pi-pi which fits the rule that bonding orbitals can only be formed if the separate orbitals possess the same symmetry.
3. The second 1e’ MO also has in-phase overlap and experiences strong bonding interactions. The ‘real’ image shows that there is electron delocalisation over the entire molecule. There is an increase in electron density between the B and H nuclei and again the molecule is stabilised relative tot he contributing atomic orbitals. The interaction is pi(z)-sigma which fits the rule that bonding orbitals can only be formed if the separate orbitals possess the same symmetry.
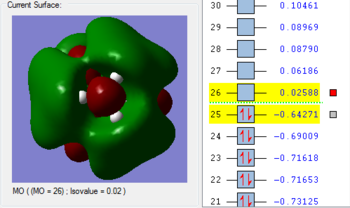
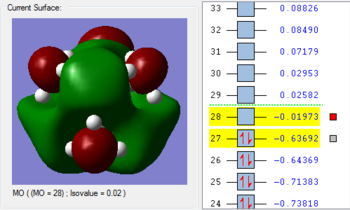
4. The 1a2’’ MO is non-bonding and is essentially a 2p boron orbital. As boron only has 6 valence electrons, the first 3 MOs are occupied whilst the 1a2’’ orbital acts as the LUMO. However, BH3 is a strong Lewis acid precisely because of: (i) non-bonding, unoccupied LUMO (ii) small HOMO-LUMo gap. This MO remains at the same energy as the original atomic orbital.
5. The 3a1’ MO is anti-bonding due to the presence of nodes between B and H. There are out-of-phase interactions which occur between opposite phases. Whilst there are weak in-phase space interaction between the H atoms, this is cancelled out by the much stronger B-H out-of-phase interactions. As a consequence, the interaction between atomic orbitals is destabilised and we see an increase in energy.
6. The 2e’ MO is also strongly anti-bonding due to the presence of nodes between B and H. There are out-of-phase interactions which occur between opposite phases and hence lead to an increase in energy.
7. The second 2e’ MO is also strongly anti-bonding again due to the presence of nodes between B and H. The pi(z) interacts disfavourably with an opposite phase H sigma orbital. There are out-of-phase interactions which occur between opposite phases and hence lead to an increase in energy.
D3h point group diagram reference[1]
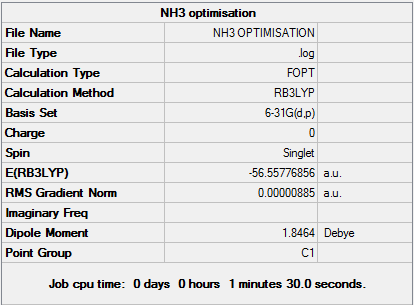
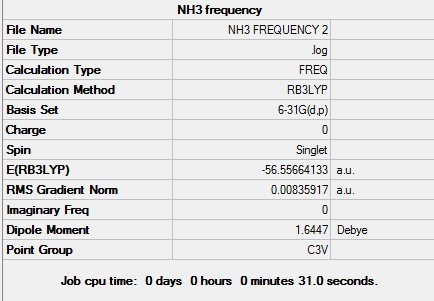
Natural Bond Orbital Analysis: NH3
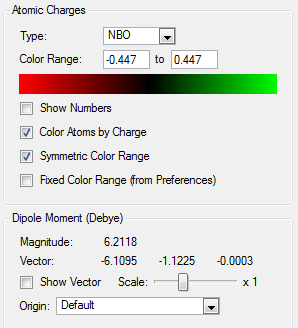
In order to view the charge distribution over a molecule, it is important to select the output (.log) file this time. Select "Results' and 'Charge Distribution'. Set 'NBO' as type and use the 'Colour Atoms by charge' option to see how charge is distributed. For example, the more negatively charged atoms would be red whereas the more positively charged atoms would appear green. It is also possible to assess the relative atomic contributions to the bond and hybridisation present by selecting the 'View file' option and looking at the percentages of s and p orbital character involved.
         Item               Value     Threshold  Converged?
 Maximum Force            0.000024     0.000450     YES
 RMS     Force            0.000012     0.000300     YES
 Maximum Displacement     0.000079     0.001800     YES
 RMS     Displacement     0.000053     0.001200     YES
 Predicted change in Energy=-1.629731D-09
 Optimization completed.
    -- Stationary point found.
 Low frequencies ---  -30.7295   -0.0009   -0.0004    0.0012   20.1705   28.2664
 Low frequencies --- 1089.5535 1694.1244 1694.1856
 Harmonic frequencies (cm**-1), IR intensities (KM/Mole), Raman scattering
 activities (A**4/AMU), depolarization ratios for plane and unpolarized
 incident light, reduced masses (AMU), force constants (mDyne/A),
 and normal coordinates:
File:NH3 POPULATION ANALYSIS.LOG
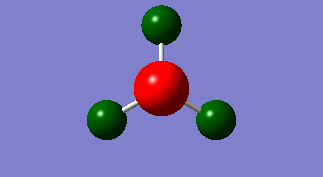
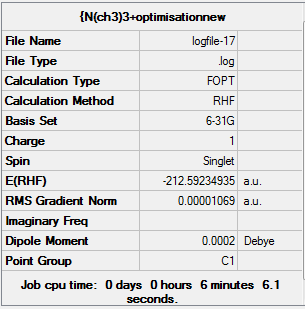
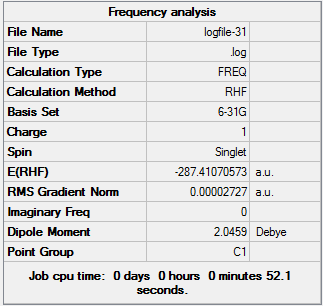
NH3 has a charge range of (-1.132 - 1.132). The specific charge densities are as follows: (i) N = -1.132 (ii) H + 0.377
Ammonia Borane (NH3BH3)Association Energies
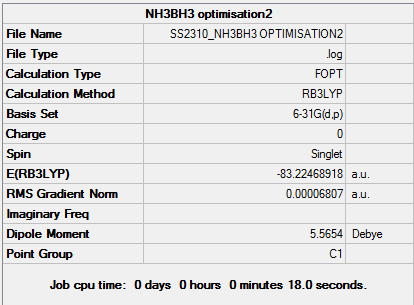
D-space NH3BH3 Optimisation link [4]
        Item               Value     Threshold  Converged?
 Maximum Force            0.000137     0.000450     YES
 RMS     Force            0.000063     0.000300     YES
 Maximum Displacement     0.000740     0.001800     YES
 RMS     Displacement     0.000456     0.001200     YES
 Predicted change in Energy=-2.036077D-07
 Optimization completed.
    -- Stationary point found.
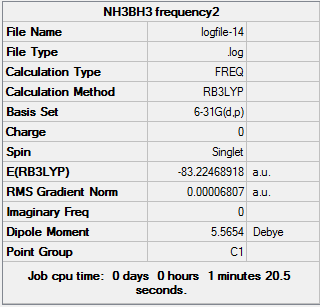
D-space NH3BH3 Frequency link [[5]]
Low frequencies ---   -0.0005    0.0007    0.0011   17.1593   22.5693   38.9127
 Low frequencies ---  265.8805  632.3786  639.0710
 Harmonic frequencies (cm**-1), IR intensities (KM/Mole), Raman scattering
 activities (A**4/AMU), depolarization ratios for plane and unpolarized
 incident light, reduced masses (AMU), force constants (mDyne/A),
 and normal coordinates:
| NH3 | BH3 | NH3BH3 | |
|---|---|---|---|
| Energy (AU) | -56.5566413 | -26.6153226 | -83.2246892 |
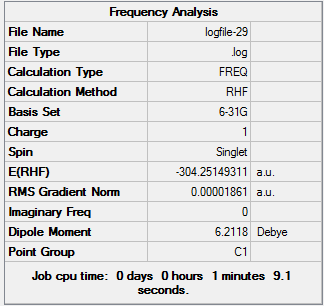
Energy difference (AU): -83.2246892-[-56.5566413 + -26.6153226] = -0.0527252 Energy difference (kJ/mol): 1 a.u = 2625.50kJ/mol, therefore -0.0527252 a.u = -133.16kJ/mol
It is important to note that there is a known energy error of approximately 10kJ/mol. This means that the above energy difference value in kJ/mol is accurate within 10%.
WEEK TWO - Ionic Liquids: Designer Solvents
[N(CH3)4]+ Optimisation, Frequency Analysis, MO and NBO Analysis
D-space [N(CH3)4]+ Optimisation link [6]
         Item               Value     Threshold  Converged?
 Maximum Force            0.000022     0.000450     YES
 RMS     Force            0.000007     0.000300     YES
 Maximum Displacement     0.000390     0.001800     YES
 RMS     Displacement     0.000105     0.001200     YES
 Predicted change in Energy=-9.351538D-09
 Optimization completed.
    -- Stationary point found.
D-space [N(CH3)4]+ Frequency Analysis link [7]
 Low frequencies ---   -3.7277   -2.8250   -1.5923   -0.0008    0.0002    0.0003
 Low frequencies ---  188.7538  294.0335  294.0805
 Harmonic frequencies (cm**-1), IR intensities (KM/Mole), Raman scattering
 activities (A**4/AMU), depolarization ratios for plane and unpolarized
 incident light, reduced masses (AMU), force constants (mDyne/A),
 and normal coordinates
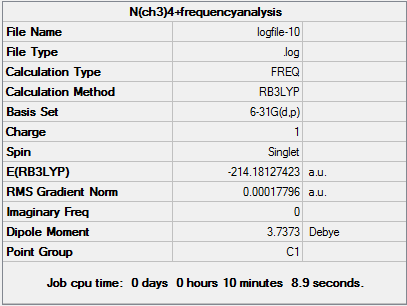
[N(CH3)4]+ adopts a tetrahedral geometry with bond angles of 109.5°. This geometry is adopted in an attempt to relieve strain and therefore lower the overall energy of the molecule.
D-space [N(CH3)4]+ Population Analysis link [8]
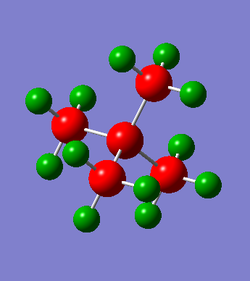
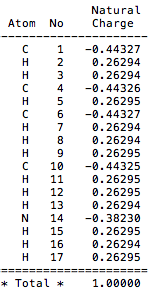
The charge distribution for [N(CH3)4]+ is (-0.443 - 0.443).
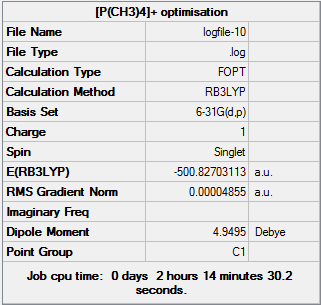
[P(CH3)4]+ Optimisation, Frequency Analysis, MO and NBO Analysis
D-space [P(CH3)4]+ Optimisation link [9]
         Item               Value     Threshold  Converged?
 Maximum Force            0.000045     0.000450     YES
 RMS     Force            0.000021     0.000300     YES
 Maximum Displacement     0.001260     0.001800     YES
 RMS     Displacement     0.000378     0.001200     YES
 Predicted change in Energy=-1.038293D-07
 Optimization completed.
    -- Stationary point found.
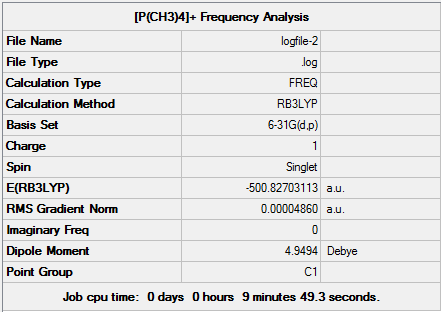
D-space [P(CH3)4]+ Frequency Analysis link [10]
 Low frequencies ---   -2.7573    0.0014    0.0024    0.0031   16.0407   28.1904
 Low frequencies ---  161.4785  192.5081  196.0545
 Harmonic frequencies (cm**-1), IR intensities (KM/Mole), Raman scattering
 activities (A**4/AMU), depolarization ratios for plane and unpolarized
 incident light, reduced masses (AMU), force constants (mDyne/A),
 and normal coordinates:
D-space [P(CH3)4]+ Population Analysis link [11]
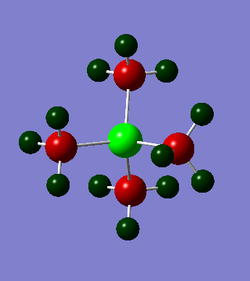
The charge distribution for [P(CH3)4]+ is (-0.774 - 0.774).
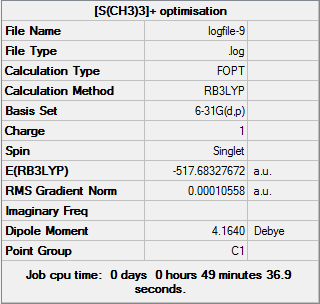
[S(CH3)3]+ Optimisation, Frequency Analysis, MO and NBO Analysis
D-space [S(CH3)3]+ Optimisation link [12]
         Item               Value     Threshold  Converged?
 Maximum Force            0.000026     0.000450     YES
 RMS     Force            0.000008     0.000300     YES
 Maximum Displacement     0.000490     0.001800     YES
 RMS     Displacement     0.000184     0.001200     YES
 Predicted change in Energy=-1.717183D-08
 Optimization completed.
    -- Stationary point found.
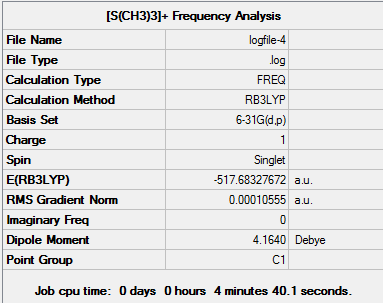
D-space [S(CH3)3]+ Frequency Analysis link [13]
Low frequencies ---    0.0022    0.0028    0.0035    2.1537    2.1772    3.7291
 Low frequencies ---  144.9092  175.3170  175.3243
 Harmonic frequencies (cm**-1), IR intensities (KM/Mole), Raman scattering
 activities (A**4/AMU), depolarization ratios for plane and unpolarized
 incident light, reduced masses (AMU), force constants (mDyne/A),
 and normal coordinates:
D-space [S(CH3)3]+ Population Analysis link [14]
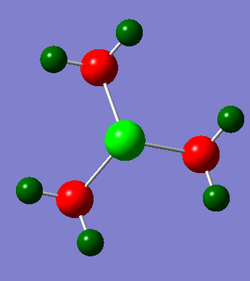
The charge distribution for [S(CH3)3]+ is (-0.774 - 0.774).
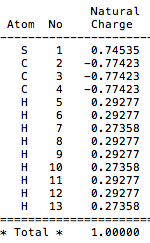
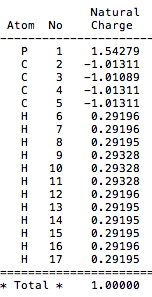
Comparison of charge distribution across cations: [N(CH3)4]+ has negative charges on both the nitrogens and carbon atoms, with strongly positive charges on the hydrogens. [P(CH3)4]+ by contrast has the central phosphorous atom as having high positive charge. Whilst the carbons still have negative charge, the hydrogens are not as positively charged as in [N(CH3)4]+. The [S(CH3)3]+ cation is similar to [P(CH3)4]+ in how charge is approximately distributed over the molecular. The central sulphur is positely charges, carbons negatively charged and hydrogens positively charged.
Discussion of C/X respective contribution to C-X bond 1. [N(CH3)4]+ : First bond between carbon (atom 1) and nitrogen (atom 2) possesses the following contributions: 32% of the bond is contributed from the C orbitals which have a hybridisation of 21%s+79%p, whilst 68% of the bond comes from the N orbital which has hybridisation of 25%s+75%p.
- N has formed 4 approximate sp3 hybrid orbitals that interact with the sAO of one hydrogen atom.
2. [P(CH3)4]+: First bond between phosphorous (atom1) and carbon (atom 2) possesses the following contributions: 57% of the bond is contributed from the C orbitals which have a hybridisation of 23%s+77%p, whilst 43% of the bond comes from the P orbital which has hybridisation of 25%s+75%p.
- P has formed 4 approximate sp3 hybrid orbitals that interact with the sAO of one hydrogen atom.
3. [S(CH3)3]+: First bond between sulphur (atom 1) and carbon (atom 2) possesses the following contributions: 46% of the bond is contributed from the C orbitals which have a hybridisation of 17%s+83%p, whilst 54% of the bond comes from the sulphur orbital which has hybridisation of 18%s+83%p
- S has formed 3 approximate sp2 hybrid orbitals that interact with the sAO of one hydrogen atom.
In [N(CH3)4]+ the specific charge on the nitrogen atom is in fact (-0.392) which is negative and therefore in disagreement with the diagram. The charge density image shows us that in fact the positive charge lies on the carbon attached to the oxygen.
Functional Groups Influence
[N(CH3)3(CH2OH)]+ Optimisation, Frequency Analysis, MO and NBO Analysis
D-space [N(CH3)3(CH2OH)]+ Optimisation link [15]
        Item               Value     Threshold  Converged?
 Maximum Force            0.000137     0.000450     YES
 RMS     Force            0.000022     0.000300     YES
 Maximum Displacement     0.001431     0.001800     YES
 RMS     Displacement     0.000349     0.001200     YES
 Predicted change in Energy=-8.506803D-08
 Optimization completed.
    -- Stationary point found.
D-space [N(CH3)3(CH2OH)]+ Frequency Analysis link [16]
Low frequencies ---   -1.7622   -0.0009   -0.0009    0.0005    2.2863    4.1204
 Low frequencies ---  138.2824  206.3691  236.4506
 Harmonic frequencies (cm**-1), IR intensities (KM/Mole), Raman scattering
 activities (A**4/AMU), depolarization ratios for plane and unpolarized
 incident light, reduced masses (AMU), force constants (mDyne/A),
 and normal coordinates:
D-space [N(CH3)3(CH2OH)]+ Population Analysis link [17]
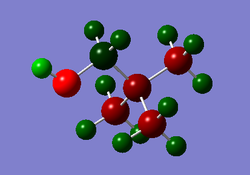
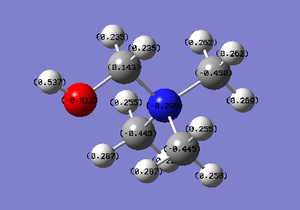
The charge distribution for [N(CH3)3(CH2OH)]+ is (-0.812 - 0.812). The specific charges are as follows: (i) N = -0.396 (ii) O = -0.812 (iii) C (methyl opposite OH group) = -0.450 (iv) Remaining methyl group = -0.445 (v) C (CH2 group) = 0.193
[N(CH3)3(CH2CN)]+ Optimisation, Frequency Analysis, MO and NBO Analysis
D-space [N(CH3)3(CH2CN)]+ Optimisation link [18]
         Item               Value     Threshold  Converged?
 Maximum Force            0.000075     0.000450     YES
 RMS     Force            0.000015     0.000300     YES
 Maximum Displacement     0.001259     0.001800     YES
 RMS     Displacement     0.000329     0.001200     YES
 Predicted change in Energy=-5.822889D-08
 Optimization completed.
    -- Stationary point found.
D-space [N(CH3)3(CH2CN)]+ Frequency Analysis link [19]
 Low frequencies ---   -0.0009   -0.0004    0.0002    2.8009    3.3210    5.2744
 Low frequencies ---   94.4072  173.1077  217.3860
 Harmonic frequencies (cm**-1), IR intensities (KM/Mole), Raman scattering
 activities (A**4/AMU), depolarization ratios for plane and unpolarized
 incident light, reduced masses (AMU), force constants (mDyne/A),
 and normal coordinates
D-space [N(CH3)3(CH2CN)]+ Population Analysis link [20]
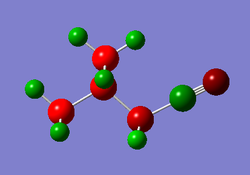

What effect does OH (EWG) and CN (EDG) have on charge distribution? The electron withdrawing hydroxide group causes that immediately-bonded carbon to gain a positive charge. This also affects the methyl group which is geometrically opposite this OH group, as there is an increase in the negative specific charges e.g. C: (-0.450). The remaining carbons on the other two methyl groups have slightly less negative values e.g. C: (-0.445). The central N atom has a more negative specific charge of (-0.396) in comparison to N(CH3)3]+
The electron donating cyanide group has exactly the opposite effect on the immediately-bonded carbon which now gains a strongly negative charge. The C atoms in the methyl groups orthogonal to CN, have a charge of (-0.278). This is slightly less negative than the methyl group opposite the CN bond which has a C value of (-0.271). The central N atom is now much more negative, with a specific charge of (-0.781) - almost double the N specific value when an OH is involved.
Interesting Observation: I found the output files after performing frequency calculations on the optimised 6-31G (d,p) BH3 molecule quite interesting when changing the threshold values. Specifically, when using a normal frequency method: the irreducible representations (symmetry) were preserved but at the cost of large ‘low frequency’ values of approximately -70cm-1 which would suggest that the optimisation was not complete. However, when I used the additional keywords opt=tight - the lower frequency values were greatly reduced but at the cost of breaking symmetry.

