Sg2317
Exercise 1
On a potential energy surface diagram, how is the transition state mathematically defined? How can the transition state be identified, and how can it be distinguished from a local minimum of the potential energy surface?
On a potential energy surface diagram, the transition state can be mathematically defined as ∂V(ri)/∂ri=0 and ∂^2V(ri)/∂ri^2 will have a value of equal magnitude but opposing signs.
It is the maximum on the minimum energy path that links reactants and products. The gradient of the potential is also zero.
That's what you wrote above: ∇V is zero for all components. The one with the second derivative is not quite correct though. Maybe you remember the first year computational lab. Back then, you identified a local minimum as the hessian being positive definite - i.e. having no imaginary frequency. For a transition state, you have exactly one negative second derivative, yet still a stationary point. Fdp18 (talk) 07:53, 4 May 2019 (BST)
It can be distinguished from a local minimum of the potential energy surface by starting trajectories near where you think the transition state may be and see whether they "roll" towards the reactants or products. If it rolls, then it is near the transition state.
Not sure what you mean by 'roll'. It is - in my point of view - acceptable to use such less scientific expressions, but then you have to define them. In case you actually mean the commonly accepted definition of 'rolling towards the reactants or products' like the movement of a sphere on a physical surface with the shape of the PES: This is the case for every point on the PES except the exact TS position. Fdp18 (talk) 08:00, 4 May 2019 (BST)
Report your best estimate of the transition state position (rts) and explain your reasoning illustrating it with a “Internuclear Distances vs Time” plot for a relevant trajectory.
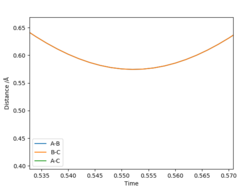
0.574 Angstrom This was deduced as this was the minimum of the internuclear distance plot.
A bit scarce, it is not transparent what you did. In any scientific text, everything should be clearly defined, described and explained, even if it seems boring. How did you obtain the trajectory, and why do you think it is relevant? Where are the other lines that are mentioned in the legend? are they exactly overlapping? A tip I can provide to you is to look at the corresponding point in the PES. Do you think you could balance a sphere on that point if it were a real surface? If not, then it is not a TS.Fdp18 (talk) 08:11, 4 May 2019 (BST)

Comment on how the mep and the trajectory you just calculated differ
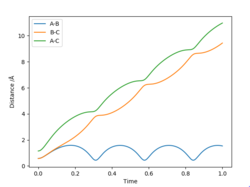
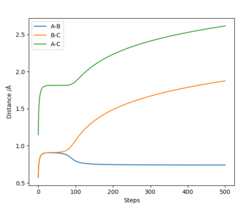
In the dynamics, the atoms vibrate after collisions, whereas in the mep they have no vibrational energy. This can be seen as distances oscillate in an Internuclear distance vs time plot with a dynamics calculation.

You can see in both figures that the distance as a function of time shows a steep increase at the beginning. What could that mean? In case of the actual dynamics trajectory, think in terms of velocity and acceleration. What does Newton's second law tell you about the force at that point? From the force, you can get some information about the PES - can it be a stationary point? In case of the MEP, think of how the surroundings look like. From the MEP, you can infer that your guess for the TS is actually hanging somewhere at a wall, and you also directly see a better guess for a TS... Fdp18 (talk) 08:23, 4 May 2019 (BST)
Also in the dynamics, in general the internuclear distances are larger due to the higher velocity. This can be seen in an Internuclear distance vs time plot with a MEP calculation.

Complete the table by adding the total energy, whether the trajectory is reactive or unreactive, and provide a plot of the trajectory and a small description for what happens along the trajectory. What can you conclude from the table?
| p1 | p2 | Etot | Reactive? | Description of the dynamics |
|---|---|---|---|---|
| -1.25 | -2.5 | -99.018 | Yes | AB approaches C, the bond AB breaks and the bond BC is formed, the system has vibrational energy, atoms vibrate slightly. |
| -1.5 | -2.0 | -100.456 | No | AB approaches C, there is vibrational energy as the atoms are vibrating. However, the bond between A and B does not break and the a bond between B and C does not form. |
| -1.5 | -2.5 | -98.956 | Yes | AB slowly approaches C, the bond AB breaks and BC is formed, the atoms vibrate with more vibrational energy than example 1. |
| -2.5 | -5.0 | -84.956 | Yes | AB quickly approaches C, A and B dissociate and a bond between B and C forms. BC vibrates significantly, however the bond BC breaks and B re-bond with A. There is significant vibrational energy in this system. |
| -2.5 | -5.2 | -83.416 | Yes | AB vibrates a lot, the bond between A and B breaks and a bond between B and C forms, however the atoms b and c are vibrating with so much energy the bond between B and C breaks and we go back over the transition state to the reactants (AB and C). However, we pass over the transition state again and products are eventually formed that vibrate with very high energy |
The fourth trajectory is not reactive, as you correctly mention: '... however the bond BC breaks and B re-bond with A'. Pictures of the trajectories would be very helpful to understand your writing. Fdp18 (talk) 08:28, 4 May 2019 (BST)
State what are the main assumptions of Transition State Theory. Given the results you have obtained, how will Transition State Theory predictions for reaction rate values compare with experimental values?
The main assumption is that once you overcome the energy barrier and pass the transition state then you cannot get back over the transition state back to the reactants and the bond in the product does not break. Transition state theory would overestimate reaction rates because it assumes that after passing the transition state the reaction would only proceed to the products. However, in the reality some reaction go back to the reactant before reaching the products.
Correct - and, as you can see in e.g. the fourth trajectory, some of the reactions go back to the reactants even after reaching the products. Fdp18 (talk) 08:30, 4 May 2019 (BST)
Exercise 2
By inspecting the potential energy surfaces, classify the F + H2 and H + HF reactions according to their energetics (endothermic or exothermic).
F + H2 -> HF + H : is exothermic
HF + H -> H2 + F : is endothermic
For every aspect of your whole career in chemistry, you should get used to explaining yourself. When you write your first paper, you will see that people question every little detail of your work wherever possible. Here, I am missing the reasoning that lead to this conclusion. Although it is admittedly not directly mentioned, 'discuss that' is always inferred. Fdp18 (talk) 08:34, 4 May 2019 (BST)
How does this relate to the bond strength of the chemical species involved? Locate the approximate position of the transition state
The H-F bond is stronger and more thermodynamically stable than H-H due to the strong partially ionic bonding between atoms in HF; due to the large difference in electronegativity of H (2.2) and F (4.0). Hence the formation of H-F (F + H2 -> HF + H) is more energetically favourable and is exothermic as energy is released. And the formation of H2 (HF + H -> H2 = F) is not energetically favourable and is endothermic; as more energy is required to break the strong H-F bond than energy released to make the H-H bond.
Locate the approximate position of the transition state
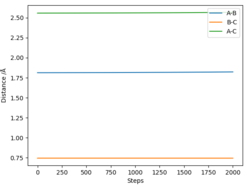
When H and F are 1.813 angstroms apart; and when the two H atoms are is 0.744 apart. Using Hammond's postulate, we know that the transition state is closer in energy to the reactants in an exothermic reaction, therefore on the potential energy surface the coordinates of the transition state were found and plotted in an internuclear distance vs time plot. The gradients are zero which is expected in the transition state as the bonds should not be vibrating.

Report the activation energy for both reactions
F + H2 -> HF + H
Ea = approx 1.68 kJmol-1
HF + H -> H2 + F
Ea = approx 142 kJmol-1
How did you obtain these values? Bear in mind that a wrong result with good reasoning is better than a correct result with no information on how it has been derived. Fdp18 (talk) 08:43, 4 May 2019 (BST)
Identify a set of initial conditions that results in a reactive trajectory for the F + H2, and look at the “Animation” and “Momenta vs Time”
AB distance = 1.5
BC distance = 0.5
Momentum AB = -0.1
Momentum BC = 0.5
In light of the fact that energy is conserved, discuss the mechanism of release of the reaction energy. Explain how this could be confirmed experimentally
During bond making, energy is released; this would be during an exothermic reaction. This could be monitored using calorimetry. If a increase in temperature is recorded, the reaction is exothermic. Furthermore, you can use the equation:
Q=mc(Tf-Ti)
to find enthalpy change; a negative value confirms that it is an exothermic reaction.
That's a valid approach. Another very fancy example that actually uses the fact that the energy is stored in vibration (exactly the same system as in this course: F + H2!) is the fluorine laser. Fdp18 (talk) 08:47, 4 May 2019 (BST)
I am missing the last question which is about Polanyi's rules.Fdp18 (talk) 08:54, 4 May 2019 (BST)
Additionally, you should get in the habit of proper referencing external sources, like the TS theory statements. Even if it was you who formulated the theory, see 'self-plagiarism'.Fdp18 (talk) 09:05, 4 May 2019 (BST)
