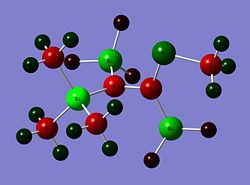
Schlepschd
Report By Melissa Chan, 00554846
Computational Analysis of BH3
Optimisation of BH3
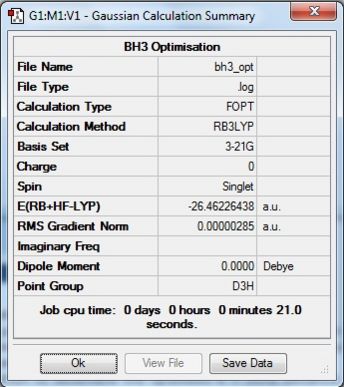
From the DFT modelled optimisation of BH3, the parameters set to obtain the summary of the job run in table 2 is shown in table 1:
| Parameter | |
|---|---|
| Job Type | Optimisation |
| Optimisation Method | DFT, Density Functional Theory |
| Specific DFT method | B3LYP |
| Basis Set | 3-21G |
From the result of this optimisation, the bond lengths and angles are as seen in table 2, compared to its bond lengths and angles before optimisation and to values in literature[1]
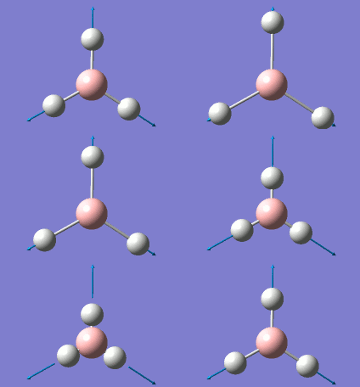
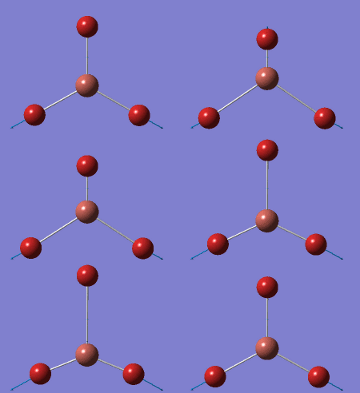
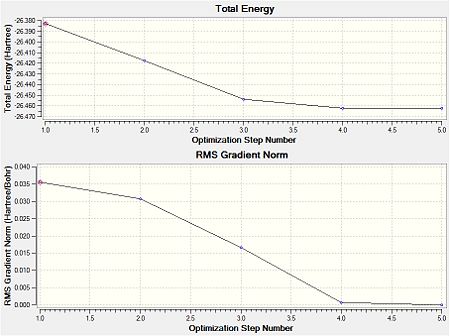
The values obtained from the optimisation have been rounded up to 2 decimal places due to the accuracy of the method to 0.01Å. The value obtained from literature is very comparable to that obtained from the calculations from the DFT modelling, and the bond angles are all at 120o, consistent with each other. The job time of 21 seconds observed in the summary of the job indicates the length of time involving iterations that will eventually result in the .log file for this particular optimisation of BH3. The optimisation of BH3 gives the following diagrams depicting the optimisation steps, and also plotted in a Energy vs RMS Gradient diagram.
| Step No. | Diagram | Particular B-H bond Length/Å | Graphical Plot |
|---|---|---|---|
| 1 | 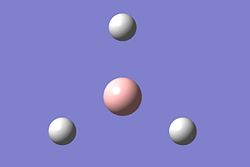 |
 | |
| 2 | 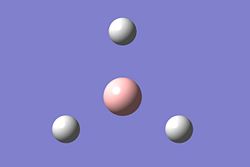 |
||
| 3 |  |
||
| 4 | 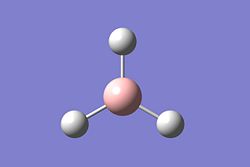 |
The general decrease of the B-H bond length stops at 1.19Å due to the trade-off between repulsive forces (Van der Waals') and the attractive force between the atoms. While the bond length obtained from the optimisation is highly comparable to literature and the convergence of the derivatives of the forces and displacements of the molecule indicates the correct optimisation, the value of the RMS gradient gradually reaches zero, which also indicates that the correct optimisation of BH3. Finally, it can be seen that the initial diagram in entry one does not seem to have any bonds drawn by the GaussView program, and this is due to the inherent character of the program, where it will only draw in bonds when the atoms are within the stipulated bond length (in this case, it is at the optimised bond length of 1.19Å.
Vibrational Analysis of BH3
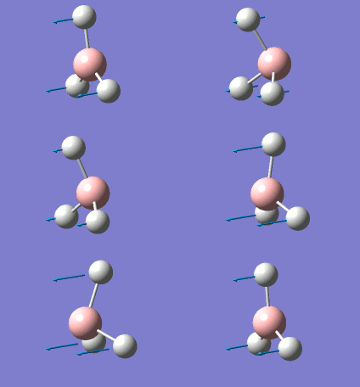
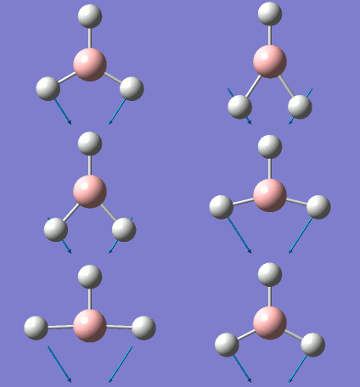
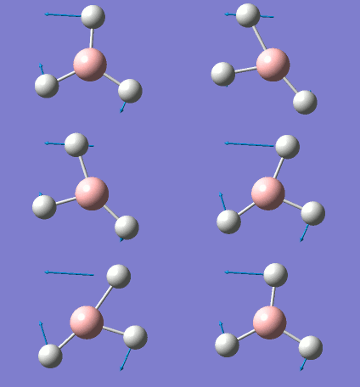
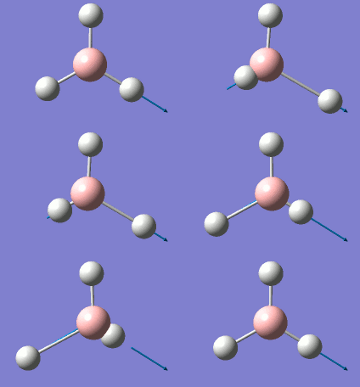
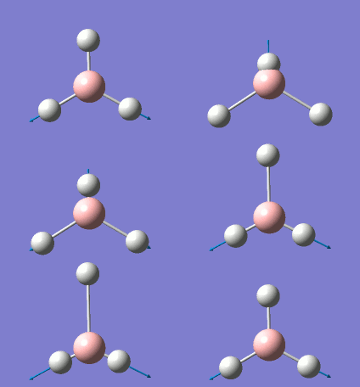
A frequency analysis of BH3 was carried out on the previously optimised molecule. In the following table, the vibrational modes are associated with the frequences and their associated point groups.
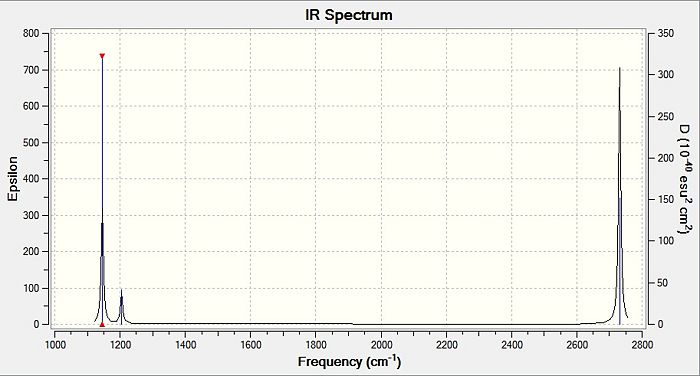
From table 4, the observed intensity for entry 4 is 0.00 due to the cancellation of the dipoles, which leads to a net dipole moment of zero. This is due to the fact that the appearance of a peak on an IR spectrum depends on the changes in dipole moments from the vibration of a molecule. A net zero change in dipole moment will lead to the disappearance of a peak. This implies that the peak at a stretching frequency of 2592cm-1 will not be observed on the IR spectrum (shown below) generated by the calculations. This accounts for the appearance of 5 peaks - of which two of the five peaks have the same stretching frequency, and this happens for another two peaks also - which appears to be only 3 peaks.
MO Representation/Analysis for BH3
The molecular orbital (MO) diagram drawn below with the use of ChemDraw was referenced from the MO diagram for BH3. The relevant MOs derived from the Gaussian calculation for BH3 can be obtained from BH3_MO.log. From the diagram seen below, the MOs were linked to the drawn MO cartoons through pictorial comparison of the two. Through this comparison, the energy levels and molecular orbital representations deduced from theory were reliably comparable to the energy levels and molecular orbitals derived from the calculations.
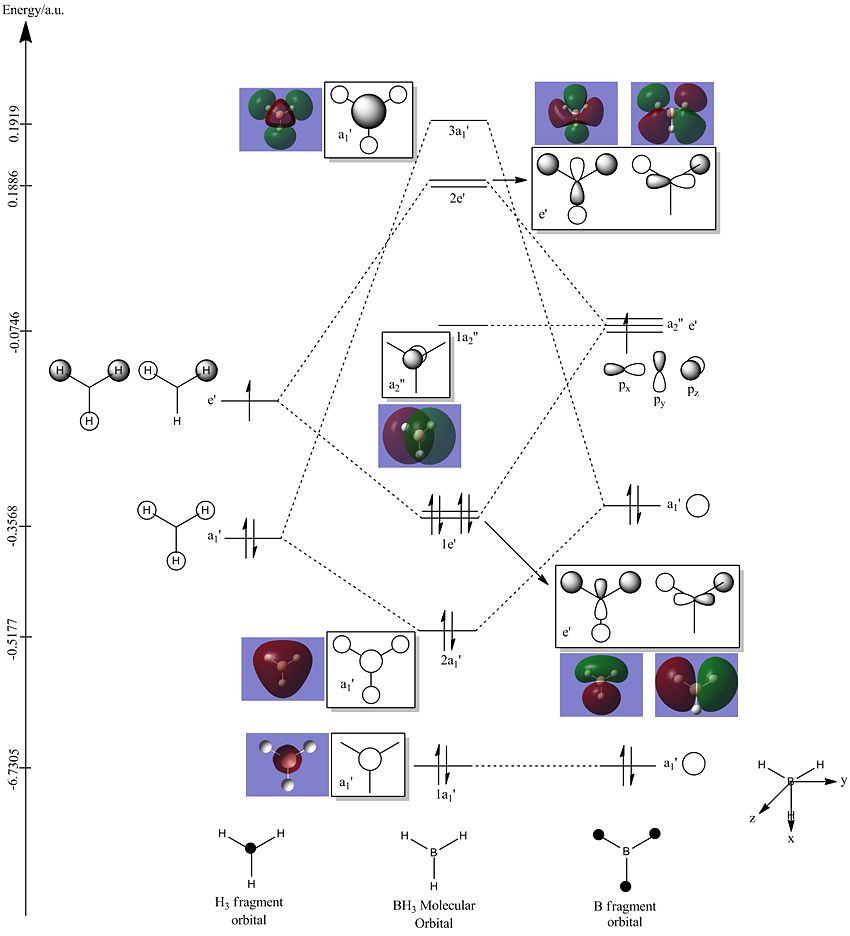
One important thing to note on examination of the MO diagram is that the unoccupied orbitals derived from calculation were much bigger than those deduced from theory. Another point would be that the limitation of MO theory prevents the exact evaluation of the energy level. This is exemplified by the fact that in theory, the 3a' MO energy level was theorised to be lower than the 2e', but this turns out to be the contrary from the MO calculations, where the 3a' level is higher than the 2e' level.
It can be therefore concluded that while MO theory allows for the rough prediction of an MO diagram, computational methods can be usefully employed to give an accurate picture of the bonding situation in the molecule.
For a full resolution view of the MO diagram
NBO Analysis of BH3
The NBO analysis allows for the charge distribution on the BH3 molecule to be calculated, giving numerical answers. From here, some conclusions about the distribution of electrons in the molecule can be made. Examining the coloured charge diagram of BH3, boron is intrisically electron deficient as it has 6 electrons in its valence shell, leading to an empty pz orbital. This causes its lewiss acidity. The trigonal planar geometry of BH3 allows for the deduction that the MOs around BH3 is sp2 hybridised, and hence the contribution of s:p should be 1:2.
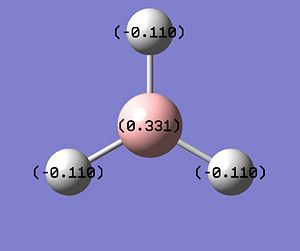
For the B based orbitals, its characteristic is that these orbitals have 33.3% s character and 66.7% p character. This conclusion is in line with the idea that the B orbitals are sp2 hybridised. From the H atom, it has 100% s atoms. Therefore, the point group of BH3 as D3h can be substantiated through its trigonal planar geometry.
The numbers show the relative electronegativity of the atoms, and the diagram above shows that the H atoms have a higher electron density (-0.110) compared to the B atom (0.331). Therefore, the B atom region has an electron deficiency. Additionally, specific data obtained from the log files allowed for the realisation that the B atom contributes 44.49% whilst the H atom contributes 55.51% to the bond. The s orbitals of the H atom very significantly contributes more than what the B orbital contributes to this bond.
Computational Analysis of TlBr3
Introduction
The study of TlBr3 involves 186 electrons in the system, which involves heavy atoms like thallium (81 electrons) and bromine (35 atoms). This molecule will require the use of a larger basis set will take longer and more costly computational time and resources and therefore, Pseudo Potentials are used instead. With the use of Pseudo Potentials, the formal tranformations of the orbitals to pseudo-valance orbitals containing simpler radial nodal structure[2]. These transformed orbitals require even smaller basis sets and will significantly speed up computational calculations.
In this section, TlBr3 is used to test the accuracy and reliability of the PP application on the DFT modelling method. Comparisons to literature values for the bond lengths and angles of the TlBr3 molecule will determine the reliability of the PP application. Additionally, the use of the larger basis set LanL2DZ compared to the 3-21G basis set used for BH3 will amply calculate the relevant MOs of the molecule in study.
Optimisation of the TlBr3 molecule
The summary of the job is shown in the diagram below, with the relevant bond lengths and angles compared to literature[3]. The optimisation output files can be found here: TlBr3 optimisation
| Before Optimisation | After Optimisation | Literature Values | Summary of Job Run | |
|---|---|---|---|---|
| Bond Length/Å | 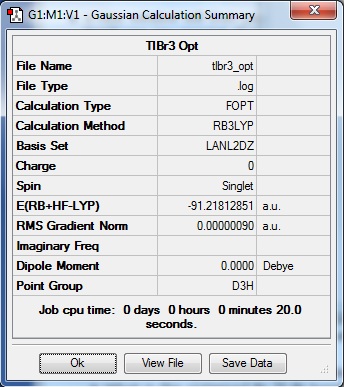 | |||
| Bond Angles/o |
From table 5, the comparison of the optimised bond length and literature value differ by 0.13Å and this could be due to the different experimental conditions in the course of obtaining the averaged bond lengths both experimentally using computational methods and in literature.
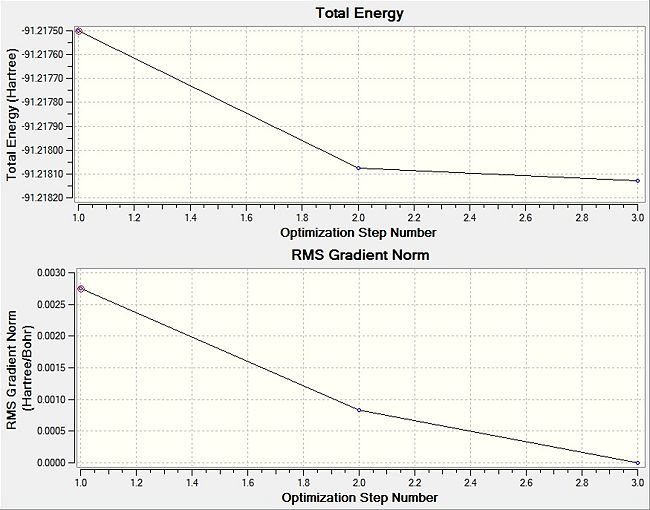
The graphs below demonstrate the gradual decrease as more steps are taken by the system to result in the lowest energy obtained. This indicates the completion of the optimisation process. In the TlBr3 system, the application of the PPs leads to the consideration of the electrons that participate in bonding, speeding up calculations. Yet again, the disparity in bond lengths with literature shows the limitations of applying PPs into the calculations, giving slightly overestimated bond lengths. Some of the ways to make up for this disparity is to use larger basis sets, but this would be a tradeoff with the use of computational resources and time.
What are bonds?
A chemical bond is the interaction between atoms and/or molecules, resulting in a polyatomic compound with its atoms held together by the interactive forces. The types of interactions could be ionic, covalent, dipole-dipole, hydrogen, Van der Waals' and many other interactions that could contribute to the formation of a bond. In short, a bond is an electromagnetic force between positive and negative charges as a result of interaction between electrons and nuclei, or by dipole moments.
In some structures (seen in table 3), GaussView seems to suggest that bonds do not exist between two particular atoms. Contrary to this, the bonds most likely do exist, but is not shown on Gaussview as the programme is built with a list of bond distances geared towards organic molecules. When inorganic molecules are being studied using GaussView, some of the molecules will contain bonds that are longer than that of organic molecules and as a result, the bonds are not drawn by GaussView.
Vibrational Analysis of TlBr3
When the TlBr3 (or any other molecule) is optimised, the calculations are trying to find the structure possessing the lowest energy. At the minimised energy, the gradient of the graph should theoretically be zero, although the methods employed would cause the resultant energy to not be the minimum, but to either be over or underestimated. In order to examine the accuracy of the calculations, a vibrational analysis is typically carried out to see how close the calculations are to the real minimum.
All frequency values obtained should be positive due to the fact that the freuquency is the second derivative of the energy. Implications of a frequency possessing a negative value would mean that the calculations have led to a transition state of the molecule under study, reaching a maximum. There should only be one or less negative frequencies as two or more negative values would imply that the minimisation has not in fact happened.
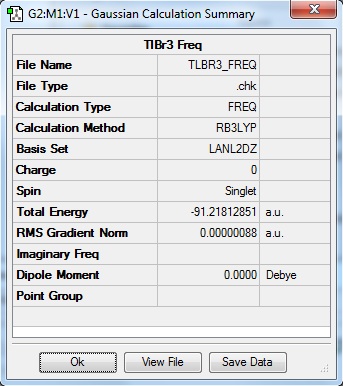
The calculation was deemed successful due to the close similarities in the energy values of the summaries obtained from the optimisation and frequency calculations of TlBr3. This can be seen in the E(RB+HF-LYP) row.
| Optimisation Summary | Frequency Summary |
|---|---|
 |
 |
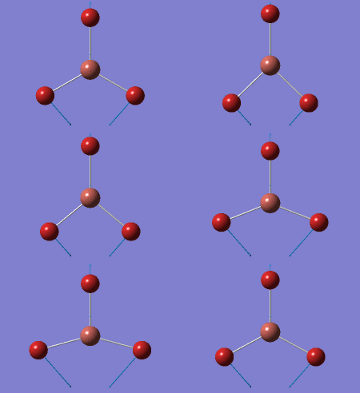
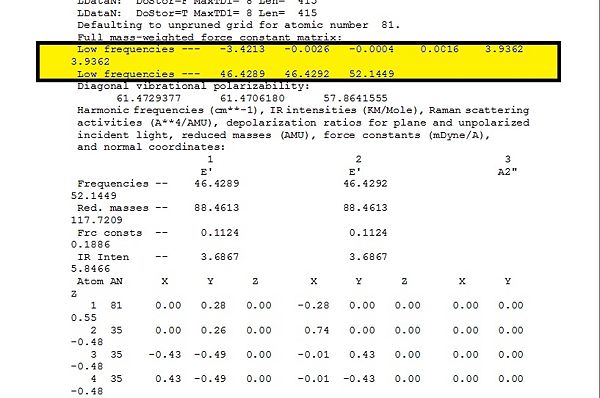
Additionally, the -6 of the formula 3N-6 is exemplified by the existence of the low frequencies shown in the diagram below, which is the first two lines highlighted in yellow. These vibrational frequencies represent the molecular motion of the molecule, and have very low frequencies as compared to the normal frequencies seen in table 6 below. The results of the calculations are reliably good.
A table containing all the stretches observed on GaussView is shown in table 6:
The determination of the point groups of the vibrations are determined by a preliminary examination of the point group of the main TlBr3 molecule.
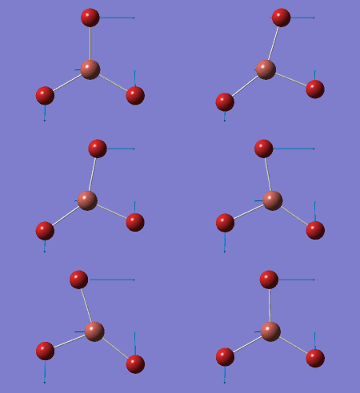
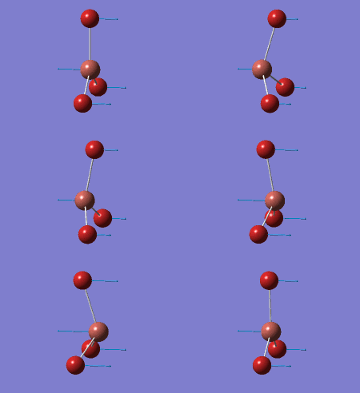
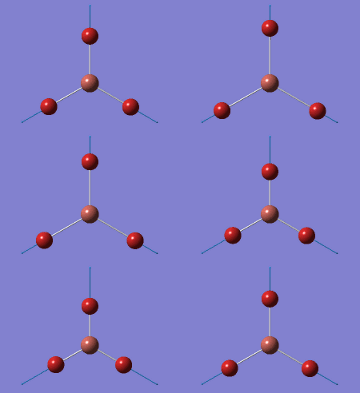
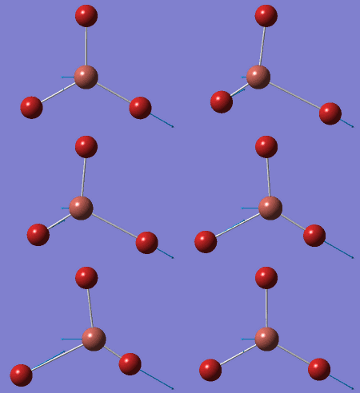
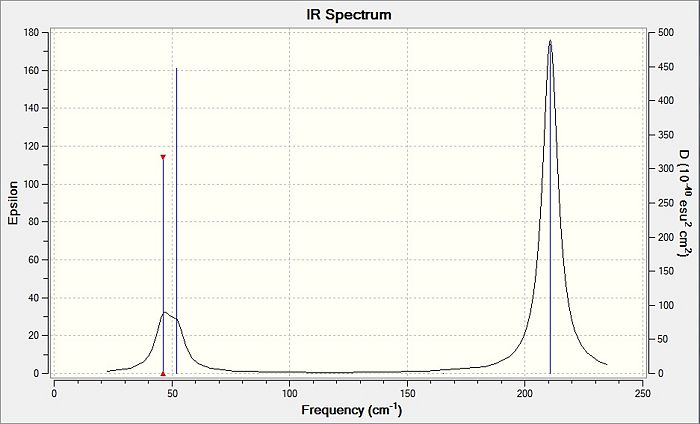
The computed IR spectrum of the TlBr3 is shown in the diagram below. A comparison of the table containing the stretches and the peaks observed on the IR spectrum below shows that several peaks are missing from the IR spectrum. This is due to the fact that a symmetric stretch in entry 4 of table 6 has zero intensity and will not appear in the IR spectrum at all. The vibrations 1 and 2 are degenerate and will therefore appear as 1 peak, and this is the same case for vibrations 5 and 6. For entry 3 in table 6, this vibration appears as a single, strong peak, and all these account for the 3 distinct peaks as shown by the lines drawn on the spectrum.
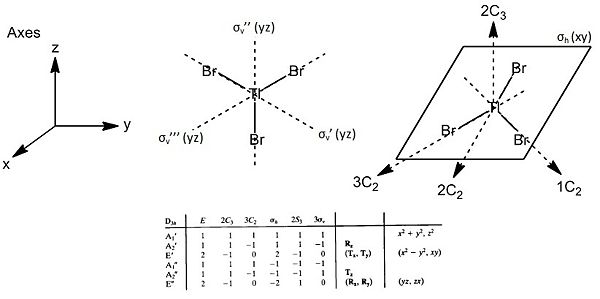
The point groups of the vibration modes of the molecule TlBr3 have been determined by using the following diagrams:
On comparison of the vibrational modes of both TlBr3 and BH3, it is observed that the order in which the vibrations take place are dissimilar. This could chiefly be due to the increase in mass of the atoms, leading to the change in energy requirements for vibrations to occur. As the reduced mass of the molecule is increased, so the vibrational energy content of particular vibrations will also be altered accordingly to give the change in the order of vibrational modes of TlBr3.
Organometallic Complex Mo(CO)4L2
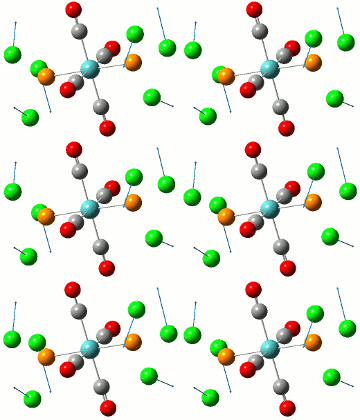
The complex Mo(CO)4L2 is able to form stereoisomers in the cis and trans form. In this section, the two cis and trans isomers of the complex Mo(CO)4(PCl3)2 will be studied to explain why the Infrared spectrum of the cis isomer displays four peaks while the Infrared spectrum of the trans isomer only displays one single sharp peak. The isomers are shown in the diagram below.
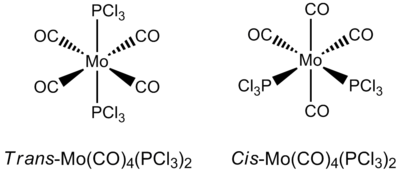
The complex Mo(CO)4(PCl3)2 is used instead of Mo(CO)4(PPh3)2) as the -PPh3 ligand demands more computational time and is not feasible for the purposes of this experiment. Therefore, the -PCl3 ligand is used, as these ligands are known to give similar electronic contributions to the bonding in the complex as phenyl groups, but with the added benefit of a shorter computational time.
Optimisation of the Cis and Trans Isomers
Preliminary Optimisation
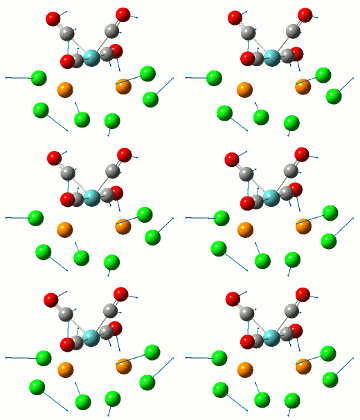
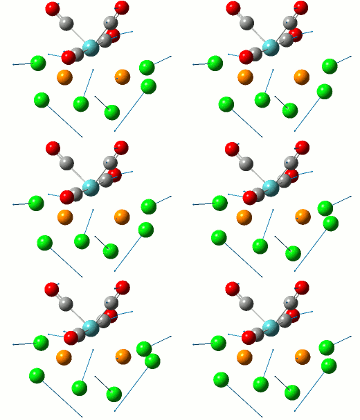
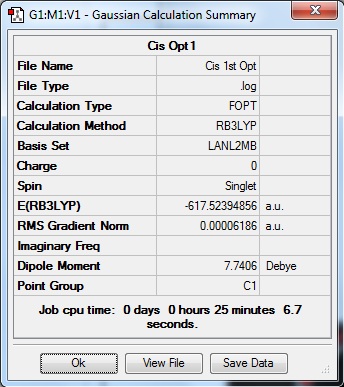
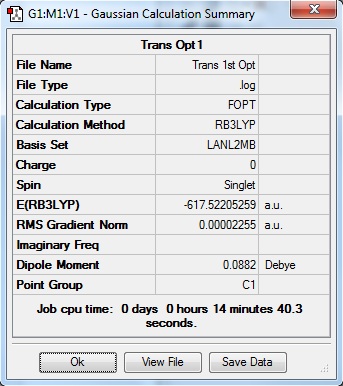
A preliminary optimisation was carried out using the basis set LANL2MB with the Gaussian B3LYP calculation method. With the "opt=loose" criteria, the calculation was carried out, resulting in the following information.
| Cis isomer | Trans isomer |
|---|---|
 |
 |
The files obtained for the optimisation of the isomers can be viewed by clicking on the following links: Cis Isomer, Trans Isomer.
From table 7, it is observed that the difference in energy between both isomers is 0.0019 a.u. or 5 KJmol-1. As this is a small difference in energy, the formation of either isomer in synthesis is highly probable. Additionally, both these isomers can easily interconvert to each other even at room energy as the barrier for the transformation of the isomer is low. Theoretically, this would happen for the particular complex but this interconversion could be prevented with the addition of bulky ligands onto the metal centre, increasing the difference in energy between both isomers and therefore reducing the probability of interconversion between both isomers even at room temperature.
Upon checking the .log files, the optimisation has been completed due to the convergence of the forces, and the RMS gradients of the optimisation steps has reached a value of close to 0.00 a. u..
The next step in further optimisation can be carried out.
Optimisation using the basis set LANL2DZ
Before this optimisation was carried out, the bond dihedral angles were altered to start the optimisation in the particular conformations of the isomers. The particular conformations are shown in the diagram below. By altering the dihedral angles, it will enable the calculations to find the isomer with the lowest energy, and not the 'pseudo lowest' energy of the 'optimised' isomer.
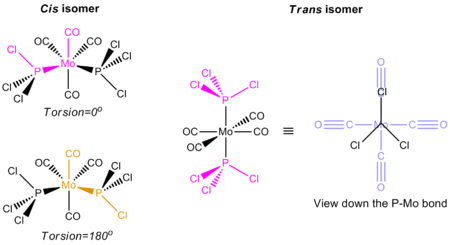
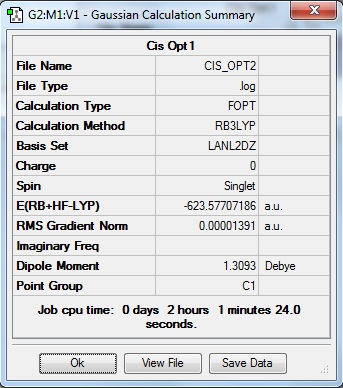
The isomers have been optimised and the summaries of the optimisation jobs are as shown below:
| Cis Isomer | Trans Isomer |
|---|---|
 |
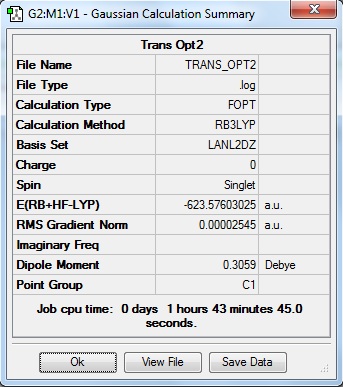 |
The output files for the 2nd optimisation of the complex can be found by clicking on the following links: Cis isomer, Trans isomer. It has been noticed that with the convergence of the values, the cis isomer was found to be more stable than the trans isomer. This means that the cis isomer is the more thermodynamically stable product of the two stereoisomers by approximately 3 KJmol-1. This result is not in line with the predicted results where the bulky ligands in the trans isomer (e.g. PPh3) are situated opposite to each other and as far apart as possible, the steric clash between the ligands is reduced and dipole moments are also cancelled out. Since the cis isomer experiences a larger steric clash, a relative destabilisation occurs. The dipole moments are also not cancelled out. This could be due to the calculation methods used in the job run that have led to the disparity in calculation values.
Following that, the geometry of the trans isomer was determined using GaussView and compared to literature values obtained from the X-Ray crystallography experiments done by Hogarth et. al.[4].
| Bond length/Å or bond angle/o | Computed Values | Literature Values | ||
|---|---|---|---|---|
| P-Cl/Å | ||||
| P-Mo/Å | ||||
| Equatorial C≡O/Å | ||||
| Equatorial C-Mo/Å | ||||
| P-Mo-P/o | ||||
| P-Mo-C/o | ||||
| Cis C-Mo-C/o | ||||
| Trans C-Mo-C/o | ||||
Likewise, the values for the cis isomer are compared with that of literature values[5] in table 10.
| Bond length/Å or bond angle/o | Computed Values | Literature Values | ||
|---|---|---|---|---|
| P-Cl/Å | ||||
| P-Mo/Å | ||||
| Axial C≡O Below/Å | ||||
| Axial C≡O Above/Å | ||||
| Axial C-Mo/Å | ||||
| Equatorial C-Mo/Å | ||||
| P-Mo-P/o | ||||
| P-Mo-C (I)/o | ||||
| P-Mo-C (II)/o | ||||
| Cis C-Mo-C (I)/o | ||||
| Cis C-Mo-C (I)/o | ||||
Table 9 and 10 shows that most of the computed values are within a reasonable range of the literature values obtained from the journal. This shows that the optimised structure corresponds well with the real-life structure. While the bond lengths for P-Cl varies wildly (but understandably) with the value of the P-C bond in literature, the closeness of the other values suggest that the substitution of the Cl ligand in the complex did not cause a large electronic change in the computed molecule.
Vibrational Analysis of the Complex
Cis Frequency Log Files, Trans Frequency Log Files
Low Frequencies
As frequency is proportional to the energy, these vibrations require very little energy to occur. This implies that the vibrations shown in table 11 can occur at room temperature as the barrier to such vibrations can be easily overcome by energy at room temperature.
Carbonyl Frequencies
| Cis | Trans | ||||||||||
|---|---|---|---|---|---|---|---|---|---|---|---|
| No. | Animation | Frequency/cm-1 | Intensity | Point Group | Lit | No. | Animation | Frequency/cm-1 | Intensity | Point Group | Lit |
 |
 |
||||||||||
 |
 |
||||||||||
 |
 |
||||||||||
 |
 |
||||||||||
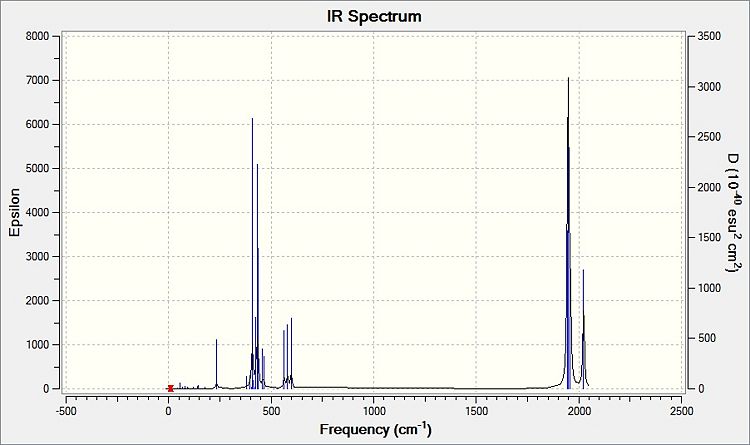
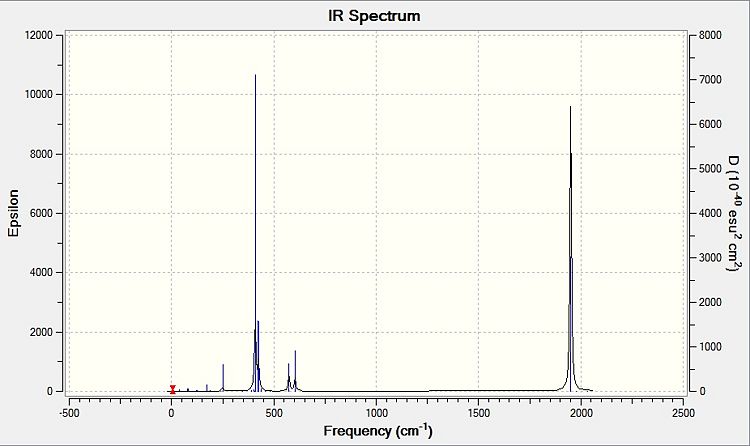
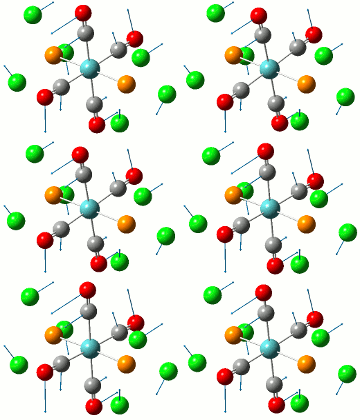
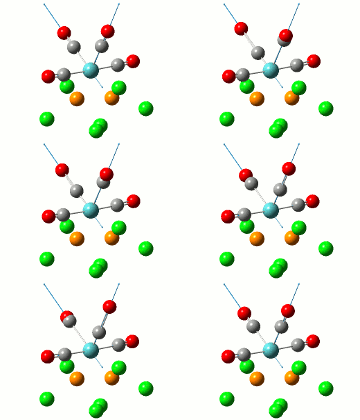
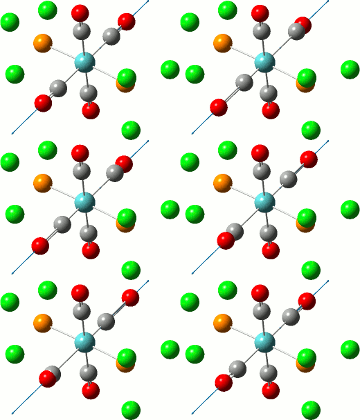
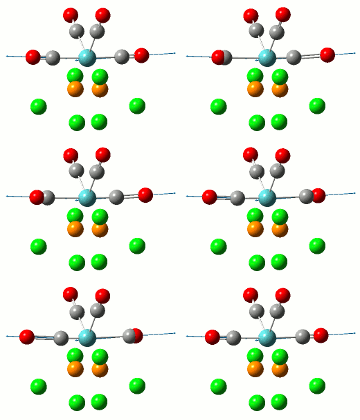
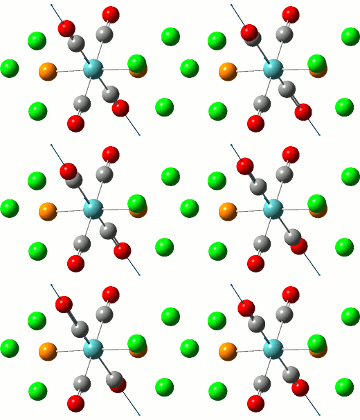
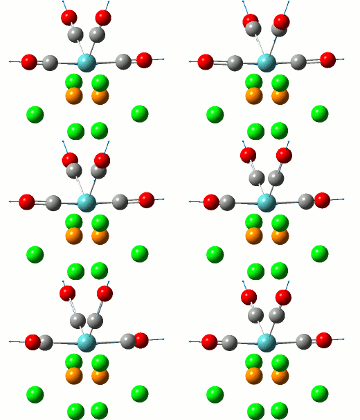
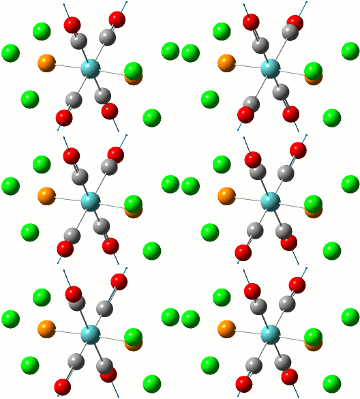
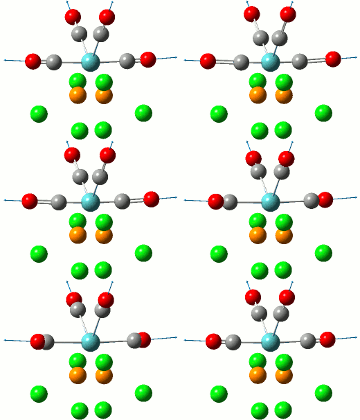
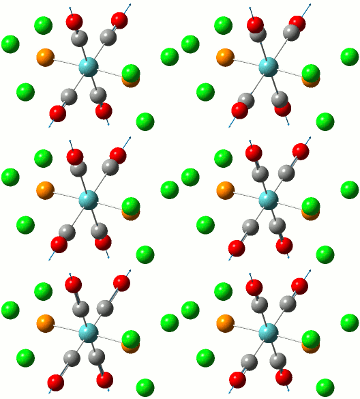
Comparing the computed and literature values, it can be concluded that they are within a reasonable range of each other. Some of the disparities between both values could be attributed to the fact that Gaussian is not programmed to regard the effects of back-bonding as realistically as possible, and hence the expected increase in energy of C=O bond was not observed. As IR stretches can only be observed if there is a change in dipole between two atoms, the 4 C=O stretches are observed for the cis complex in the IR spectrum. This is not the case for the trans complex due to the differing symmetry, and therefore two of the symmetries in entries 3 and 4 for the trans complex do not have a change in dipole moment and will not be observed in the IR spectrum. As a result, only 2 stretches are observed in the IR spectrum of the trans complex.
Mini Project
Introduction
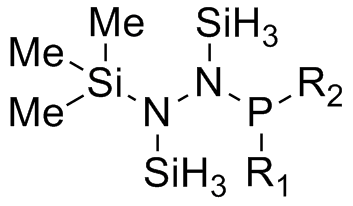
In the reaction studied from current work[6], the reaction of the main molecule A with lewis acids like AlCl3 and GaCl3 will be studied computationally. According to research, different substituents in R1 and R2 will result in different reactions; either an adduct formation or a chlorine/methyl exchange reaction. This is exemplified in the diagram below.
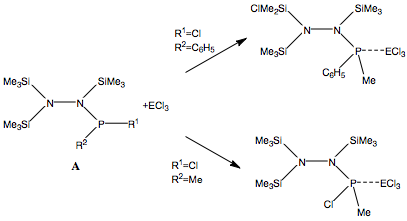
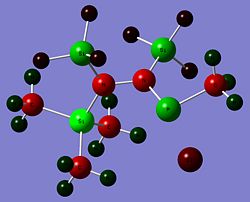
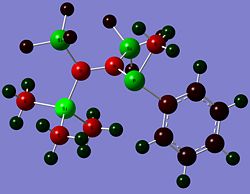
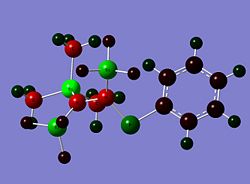
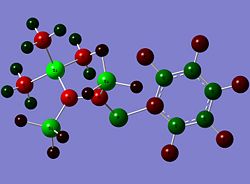
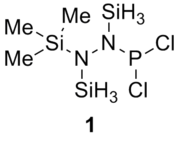
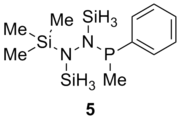
As an attempt to gain some insight into the peculiar behaviour of the silylated hydrazinohlorophosphanes, a computational experiment will be carried out on this molecule, with 5 pairings of 4 different substituents used. In particular, the -Cl substituent (R1) will be used to investigate the electronic effects that may be affected by the corresponding substituent (R2), which causes the unexpected chlorine/methyl exchange as shown in the diagram above. In order to speed up computational time, two of the SiMe3 groups (molecule A) that are not involved in the exchange reaction will be substituted with the SiH3 group (molecule B), shown in the diagram below.

Additionally, the bond strengths of the bonds that will be broken during the reaction will be examined, along with their geometries in order to deduce any effect on reactivity.
Molecule to be studied, and its substituents
As mentioned above, the aims of this exercise will be to primarily examine the change in electronic effects when different substituents are placed on the R1 and R2 positions through a NBO analysis. In addition, the bond lengths of relevant bonds to the reaction will be examined to see whether the conformation of the molecule has an impact on its peculiar reactivity. Finally, a vibration analysis will be done to test the validity of the results published in the paper[6].
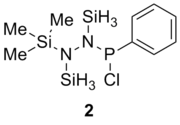
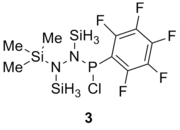
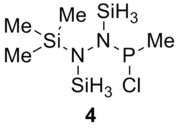
Table 13 shows the combination of substituents in the molecule hydrazinochlorophosphane, where these molecules will be optimised using the DFT-modelling method using the 6-31G basis sets.
| Substituent |
Substituent R2 | Original Molecule | ||
|---|---|---|---|---|
 |
 | |||
 |
||||
 |
||||
 |
||||
 |
As the optimisation of the starting material was inconclusive about the formation of the adduct and Me/Cl exchange product, the optimisation of the transition states were carried out to observe the relative stability of the compounds in their transition states, when a Cl atom has been abstracted by the lewis acid ECl3. This is shown in the diagram below:

The study proposed two different transitional pathways which the exchange reaction could have taken, but the transition state from the stepwise reaction was chosen to reduce computational time due to the lack of the metal centre from the lewis acid. These transition states were likewise modelled using the DFT (B3LYP) method, using the basis sets 6-31G with the consideration of the (d,p) orbitals. Only the transition states of compounds 2, 3 and 4 were considered in this optimisation, as transition states in compounds 2 and 3 contains the aryl substituent, while compound 4 was optimised to be used as a tool for comparison.
Optimisation
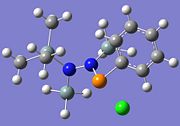
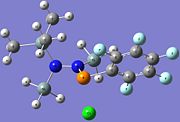
The first and only optimisation carried out for this molecule was done using the 6-31G basis set, using the calculation DFT modelling method B3LYP. The table below summarises the optimisations carried out for the 5 molecules, with a run time ranging from 40 minutes to more than an hour. In the table, it is also shown that the point groups of the molecules are all C1, but this is hardly the case, as Gaussian was not able to compute the point groups of the molecules as the constructed molecules on GaussView5 were hardly symmetrical. Additionally, the point groups were not expressly restricted in the calculations.
| Compound | 1 | 2 | 3 | 4 | 5 | |
|---|---|---|---|---|---|---|
| DOI | DOI:10042/to-7739 | DOI:10042/to-7740 | DOI:10042/to-7737 | DOI:10042/to-7741 | DOI:10042/to-7738 | |
| File Type | ||||||
| Calculation Type | ||||||
| Calculation Method | ||||||
| Basis Set | ||||||
| Charge | ||||||
| Spin | ||||||
| E(RB3LYP)/a.u. | ||||||
| RMS Gradient Norm/a.u. | ||||||
| Dipole Moment/Debye | ||||||
| Point Group | ||||||
| Job CPU Time | ||||||
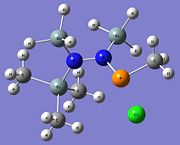
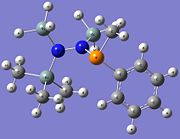
| Diagram | 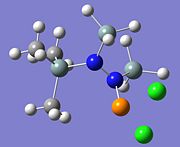 |
 |
 |
 |
 | |
| Jmol |
A cursory look at the figures on table 14 indicates that compound 1 is the most stable out of all the compounds, followed by compound 3. These two compounds possess the most electronegative substituents on the phosphorous atom, which most probably led to its stabilisation as electron clouds become more spread out across the compound.
Further examination of the Jmol files indicate that the geometry about the nitrogen atoms in the compounds 1 to 5 tend towards the trigonal planar geometry, which has been attributed[6] to the donation of the nitrogen lone pair into the σ* Si-C orbital, also known as hyperconjugative effects. In addition, it is also observed that the substituents on each nitrogen atom are usually perpendicular to each other, which stabilises the molecule and allows it to be isolable. This observation can be done through observing the dihedral angle between the Si-N-N-P bonds:
| Compound No. | Dihedral Angle/o |
|---|---|
The optimised bond lengths of the Si-C bond is highlighted in a red circle, and also the lengths of bonds between P-R1 and P-R2 are shown in table 16.
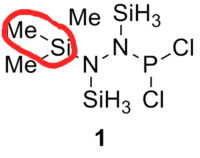
| Compound | 1 (R1=R2=Cl) | 2 (R1=Cl, R2=C6H5) | 3 (R1=Cl, R2=C6F5) | 4 (R1=Cl, R2=CH3) | 5 (R1=C6H5, R2=CH3) | Literature Value for the free bond | Literature value from the compound[6] | |
|---|---|---|---|---|---|---|---|---|
At first glance, most of the bonds seem to be in agreement with the literature value for the free bond with the exception of the P-Cl bond. The N-N bond lengths for the compounds 1 to 5 suggests that the single N-N bond is perfectly covalent, due in great part to the high polarisation between the P-N atoms. This will be further discussed in the NBO analysis. In contrast, the elongated P-Cl lengths obtained from the DFT modelling calculations are far beyond that of literature and this could be due to hyperconjugation, which results in the weakening of the adjacent P-Cl bond.
Table 16 seems to indicate that there is little difference in bond length of the Si-C group, which ties in with the conclusion that the Me/Cl exchange does not have a significant difference, and hence it is not substantial enough to explain why the Me/Cl exchange could occur instead of the adduct formation. As the Me/Cl exchange occurs only when R2 is substituted with an aryl group, it was theorised[6] that the aryl substituent is able to stabilise the transition state through which the exchange occurs, therefore leading to the occurence of the exchange reaction. While the bond distances indicate a general anomaly from several bond lengths from literature, it does not give a full picture of the bonding interactions. Therefore, an NBO analysis is carried out to examine the orbital contribution from the atom for the bonds that are of greater interest. Through this analysis, it is hoped that the reasoning for the bond lengths differing from literature can be well-substantiated.
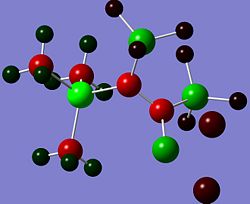
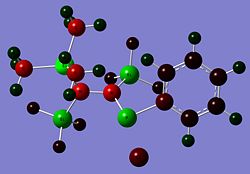
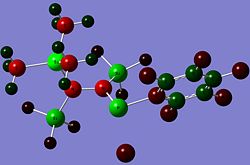
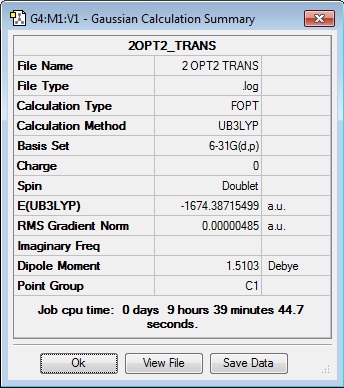
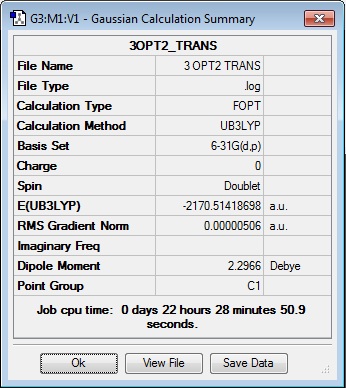
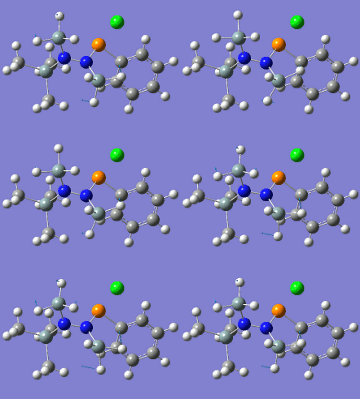
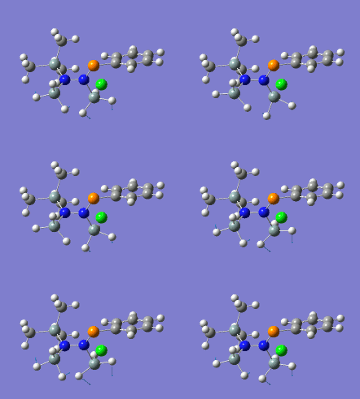
Since the previous optimisations do not appropriately substantiate why the presence of the aryl substituent causes the Me/Cl exchange, an optimisation of the transition states have been carried out to show that the presence of the aryl ring (both C6H5 and C6F5) does stabilise the system. Along with the standard use of the Gaussian method with DFT modelling, the basis set 6-31G has been used along with the consideration of the (d, p) orbitals as there is a cationic charge on the phosphorous atom, as theorised by Schulz and co-workers. The table below shows the summary of the optimisations for the transition state of compounds 2, 3 and 4.
| Compound 2 | Compound 3 | Compound 4 |
|---|---|---|
 |
 |
 |
The optimised energies above confirms that the transition state containing the aryl ring is significantly more stabilised than the transition state containing the methyl substituent (cf -1674.39 a.u. compared to -1482.65 a.u.). This substantiates the theoretical conclusion seen in the work done by Schulz and co-workers[6], and is a more conclusive indicator of the reason for the Me/Cl exchange as compared to the optimisation of the starting material.
A summary of the P-C distances are shown in the table below:
| Compound | P-C bond length/Å |
|---|---|
Table 18 demonstrates that compound 2 probably has the highest stabilisation conferred from the resonance of the aryl substituent. However, this contradicts the overall stability of the transition state, where the transition state of the compound 3 has the highest stability, followed by the transition state of compound 2. This demonstrates that the assumption that the relationship between the bond length and the amount of resonance between the substituent and P may not always necessarily be linear. Additionally, the comparison of the traditional length of P-C (1.93Å) to the ones obtained from the optimisation shows that there is considerable shortening of the P-C bond due to conjugation or resonance stabilisation, substantiating the fact that there is even stabilisation between the substituent and the P atom in the transition state.
NBO Analysis
Analysing the molecule orbitals of this structure could give some clue about the bonding between the atoms N, P and C/Cl through the relative energies of the empty p orbitals on Cl (which leads to the exchange reaction), and also the bonding characteristics of the orbitals on the compound in general. In this section, the study on non-bonding orbitals allows for the examination of the charge distribution on the compounds in question. In this case, a few orbitals will be considered in this analysis: the p orbital of the Cl substituent, P and N atoms.
In general, when there is a larger electron density around the atom, the number associated with the charge distribution will become more negative. This allows for the determination of the charge densities (electron clouds) on the entire molecule, but as aforementioned, only a few atoms will be in greater focus for this analysis.
Across the 5 compounds, it is observed that the C atoms of the aryl rings are expectedly more negative as it contains a delocalised π-cloud of electrons. However, for C6F5, the C atoms are more positive (green) due to the highly electronegative F substituent on the aryl ring. For the only C atom on C6F5 that does not have an F atom connected to it, it expectedly possesses a more negative figure (red, -0.466) due to the absence of the F atom. In addition, the charge distribution on the present Cl atoms on compounds 1 to 4 vary according to its neighbour substituent. For compound 1, the Cl atom has an equally electronegative Cl atom for R2 and hence the charge distribution on the R1 Cl atom has a value of -0.378. For compound 2, the presence of the aryl ring enhances the charge distribution on the Cl atom to -0.429, which most likely cause the abstraction of the Cl atom when the lewis acid is present. This also applies for compound 3, where the slightly less enhanced charge distribution for Cl at -0.393 is still higher than that of compound 1's. This slight enhancement is due to the electronegative F atoms on the aryl ring, taking away some electron density and hence resulting in a lower enhancement. For compound 4, the charge distribution is -0.443, much higher than that of both compounds 2 and 3. This will increase its reactivity to the lewis acid, but the electron-donating Me substituent does not have the ability to stabilise the transition state as compared to the aryl rings, and hence the Me/Cl exchange does not occur, and the major product is the adduct, which can be seen in the introduction. Finally, for compound 5, whilst the carbon on the Me group is relatively electron negative, a Me/Me exchange may have occured but this still results in a compound that does not seem to have undergone an exchange reaction. This could be further investigated through placing different carbon-based substituents to investigate whether any exchange reaction have been undergone.
Finally, a general observation that the relationship between the charge distribution and bond length implies that a larger charge distribution leads directly to a longer bond length. This is generally true for all the bonds on this molecule.
The comparison of tables 19 and 20 shows that the charge distribution on P has decreased by relative comparison of its colour. Comparison of the transition states of molecules 2, 3 and 4 gives rise to the conclusion that the binding of P to an aryl ring causes a resonance stabilisation, leading to a lowered electropositivity of the P atom, and hence stabilising it. For the binding of P to a methyl group, a hyperconjugation probably occurs in efforts to stabilise the P atom. However,the C atom for compound 4 has a high charge distribution at -0.539 compared to the other 2 aryl carbon atoms, and this will decrease the ability of the C atom to resonate with the positive charge on the P atom for stabilisation. This will therefore cause the transition state to be less stable and hence, this transition state will be less favourably formed to cause the exchange reaction to occur in compound 4. Therefore, the work done by Schulz and co-workers has been computationally substantiated.
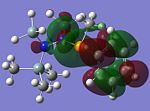
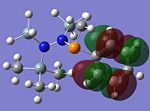
MO Analysis of key compounds 2, 4 and 5
| Compound | HOMO-1 | HOMO | LUMO | LUMO+1 | LUMO+2 |
|---|---|---|---|---|---|
 |
 |
 |
 |
||
 |
 |
 |
 |
 | |
 |
 |
 |
 |
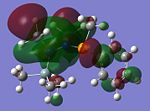 |
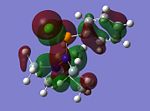
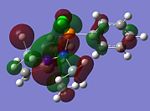
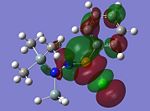
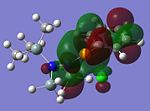
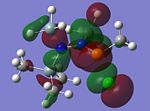
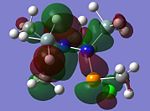
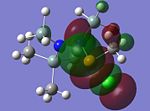
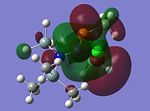
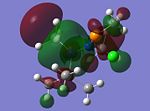
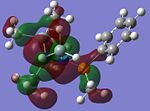
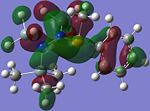
From table 21, it is observed that the N-P bond is highly polarised, where the electron orbital is not symmetrical but instead pushed towards the phosphorous atom. Also, the lone pair of nitrogen is significantly donated into the σ* Si-C orbital, as mentioned in the optimisation section, leading to the trigonal planarity of the bonds around the N atom. These can be seen in the HOMO of the compounds above.
In all the 3 HOMOs shown above, the orbitals around the phosphorous atom has a large bonding orbital, which makes it more susceptible to incoming electrophiles like lewis acids, resulting in the observed adduct addition onto the phosphorous atom. However, the Cl atom also has an orbital that is susceptible to electrophilic attack from a lewis acid, and because the orbital of the Cl atom in compounds 2 and 4 are more sterically unhindered, the incoming electrophile will preferentially attack the Cl atom, forming the anion ECl4-. The following reaction will then depend on the stability of the transition state, leading to either an observed Me/Cl exchange or the formation of an adduct.
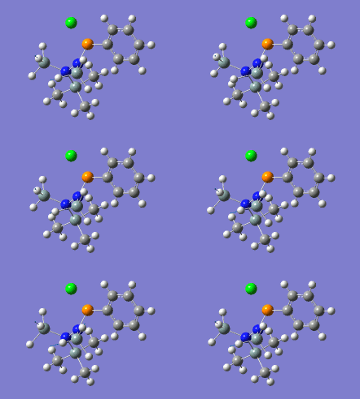
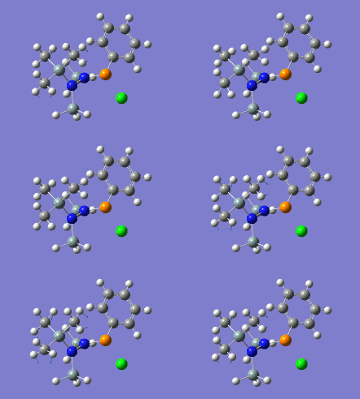
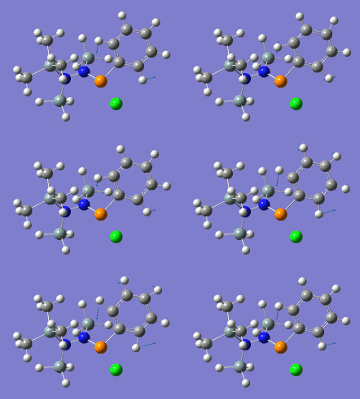
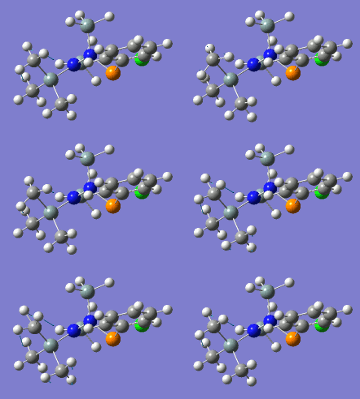
Vibrational Analysis
Molecule 2
| Entry | Mode No. | Example | Vibrational Mode | Frequency/cm-1 | Literature[6]/cm-1 |
|---|---|---|---|---|---|
 |
|||||
 |
|||||
 |
|||||
 |
|||||
 |
|||||
 |
|||||
 |
863 | ||||
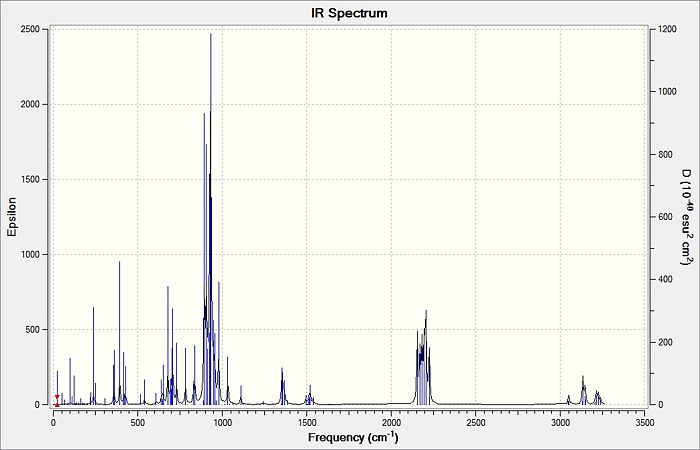 | |||||
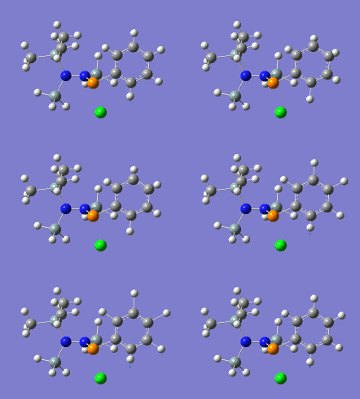
From the table above, it is observed that the calculated vibrational frequencies using Gaussian give slightly higher values compared to the values obtained experimentally. This could be largely due to the fact that the real experimental values have been modelled on an anharmonic oscillator as compared to the modelling on a harmonic oscillator using the DFT modelling. In addition, the substitution of the CH3 groups on -Si(CH3)3 for -SiH3 will inadvertently cause the vibrational frequency values to be slightly different from the experimental values. Fortunately in general, the DFT modelling method using the 6-31g has been deemed as suitable for this molecule due to the convergence of the job and also the reasonably close comparison of the literature values.
Other Molecules
Due to a lack of time, the analysis of the other vibrational information has not been carried out. The other files for the vibrational frequencies have been calculated, and are published below:
| Compound No. | DOI |
|---|---|
Conclusion
The use of Gaussian DFT modelling calculations allowed for the theoretical analysis of the stability of the transition states of the hydrazinochlorophosphanes introduced in this section. Through the computational exercise, the proposed mechanism for the Me/Cl exchange reaction and the adduct reaction could be further understood through the analysing the molecular orbitals of the molecules, the energies of the transition states, and through NBO analysis. Finally, the use of vibrational analysis allows for the validation of the spectral data offered in the published journal.
References
- ↑ K. Kawaguchi, J. Chem. Phys., 1992, 96, 3411 DOI:10.1063/1.461942
- ↑ X. Cao, M. Dolg, Comp. Mol. Sci., 2011, 0, 1-11 DOI:10.1002/wcms.28
- ↑ J. Blixt, J. Glaser, J. Mink, I. Persson, P. Persson, M. Sandstroem, J. Am. Chem. Soc., 1995, 117, 5089-5104 DOI:10.1021/ja00123a011
- ↑ G. Hogarth, T. Norman, Inorg. Chim. Acta., 1977, 254, 167-171 DOI:10.1016/S0020-1693(96)05133-X
- ↑ 5.0 5.1 F. A. Cotton, D. J. Darensbourg, S. Klein, B. W. S. Kolthammer, Inorg. Chem., 1982, 21, 294-299
- ↑ 6.0 6.1 6.2 6.3 6.4 6.5 6.6 6.7 A. Westenkirchner, A. Villinger, K. Karaghiosoff, R. Wustrack, D. Michalik, A. Schulz, Inorg. Chem., 2011, 50, 2691-2702 DOI:10.1021/ic200005q Cite error: Invalid
<ref>tag; name "haha654" defined multiple times with different content - ↑ T. S. Koloski, P. J. Carroll, D. H. Berry, J. Am. Chem. Soc., 1990, 112, 6405-6406 DOI:10.1021/ja00173a043
- ↑ X. Ren, Z. Liu, Struc. Chem., 2005, 16, 567-570 DOI:10.1007/s11224-005-6022-8
- ↑ E. Niecke, O. Altmeyer, M. Nieger, J. Chem. Soc., Chem. Commun., 1988, 945-946 DOI:10.1039/C39880000945
- ↑ G. Jochem, H. Noth, A. Schmidpeter, Angew. Chem. Int., 1993, 32, 1089-1091 DOI:10.1002/anie.199310891

