Sbtest1234
In this lab, structure of NH3, N2, H2 and P2 were optimised using the program Gaussian. We found the energy of the structure in the most stable form and also determined the symmetry of the molecule. The bond lengths were measured and, where appropriate, the bond angle. The reliability of the final energy value is supported with the small predicted change in energy, which can be viewed in the 'Item table' section of each respective molecule.
The vibrational modes of the molecule were found using the Results>>Vibrations tool. Where appropriate, these results were discussed in terms of degenerate vibrations and observable bands in an IR spectrum.
NH3 molecule
Summary information
Calculation method = RB3LYP
Basis set = 6-31G(d,p)
Final energy = -56.55776873 a.u.
RMS Gradient Norm = 0.00000485 a.u.
Point group = C3V
Bond length (N-H) = 1.01798 Å
Bond angle (H-N-H) = 105.741 degrees
Item table
         Item               Value     Threshold  Converged?
 Maximum Force            0.000004     0.000450     YES
 RMS     Force            0.000004     0.000300     YES
 Maximum Displacement     0.000072     0.001800     YES
 RMS     Displacement     0.000035     0.001200     YES
 Predicted change in Energy=-5.986306D-10
 Optimization completed.
    -- Stationary point found.
Jmol dynamic image
NH3 molecule |
Click here to view completed NH3 optimisation *.log file
Questions
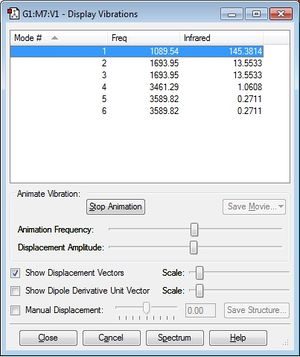
Using the 3N-6 rule, a total of four modes are expected. The frequency of these modes may be seen in figure 1. Modes 2,3 and modes 5,6 are degenerate as the frequency of vibration is identical thus energy is also identical. Modes 1-3 are bending vibrations and 4-6 are stretching vibrations. Mode 4 is highly symmetric as well as mode 1. The umbrella mode corresponds to mode 1. Two bands will be observed in the experimental spectrum of gaseous ammonia as the intensity of bands for modes 4-6 are so small, they cannot be detected unless the spectrum is magnified. The low intensity observed with modes 4-6 are due to the small change in dipole moment.
Charge values
Each N-atom has a charge of -1.125e and each H-atom a charge of 0.375e. This is as expected as:
a) Nitrogen is electronegative therefore will have a negative charge
b) The molecule is neutral therefore the sum of the positive charge on the H-atoms must equal the modulus of the negative charge on the N-atom
N2 molecule
Summary information
Calculation method = RB3LYP
Basis set = 6-31G(d,p)
Final energy = -109.52412867 a.u.
RMS Gradient Norm = 0.00008380 a.u.
Point group = D∞h
Bond length = 1.10550 Å
Item table
         Item               Value     Threshold  Converged?
 Maximum Force            0.000145     0.000450     YES
 RMS     Force            0.000145     0.000300     YES
 Maximum Displacement     0.000045     0.001800     YES
 RMS     Displacement     0.000064     0.001200     YES
 Predicted change in Energy=-6.585141D-09
 Optimization completed.
    -- Stationary point found.
Jmol dynamic image
N2 molecule |
Click here to view completed N2 optimisation *.log file
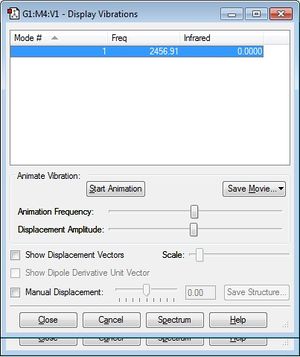
A single vibrational mode is expected for N2, which corresponds to a symmetric stretch. There is no absorption in the IR spectrum achieved as the symmetry of the bond results in no dipole moment.
Charge values
The charge on each nitrogen atom is zero; this is expected as the molecule is symmetric.
H2 molecule
Summary information
Calculation method = RB3LYP
Basis set = 6-31G(d,p)
Final energy = -1.17853935 a.u.
RMS Gradient Norm = 0.00003809 a.u.
Point group = D∞h
Bond length = 0.74279 Å
Item table
         Item               Value     Threshold  Converged?
 Maximum Force            0.000066     0.000450     YES
 RMS     Force            0.000066     0.000300     YES
 Maximum Displacement     0.000087     0.001800     YES
 RMS     Displacement     0.000123     0.001200     YES
 Predicted change in Energy=-5.726834D-09
 Optimization completed.
    -- Stationary point found.
Jmol dynamic image
H2 molecule |
Click here to view completed H2 optimisation *.log file
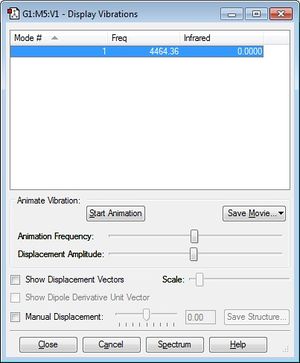
A single vibrational mode is expected for H2 which corresponds to symmetric stretch. Similar to N2, there is no absorption in the IR spectrum achieved as the symmetry of the bond results in no dipole moment.
Charge values
The charge on each hydrogen atom is zero; this is expected as the molecule is symmetric.
Haber-Bosch reaction energy calculation
The energy values calculated in previous sections in used below to find the change in enthalpy for the Haber process (equation given below).
E(NH<sub>3</sub>)= -56.55776873 a.u.

2*E(NH<sub>3</sub>)= -113.1155375 a.u.

E(N<sub>2</sub>)= -109.52412867 a.u.

E(H<sub>2</sub>)= -1.17853935 a.u.

3*E(H<sub>2</sub>)= -3.53561805 a.u.

ΔE=2*E(NH<sub>3</sub>)-[E(N<sub>2</sub>)+3*E(H<sub>2</sub>)]= -0.05579078 a.u. = -146.8178421 kJ/mol
The ammonia product is more stable than the gaseous reactants. The change in energy (ΔE) is negative, which indicates the reaction is exothermic, therefore the ammonia product is at a lower energy level thus implying greater stability of the final product.
[Extension] A literature value of -91.4kJmol-1 was determined experimentally by JM Modak. (Haber process for ammonia synthesis, September 2002, Vol.7 (9), p69-77) Bond formation is an exothermic process whereas bond breaking is an endothermic process. The less exothermic literature value suggests that the bond was stronger than the Gaussian program estimated. It is also possible that the bond formed is weaker than predicted. Additionally, the greater experimental enthalpy may be explained by the change of entropy; decrease in entropy will result in a less exothermic enthalpy change.
P2 molecule
The analysis detailed in the introduction has been applied to a diatomic molecule of phosphorus below. The character of molecular orbitals were discussed in terms of the energy and their contribution to the overall bonding.
Summary information
Calculation method = RB3LYP
Basis set = 6-31G(d,p)
Final energy = -682.68894540 a.u.
RMS Gradient Norm = 0.00004908 a.u.
Point group = D∞h
Bond length = 1.90455 Å
 Item               Value     Threshold  Converged?
 Maximum Force            0.000085     0.000450     YES
 RMS     Force            0.000085     0.000300     YES
 Maximum Displacement     0.000114     0.001800     YES
 RMS     Displacement     0.000161     0.001200     YES
 Predicted change in Energy=-9.694477D-09
 Optimization completed.
    -- Stationary point found.
Jmol dynamic image
P2 molecule |
Click here to view completed P2 optimisation *.log file
The charge on each phosphorus atom is zero; this is expected as the molecule is symmetric.
Molecular orbital analysis

The axis given to the left are defined for all following atomic or molecular orbitals. The z-axis has been defined to the right as this is the most bonded axis.
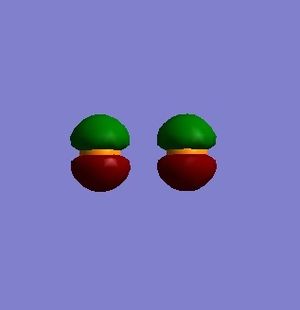
Figure 5 shows the non-bonding molecular orbital (MO) formed from two 2px atomic orbitals (AO's) of P2.
It is clear that this is not the anti-bonding orbital as the orbitals are in phase. The anti-bonding equivalent, where orbitals are out of phase, is at the same energy as the non-bonding MO given in figure 5; This proves there is no interaction between AO's and there is no bonding interaction, thus no bond. Electrons in these orbitals are held tightly towards the nuclei of their respective atom; their energies are low or 'deep' and cannot interact with each other.
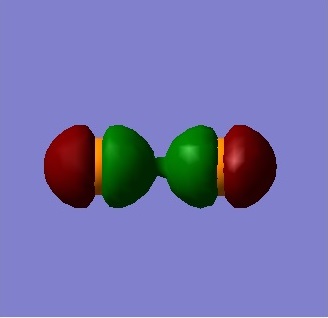
Figure 6 shows the non-bonding molecular orbital formed from two 2pz AO's. The anti-bonding equivalent MO is filled and thus, there is no overall bonding. Additionally, though some overlap can be observed, this is insufficient to form a 2-σ bonding molecular orbital.
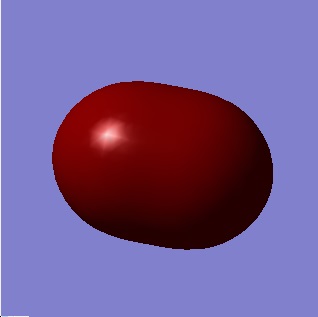
Figure 7 shows the first bonding orbitals of P2 from the combination of two 3s AO's. Complete overlap is observed which explains the formation of the 3-σ bond.
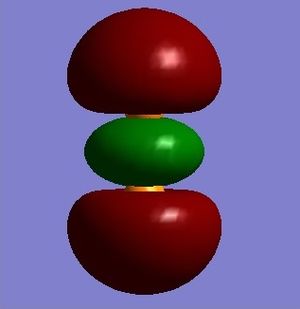
Figure 8 shows the molecular orbital formed by the linear combination of two 3px AO's; this results in a non-bonding orbital. The orbital given in figure 8 also has a filled anti-bonding equivalent. Although there is sufficient overlap to form a bond in figure 8, the presence of the filled anti-bonding orbital results in no overall bonding
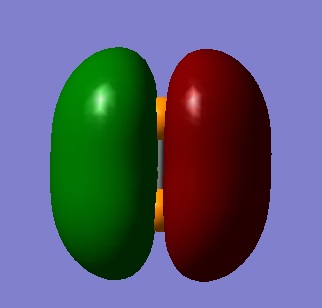
The molecular orbital found in figure 9 is formed from two 3pz AO's. The overlap is clear and distinct, leading to a π bonding orbital. This orbital is the highest occupied molecular orbital (HOMO).
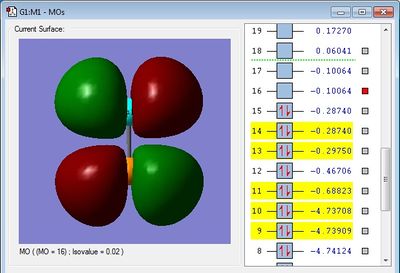
The corresponding anti-bonding orbital of the 3-π filled bonding orbital is given in figure 10. The left of the image shows this orbital is unfilled therefore a 3-π bond is formed. This orbital is the lowest unoccupied molecular orbital (LUMO).
