Sbs17 yr2 comp
BH3
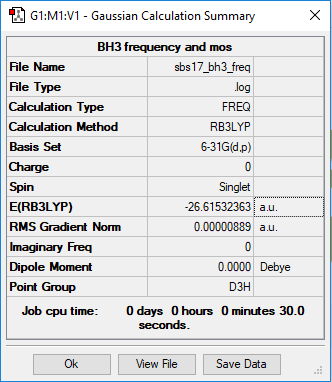
B3LYP/6-31 G level
         Item               Value     Threshold  Converged?
 Maximum Force            0.000018     0.000450     YES
 RMS     Force            0.000009     0.000300     YES
 Maximum Displacement     0.000070     0.001800     YES
 RMS     Displacement     0.000035     0.001200     YES
Frequency file: File:Sbs17 bh3 freq.log
 Low frequencies ---  -10.3498   -3.4492   -1.2454   -0.0055    0.4779    3.2165
 Low frequencies --- 1162.9519 1213.1527 1213.1554
BH |
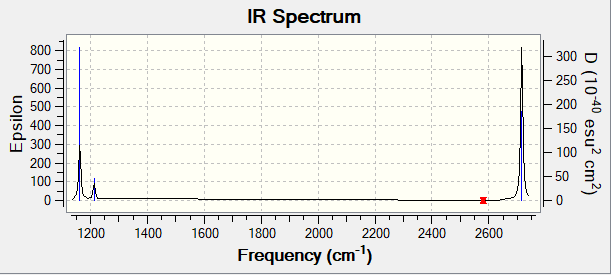
Vibrational spectrum for BH3
| Wavenumber(cm -1) | Intensity (AU) | Symmetry | IR active? | Type |
|---|---|---|---|---|
| 1163 | 93 | A2" | Yes | Out-of-plane bending |
| 1213 | 14 | E' | Yes | Symmetric in-plane bending |
| 1213 | 14 | E' | Yes | Asymmetric in-plane bending |
| 2582 | 0 | A1' | No | Symmetric stretch |
| 2716 | 126 | E' | Yes | Asymmetric stretch |
| 2716 | 126 | E' | Yes | Asymmetric stretch |
As can be seen from the IR spectrum, despite there being five IR active vibrational modes, only 3 peaks are present in the spectrum. This is due to the fact that two of the bending modes and two of the stretches are degenerate, and as such only 3 distinct peaks will be seen in the spectrum.
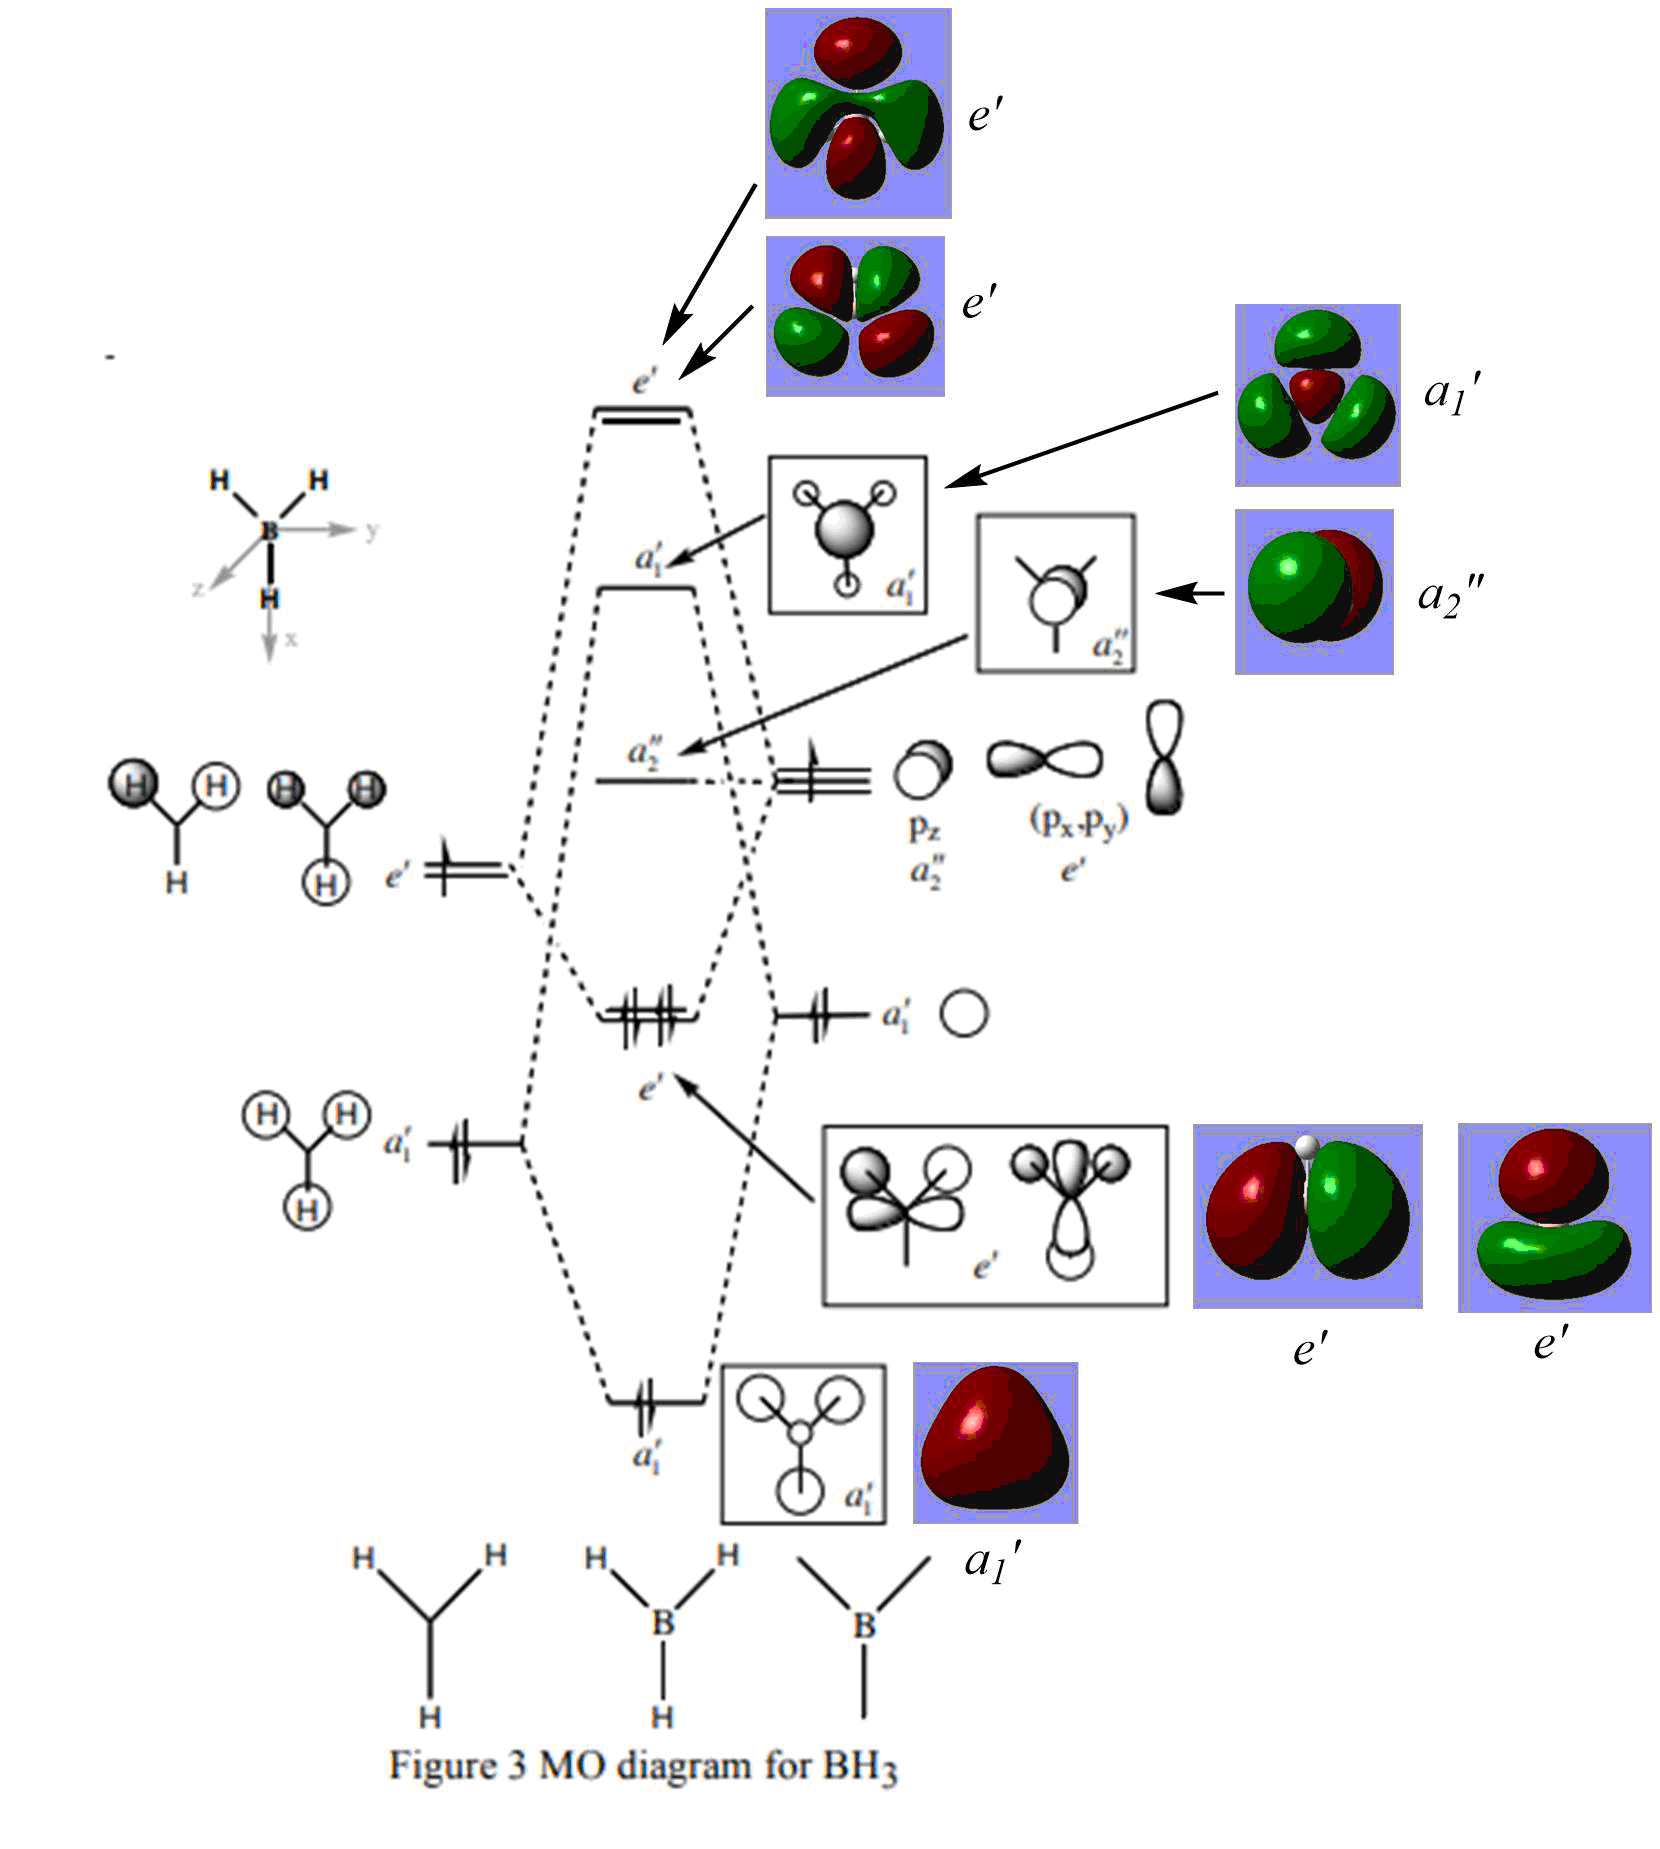
MO diagram
As can be seen from the Molecular Orbital diagram above, the real MO's and the LCAO MO's seem to be in accordance in terms of shape, but some seem to differ when it comes to the size of the lobes. For example, the a1' antibonding LCAO seems to suggest that outer lobes of the molecular orbital will be significantly smaller than the middle lobe. The real MO shows the opposite. Despite the disparity in terms of lobe size, the shape of the MO is in accordance with what is predicted with the LCAO. As such, it can be said that qualitative MO theory seems to provide a decent model for the shape of real molecular orbitals.
Very good discussion using the 3a1' orbital to highlight the differences and you've correctly included all of the MOs. To improve, in terms of presentation the MO diagram is very big making it hard to mark! The top two e' LCAOs could have also been included for comparison. Smf115 (talk) 19:15, 1 June 2019 (BST)
NH3
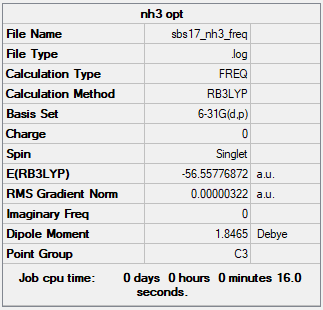
B3LYP/6-31 G level
         Item               Value     Threshold  Converged?
 Maximum Force            0.000006     0.000450     YES
 RMS     Force            0.000003     0.000300     YES
 Maximum Displacement     0.000013     0.001800     YES
 RMS     Displacement     0.000007     0.001200     YES
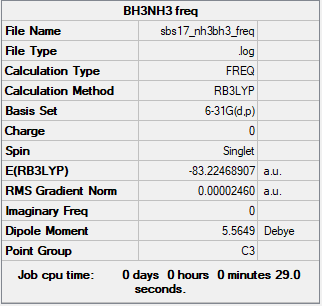
Optimisation file: File:Sbs17 nh3 freq.log
NH3BH3
B3LYP/6-31 G level
         Item               Value     Threshold  Converged?
 Maximum Force            0.000062     0.000450     YES
 RMS     Force            0.000025     0.000300     YES
 Maximum Displacement     0.000369     0.001800     YES
 RMS     Displacement     0.000184     0.001200     YES
 Predicted change in Energy=-3.864431D-08
 Optimization completed.
Optimisation File: File:Sbs17 nh3bh3 freq.log
Association Energy
The Association energy can provide information about the strength of the dative B-N bond, which can be characterised as quite weak, with an association energy of -129 kJmol-1. For comparision, a C-C bond has a dissociation energy of 304 kJ mol-1.
Correct calculation, however, the conversion of 1 a.u. = 2625.5.kJmol-1 should have been used and as a result, your final value is a little out (but left to the correct accuracy!). Good comparison, to improve you should always reference literature values and you could have justified why the C-C bond is a good comparison? Smf115 (talk) 19:50, 1 June 2019 (BST)
NI3
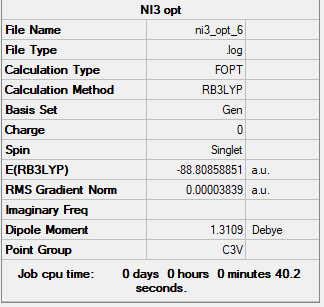
         Item               Value     Threshold  Converged?
 Maximum Force            0.000068     0.000450     YES
 RMS     Force            0.000044     0.000300     YES
 Maximum Displacement     0.000493     0.001800     YES
 RMS     Displacement     0.000333     0.001200     YES
 Predicted change in Energy=-5.826701D-08
 Optimization completed.
 Low frequencies ---  -12.7477  -12.7416   -6.4258   -0.0140    0.0210    0.0991
 Low frequencies ---  101.0290  101.0295  147.4197
Frequency File:File:Sbs17 ni3 freq.log
NI |
Optimised N-I distance: 2.18 Å
Ionic Liquids
Charge Distribution
[N(CH3)4]+
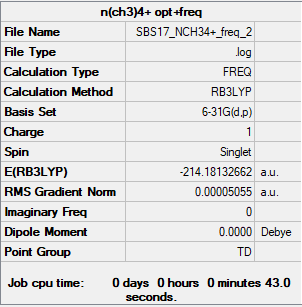
Item               Value     Threshold  Converged?
 Maximum Force            0.000073     0.000450     YES
 RMS     Force            0.000017     0.000300     YES
 Maximum Displacement     0.000823     0.001800     YES
 RMS     Displacement     0.000259     0.001200     YES
 Predicted change in Energy=-5.139273D-08
 Optimization completed.
 Low frequencies ---   -0.0003    0.0008    0.0009   35.3754   35.3754   35.3754
 Low frequencies ---  217.4063  316.4789  316.4789
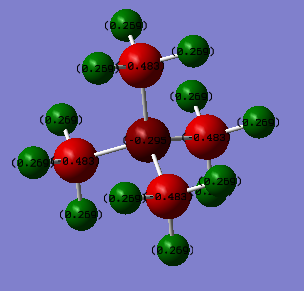
| N | C | H |
|---|---|---|
| -0.295 | -0.483 | 0.269 |
As can be seen from the above table, the charge on N(CH3)4]+ is distributed unevenly across the molecule, with -0.295 charge units being on N, -0.483 on each of the C atoms and 0.269 on each of the H atoms, respectively. The calculation below shows that this gives an overall formal charge of +1.
This differs from a traditional picture of the charge distribution on N(CH3)4]+ which typically shows the formal charge placed on the central N. The traditional picture suggests that the Nitrogen atom has lost an electron in order to form bonds with four alkyl groups to fulfil the octet rule. The real picture however is not in accordance with this model, as negative charge is placed on Nitrogen, thereby suggesting that the traditional model is not accurate in this case.
In addition, the smaller charge difference between C and N shows that they are similar in electronegativity. Furthermore, the C and N orbitals will be similar in size, thus contributing to efficient orbital overlap. These two effects result in a C-N bond which is relatively strong.
[P(CH3)4]+
         Item               Value     Threshold  Converged?
 Maximum Force            0.000138     0.000450     YES
 RMS     Force            0.000035     0.000300     YES
 Maximum Displacement     0.000718     0.001800     YES
 RMS     Displacement     0.000298     0.001200     YES
 Predicted change in Energy=-1.829353D-07
 Optimization completed.
 Low frequencies ---    0.0013    0.0021    0.0032   51.6355   51.6355   51.6355
 Low frequencies ---  188.7456  213.6000  213.6000
| P | C | H |
|---|---|---|
| 1.666 | -1.060 | 0.298 |
As can be seen from the above table, the charge on P(CH3)4]+ is distributed unevenly across the molecule, with 1.666 charge units being on P, -1.060 on each of the C atoms and 0.298 on each of the H atoms, respectively. The calculation below shows that this gives an overall formal charge of +1.
Unlike N(CH3)4]+, P(CH3)4]+ places the positive charge on the central Phosphorous atom, and is as such more in accordance with a traditional picture of placing the formal charge on the central group 15 atom (which have a valency of 5).
The charge distribution on [P(CH3)4]+ is larger than that of N(CH3)4]+, and shows the a larger difference in electronegativity between the central atom and the C atoms. This, and the fact that the size mismatch between the orbitals on P and those on C result in inefficient orbital overlap, results in a P-C bond which is much weaker than the C-N bond in N(CH3)4]+.
Correct calculation of NBO charges and good consideration of electronegativity differences and orbital overlap between the P/N and the C. However, the analysis could have been a lot more detailed, mentioned the H charges and considered other effects (e.g. symmetry).
In terms of explaining how the +1 formal charge arises, you should consider formal electron counting and Lewis structures. Smf115 (talk) 22:02, 3 June 2019 (BST)
LCAO MO analysis of some valence MO's of N(CH3)4]+
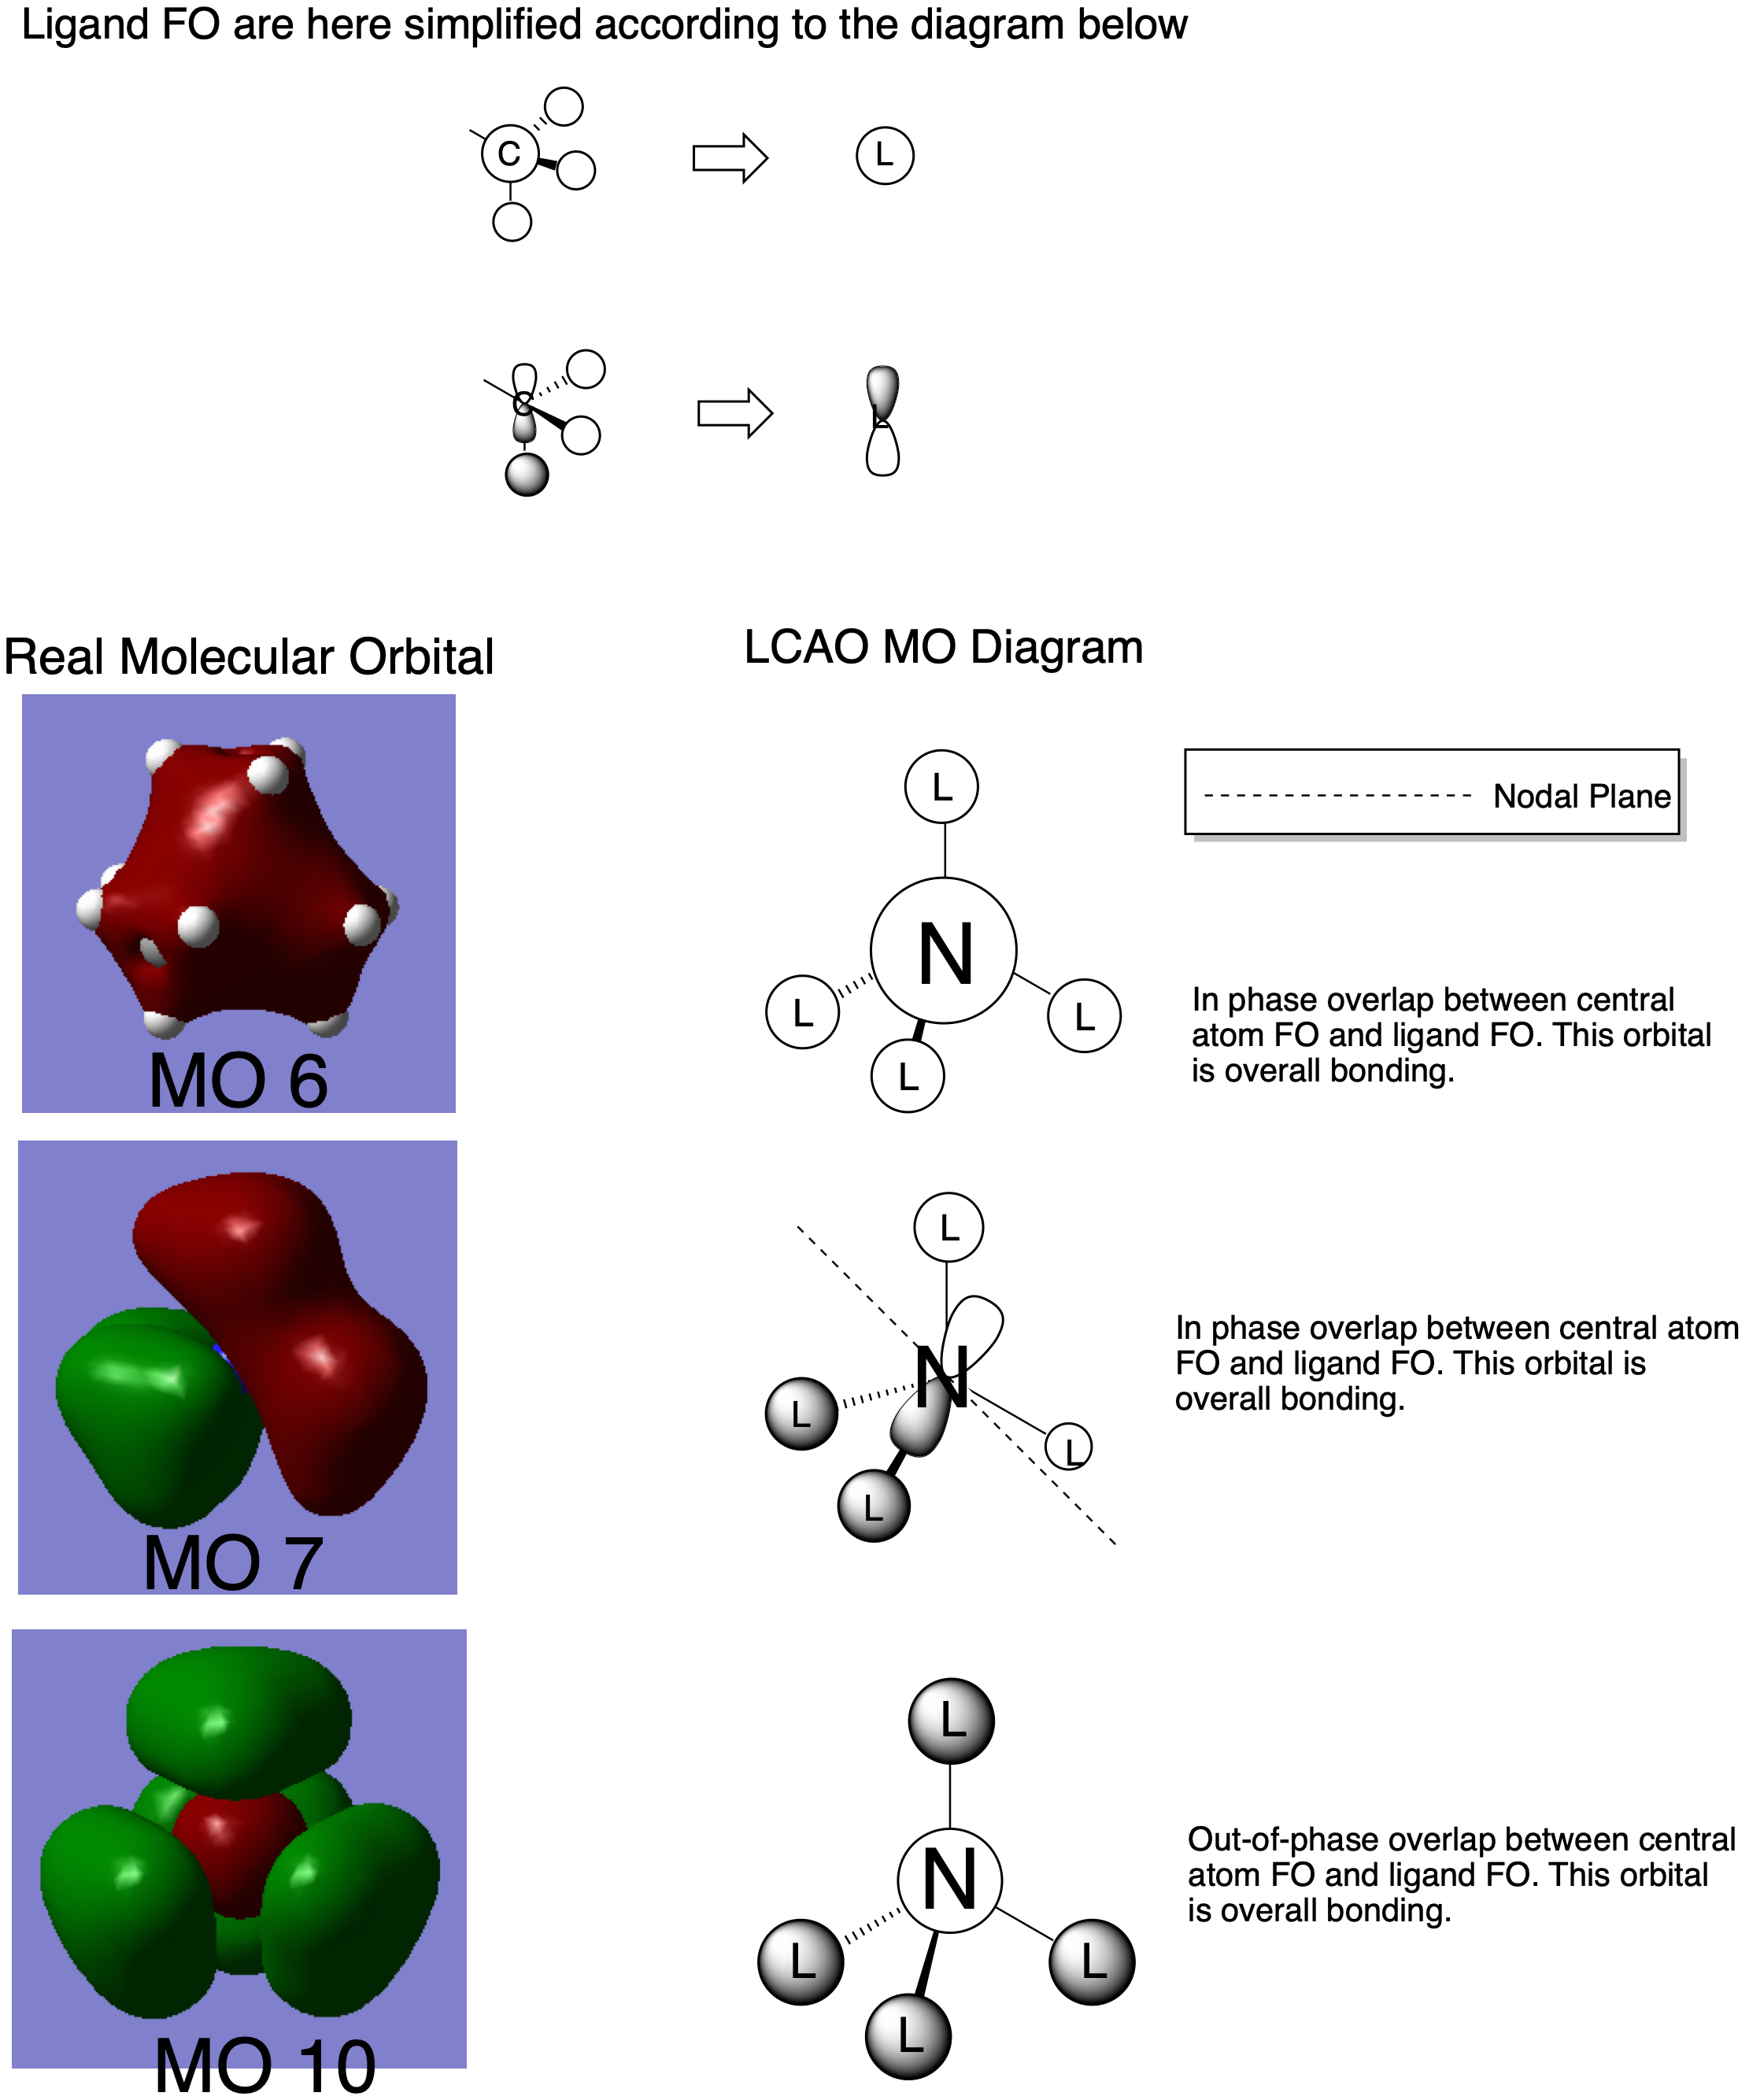 All molecular orbitals shown in this diagram are occupied.
MO 6
This purely bonding MO is the result of an in-phase overlap of the 2s AO of N and the methyl in-phase FO comprised of the 2s orbital of C and the 1s orbitals of H. No nodal planes are present. The in-phase s-orbital comprised FO and the 2s AO of N are both low in energy, and as s-s interactions are strong, this molecular orbital will be low in energy.
MO 7
This MO is comprised of the 2p AO of N and the s-orbital FO of the methyl ligand. Two of these FO's are in-phase and two are out of phase. One of the methyl FO's has a bonding interaction with the out-of-phase lobe of the 2p AO. The out-of-phase FO's experience a weak in-space bonding, as well do the in-phase FO's. This results in a nodal plane. The MO is overall bonding.
MO 10
This MO is the result of an out-phase overlap between the 2s AO of N and the s-orbital comprise methyl FO. This is an antibonding interaction, but the weak in-space bonding between the methyl FO's override this, resulting in an overall bonding molecular orbital. This orbital is higher in energy than say, MO 7, due to the fact that s-s interactions are stonger than s-p interactions.
An ok attempt at the MO analysis, all your FOs and LCAOs are correct but you have selected a very simple range of MOs and it would have been nice to see some more complex ones. Overall, they are clearly and consistently drawn, however, the size of the diagram makes it very hard to mark and they would be improved by annotating the interactions and nodal planes etc. on to the diagrams. Smf115 (talk) 22:09, 3 June 2019 (BST)
Overall, a good report which had a good first section. Smf115 (talk) 22:11, 3 June 2019 (BST)
References
1. Hunt T. Molecular Orbitals in Inorganic Chemistry – Lecture 4 Tutorial sheet [published answers: http://www.huntresearchgroup.org.uk/teaching/teaching_comp_lab_year2a/Tut_MO_diagram_BH3.pdf]. Imperial College London.

