Sarah Patterson 01080651 CP3MD
EXERCISE 1: H + H2 system
Question 1:- What value does the total gradient of the potential energy surface have at a minimum and at a transition structure? Briefly explain how minima and transition structures can be distinguished using the curvature of the potential energy surface.
The minima and the transition structure both represent stationary points on the potential energy surface hence the first partial derivative with respect to each geometric parameter is equal to zero. The first partial derivative will be equal to the gradient and thus the gradient will also be zero.
The mininmas correspond to physically stable chemical species (the reactants and product). These minima can be located as regions lower in energy compared to their surroundings ie. each minima occupies the lowest-energy point in its region of the potential energy surface.
The transition point corresponds to a saddle point and it must lie on a pathway that connects both the products and the reactants. Unlike a minimum, which is a minimum in all directions, a saddle point is a maximum along the reaction coordinate and a minimum in all other directions. It can be identified as the point in the centre of the saddle shaped region. Another way of identifying the transition state from the potential energy surface is to exploit the fact that the TS is the highest energy point on the reaction coordinate. Starting a trajectory near the transition point will result in a downhill pathway towards the minima. This can be repeated until the highest energy point is identified.
A more mathematical treatment can be carried out by calculating the second partial derivative. For the minima, the second derivative will be greater than zero; the second derivative of the transition state will be less than zero along the reaction coordinate but more than zero for the other geometrical parameter.
Question 2:-Report your best estimate of the transition state position (rts) and explain your reasoning illustrating it with a “Internuclear Distances vs Time” screenshot for a relevant trajectory.
The screenshots below show two situations: the first image illustrates the situation where the trajectory is not located at the transition state whilst the second image shows the situation at the transition state. The first graph shows that as the reaction proceeds the A-B bond will break and B-C bond will form and this resulting bond will vibrate. The B-C bond vibration is observed as oscillations in the B-C internuclear distance.
The situation at the transition state is different. The transition state was located at:
r1=r2=0.908.
The position of the transition state was computed using a trial and error approach; using the cursor tool the maximum on the minimum energy path was located.
If the distance was not located at the transition state but near the transition state there would be a downhill trajectory towards the reactant or product minima even in the absence of momentum. The fact that the internuclear distance remains constant indicates we are at the highest point of the reaction. At the transition point the distances between AB and BC are equal which is consistent with the transition state possessing partial bonds to both the reactants and products.
Internuclear distance versus time graph for a successful trajectory 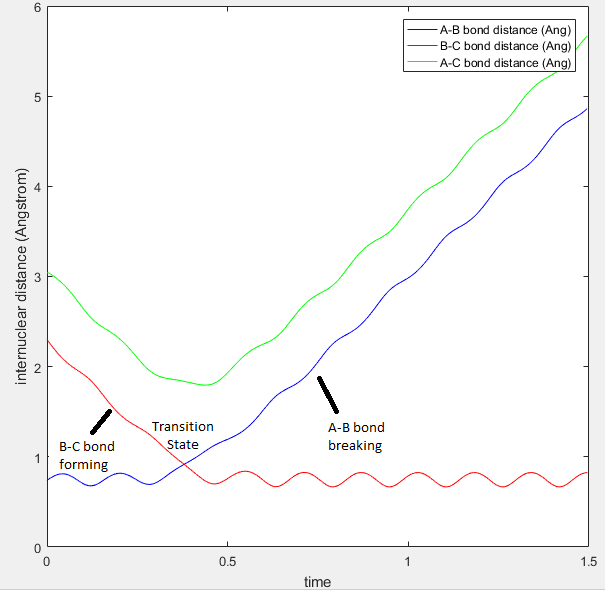 |
Internuclear distance versus time graph for a trajectory at the transition state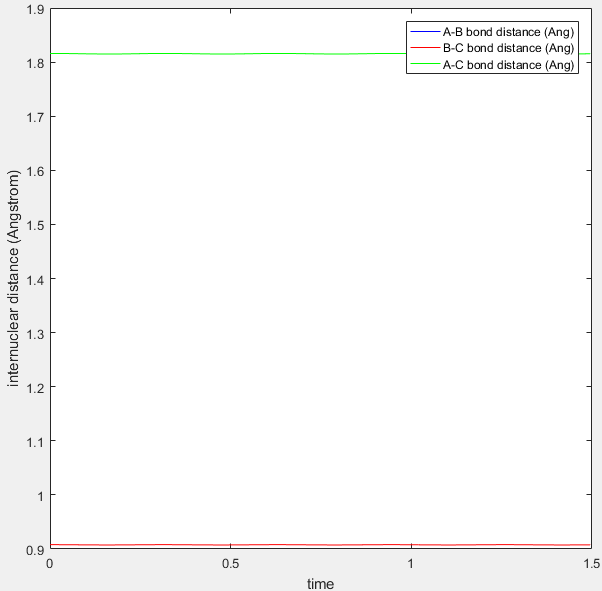 |
The trajectory at the transition state is stationary as the gradient is zero hence the trajectory cannot "roll" towards the reactants or products in the absence of momentum.
Surface Plot showing the transition state |
Surface Plot at another angle showing the transition state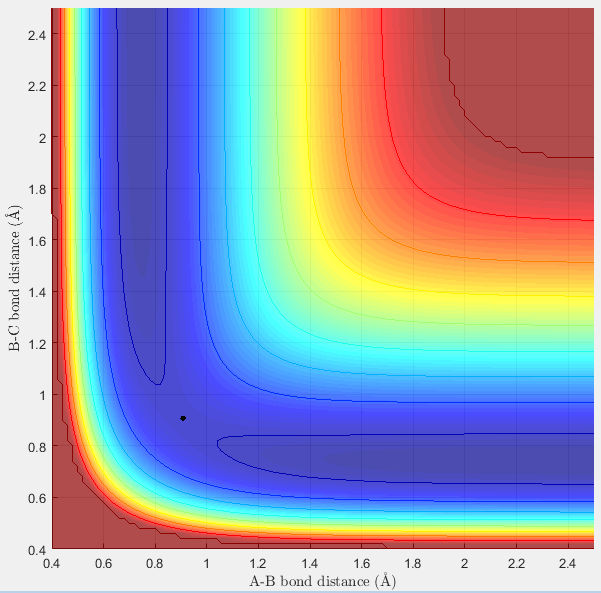 |
Question 3:-Comment on how the mep and the trajectory you just calculated differ.Comment on how the mep and the trajectory you just calculated differ.
The calculation carried out by MEP involves finding the lowest energy pathway along the surface plot, whilst dynamics identifies trajectories involving both vibrational and translational motion. The images below represent trajectories where the system is slightly displaced from the transition state with zero initial momenta (r1 = rts+δ and r2 = rts).
Examination of the plots shows that in the MEP calculation the trajectory remains in the ground vibrational state whilst in the dynamic calculation vibrational states can be excited along the trajectory.
MEP trajectory for the system r1 = rts+δ and r2 = rts |
Dynamic trajectory for the system r1 = rts+δ and r2 = rts |
MEP requires many steps (timescale of calculations) and this is a consequence of it calculating the trajectory in infinitely slow motion. At each step in the MEP calculation the velocity is reset to zero. If the atoms do not have velocity then their kinetic energy should be equal to zero. This is what is demonstrated in the graph below, the MEP kinetic energy remains zero at each time step whilst for dynamics the kinetic energy rises to a maximum where it then oscillates at this plateau. The latter situation represents the conversion from translational energy to vibrational energy.
MEP Kinetic Energy versus time graph  |
Dynamics Kinetic Energy versus time graph 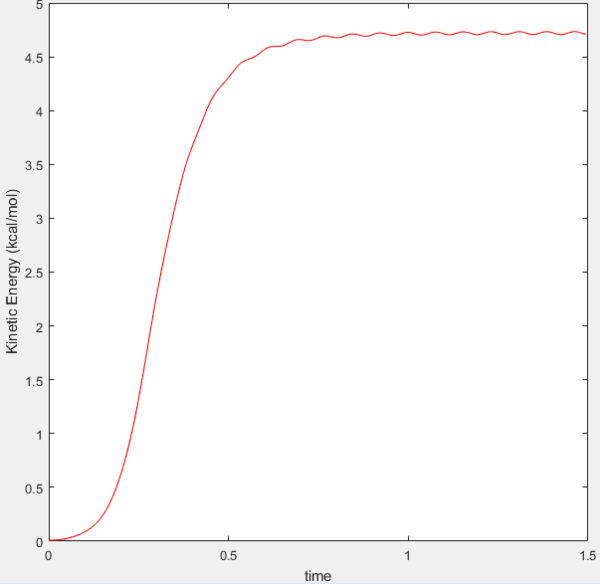 |
The internuclear distance versus time graph shows that there is no oscillations in the bond lengths hence the bonds do not vibrate. This is consistent with the statement made previously that the MEP calculation does not involve vibrational motion.
MEP internuclear distance versus time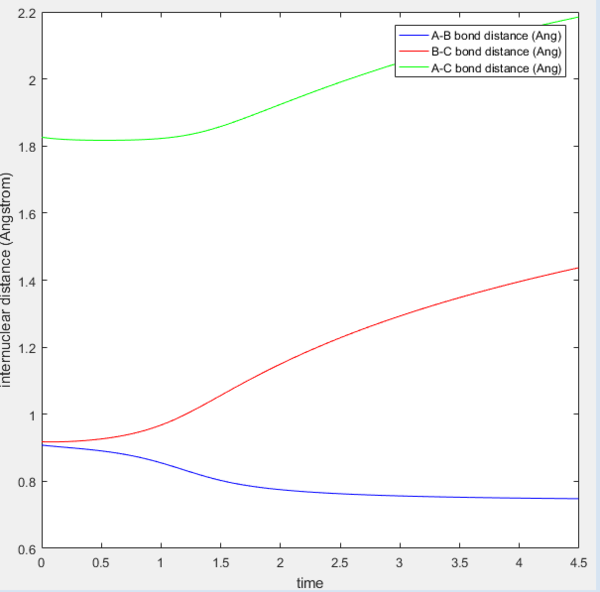 |
MEP internuclear momentum versus time |
Question 4: - Complete the table by adding a column reporting if the trajectory is reactive or unreactive. For each set of initial conditions, provide a screenshot of the trajectory and a small description for what happens along the trajectory.
For the initial positions r1 = 0.74 and r2 = 2.0 the effect of different momenta combinations on the trajectory was examined.
| Trajectory | p1 | p2 | Success of trajectory |
|---|---|---|---|
| 1 | -1.25 | -2.5 | Reactive |
| 2 | -1.5 | -2.0 | Unreactive |
| 3 | -1.5 | -2.5 | Reactive |
| 4 | -2.5 | -5.0 | Unreactive |
| 5 | -2.5 | -5.2 | Reactive |
In the plots below r1=A-B whilst r2= B-C, as the trajectory proceeds the B-C bond is breaking whilst the A-B bond is forming.
Trajectory 1 |
Trajectory 2 |
Trajectory 3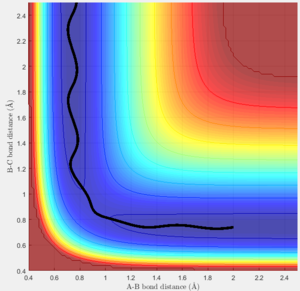 |
Trajectory 4 |
Trajectory 5 |
Trajectory 1- The surface plot above shows the trajectory from the reactant channel reaching the product channel with minimal vibrational motion. The trajectory ends in the product channel after having passed through the transition state indicating the reaction was successful. The colliding atom possess lots of translation energy whilst the reactant bond possess a minimum amount of vibrational energy.
Trajectory 2-In this trajectory the colliding atom posses less translational energy than the trajectory shown above. However, the vibrational energy of the B-C bond is greater than trajectory 1 above. The trajectory observed is that as atom A approaches the B-C bond it causes the bond to vibrate. This is observed as oscillations in the reactant channel. The vibration of the B-C bond is insufficient to reach the transition state and form products and the trajectory returns to the reactant channel.
Trajectory 3-The vibrational energy of the reactant bond remains the same but the effect of increasing the translational energy of the colliding atom is observed. The increase in translational energy enables the reactants to surmount the transition barrier and form products. This again occurs with minimal vibration.
Trajectory 4- In this trajectory both the translational and vibrational energy of the atoms is increased. Examination of the internuclear distance versus time plot shows that the trajectory crosses the transition state and transiently forms the product bond but reverts back to the product (barrier recrossing). This effect is equally observed in the trajectory outlined in the surface contour plot shown above. The transition state is crossed but continues to move into reactant channel where the reactant bond then vibrates.
Trajectory 5-The translational energy of the colliding atom is increased even more than in the previous trajectory outlined. The trajectory passes through the transition state and transiently returns to the reactant channel before ending in the product channel.
The trajectories shown above illustrate that in order to overcome the activation barrier reactants must have their energies correctly distributed between the translational and vibrational modes.
Question 4:- State what are the main assumptions of Transition State Theory. Given the results you have obtained, how will Transition State Theory predictions for reaction rate values compare with experimental values?
The main assumptions of Transition State Theory are[1]:
- Atomic motion can be modeled using classical mechanics and ignoring the effects of quantum physics. The classical motion can be represented on the potential energy hypersurface.
- There is a dynamic bottle neck region, called the transition state region, to a reaction. If there are several transition states then there is no interaction between them.
- If a trajectory moving in the direction of the products possess sufficient kinetic energy to cross the transition state region then the trajectory will not recross back to the reactant's side.
- At the transition state there is no dynamic coupling between the different degrees of freedom and the geometric coordinate motion.
The reaction rate for experimental values will be slower than that predicted by transition state theory. The TST fails to take into account that even if there is sufficient energy to overcome the transition state barrier, a collision between reactant molecules may not always lead to a successful reaction. The outcome depends on more factors than just the activation barrier, for example, the relative kinetic energy, relative orientation and internal energy of the molecule. Moreover, TST assumes once the transition state has been reached the reaction cannot go back back to the reactants. This is not always the case, as shown by trajectory 4 above, the collision partners may form the activated complex only to fall apart back to the reactants. The gross simplifications made by transition state theory mean that in reality far fewer collisions occurring will be successful resulting in slower rates.
EXERCISE 2: F - H - H system
Question 1:- Classify the F + H2 and H + HF reactions according to their energetics (endothermic or exothermic). How does this relate to the bond strength of the chemical species involved?
F + H2 :Reaction is exothermic; energy is released as reactants are converted to products.
H + HF: Reaction is endothermic; energy is absorbed as reactants are converted to products.
Whether a reaction is endothermic or exothermic depends on the difference between the energy needed to break bonds and the energy released when new bonds form.
As more energy is required to break the H-F bond than is released upon forming the H-H bond we can deduce that the H-F bond is stronger. Likewise, more energy is released when the H-F bond forms which is consistent with a more stable and stronger bond than H-H.
The F + H2 reaction showing a reaction coordinate characteristic of an exothermic reaction 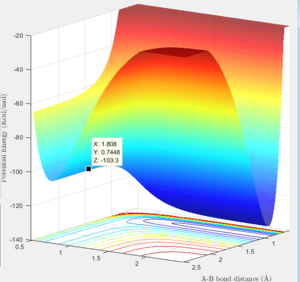 |
The H + HF reaction showing a reaction coordinate characteristic of an endothermic reaction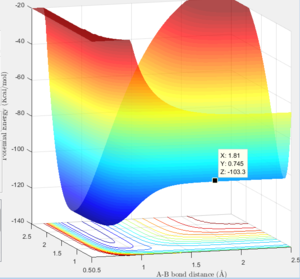 |
Question 2:- Locate the approximate position of the transition state.
Location of transition state: H-F(r1) = 1.810 H-H(r2) = 0.745.
This was identified using the same trial and error outlined previously.
The screenshots below both confirm the approximate location of the transition state and the location of the transition state is consistent with Hammond's postulate.
Surface plot showing the F-H-H transition state 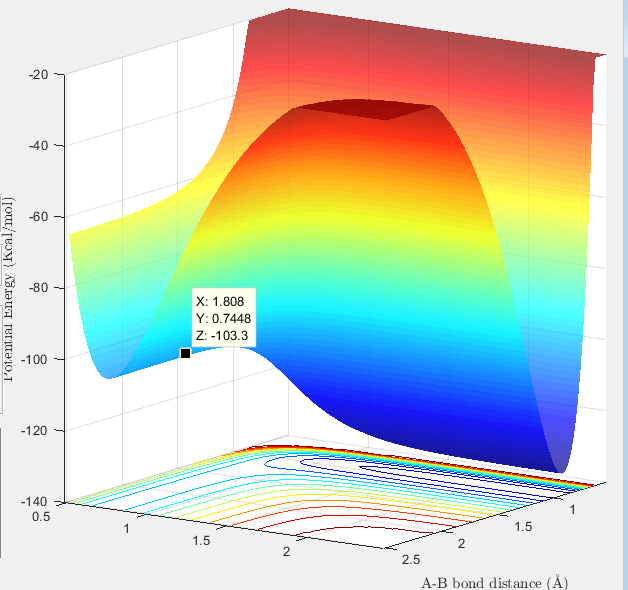 |
Internuclear distance versus time graph at the transition state 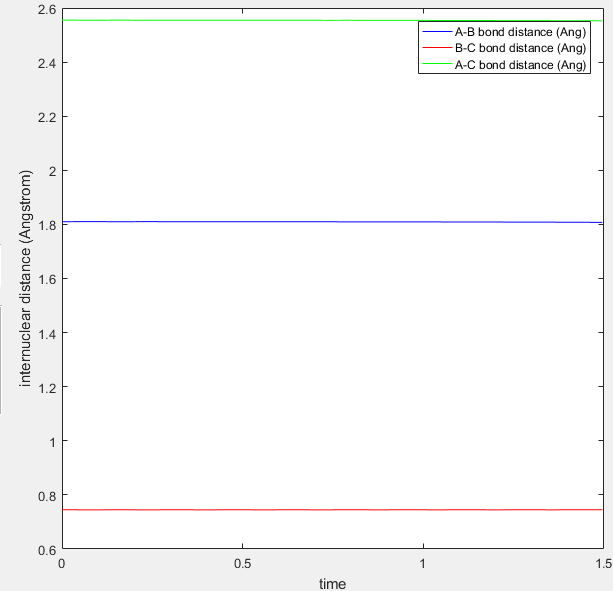 |
Question 3:- Report the activation energy for both reactions.
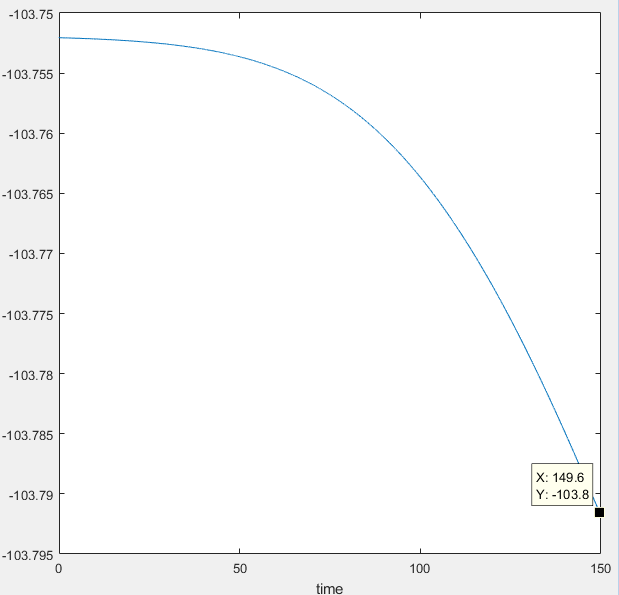
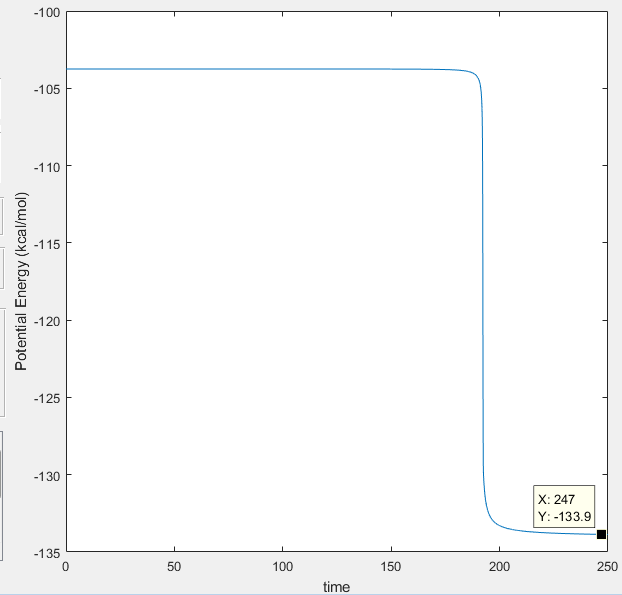
The activation energy will be the difference between transition state and the product and reactant minimas . The activation energy will be positive as an energy input is required to overcome the transition state.
Transition State (maxima): -103.3 Kcal/mol
Minima for H-H species: -103.8 Kcal/mol
Minima for H-F species: -133.9 Kcal/mol
Activation Energy for F + H2: 0.5 Kcal/mol
Activation energy H + HF: 30.6 Kcal/mol
Question 4:- Identify a set of initial conditions that results in a reactive trajectory for the F + H2, and look at the “Animation” and “Internuclear Momenta vs Time”. In light of the fact that energy is conserved, discuss the mechanism of release of the reaction energy. How could this be confirmed experimentally?
One set of initial conditions that results in a reactive trajectory:
- A-B distance : 2(A)
- B-C distance : 0.74(A)
- A-B momentum : -9
- B-C momentum : -6.7
One set of initial conditions that results in a reactive trajectory 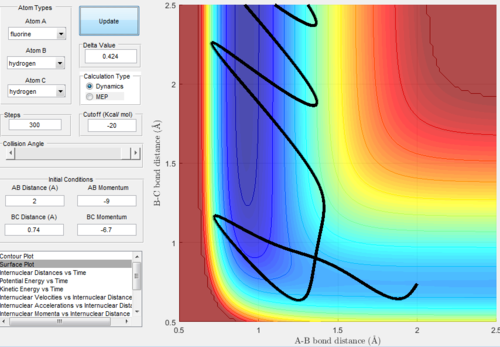 |
Internuclear momentum versus time graph for the reactive trajectory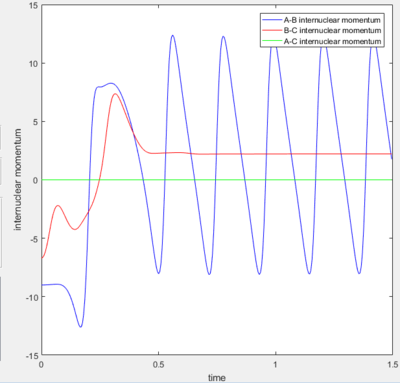 |
In order to identify the release of the reaction energy the internuclear momentum versus time plot was examined. From this plot we can see that the excess momentum remaining after the transition state is reached and the product is formed occurs as bond vibrations of the product. The oscillating momentum is consistent with vibrational motion; there is an exchange between the potential and kinetic forms of energy.
Several experiments could be carried out to confirm this:
- Infra-red spectroscopy could form the basis of one experiment. Excitation of vibrational states other than the ground vibrational state results in over-tone bands in the IR.
- Calorimetry could equally be used to detect the heat relelased from the vibrating bond.
- The photons emitted from the vibrating bond could be measured. The frequency of the photons can be used to find their energy and the excess energy released.
Question 5:-Discuss how the distribution of energy between different modes (translation and vibration) affect the efficiency of the reaction, and how this is influenced by the position of the transition state.
Polanyi's devised a set of empirical rules that illustrate the importance of the transition state and its role in the control of reaction dynamics. The rules can be summarised as follows[2]:
- For early barrier or reactant like reactions, translational energy between the two collision partners will be most effective in overcoming the barrier.
- For late barrier or product like reactions, enhanced vibrational excitation will increase the reactivity.
A more efficient reaction will be one in which there is a greater number of trajectories being successful and this corresponds to a greater yield. In order to decipher whether a reaction will be late or early stage, Hammond's postulate can be invoked: "If two states, as, for example, a transition state and an unstable intermediate, occur consecutively during a reaction process and have nearly the same energy content, their interconversion will involve only a small reorganization of the molecular structures." . Thus in an exothermic reaction the transition state lies closer to the reactants (termed early TS) whilst in an endothermic reaction the transition state will resemble the products (termed late TS).
We can use the example of the triatomic F-H-H system to illustrate Polanyi's rules.
- As established earlier the F + H2 reaction is exothermic and possess as early transition state. Increasing the momentum of the r2 bond is equivalent to increasing the vibrational energy. Increasing the energy of the r1 bond results in the translational energy increasing.
Let us consider the case where the reaction proceeds with more translational energy than vibrational energy. The surface plot shows the trajectory is successful passing from the reactant channel into the product channel with excess energy being discarded as vibrational motion. The internuclear momentum versus plot reinforces the fact that product formation occurs with excess energy being discarded as product bond vibration.
Surface plot for the F + H2 reaction with excess translational energy 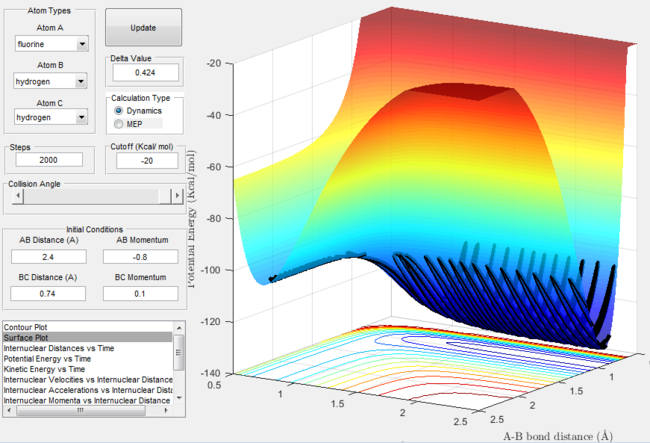 |
Internuclear momentum versus time graph for the F + H2 reaction with excess translational energy 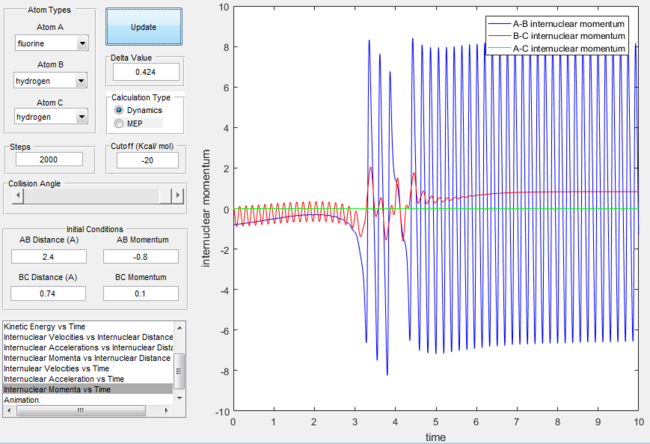 |
Let us consider the antithetical case where the vibrational energy is in excess. Despite the reactants vibrating strongly this energy is insufficient to mount the activation barrier. The trajectory illustrated in the surface plot never reaches the product channel. In addition, the internuclear momentum shows the product bond never forms.
Altering the direction of the momentum of the H-H bond (for example changing between p2=+3 and p2=-3) will result in the bond initially vibrating in opposite directions.
Surface plot for the F + H2 reaction with excess vibrational energy 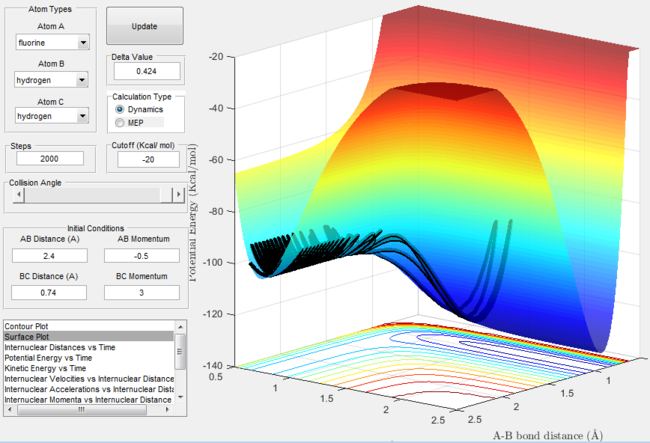 |
Internuclear momentum for the F + H2 reaction with excess vibrational energy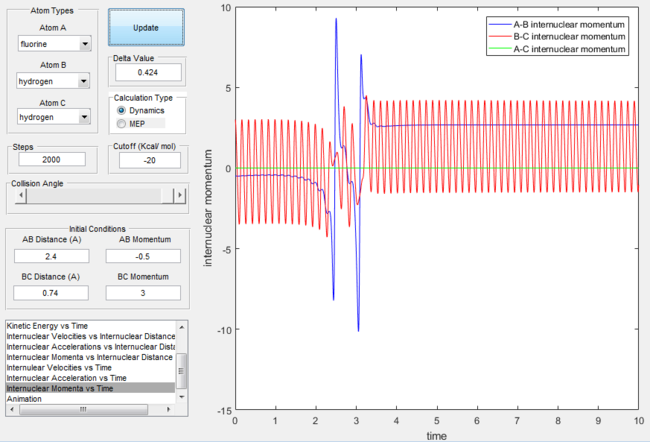 |
2.The H + H-F reaction is endothermic and product like with a late transition state. According to Polanyi vibrational excitation should have a higher efficacy in enhancing the reactivity than the translational energy. A larger r2 internuclear distance is required for the H-F reactants.
Firstly, lets consider the case where the reaction proceeds with an more vibrational energy than translational energy. Vibrational energy is indeed effective in driving the reaction. Increasing the magnitude of the vibration results in the bond stretching and contracting to a larger degree ie. the amplitude of vibration increases. This is sufficient to overcome the energy barrier.
Surface plot for the H + H-F reaction with excess vibrational energy 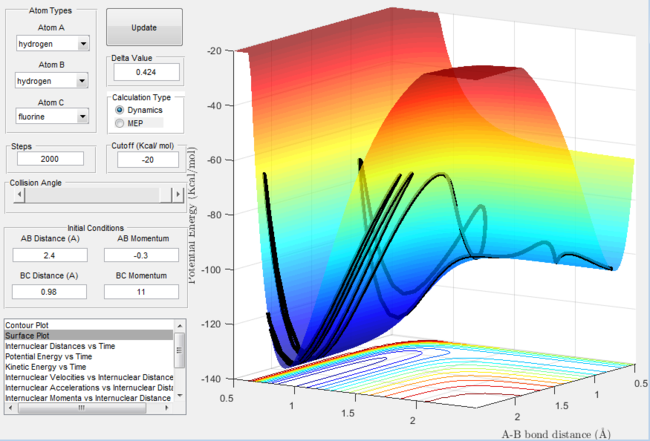 |
Internuclear momentum for the H + H-F reaction with excess vibrational energy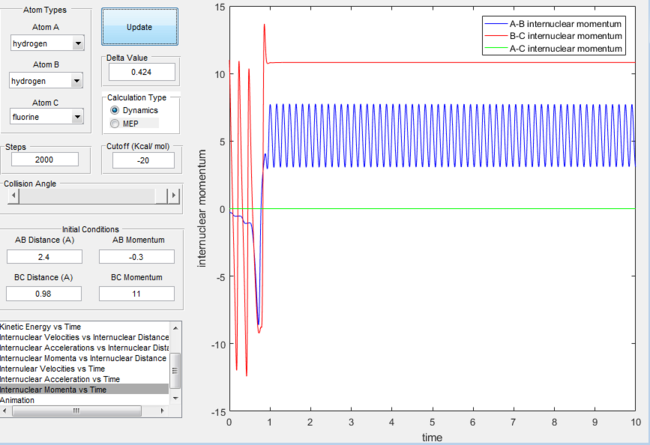 |
Secondly, lets consider the case where the translational energy outweighs the vibrational energy. The plots below show that despite the large translational energy input the products never form.
Surface plot for the H + H-F reaction with excess translational energy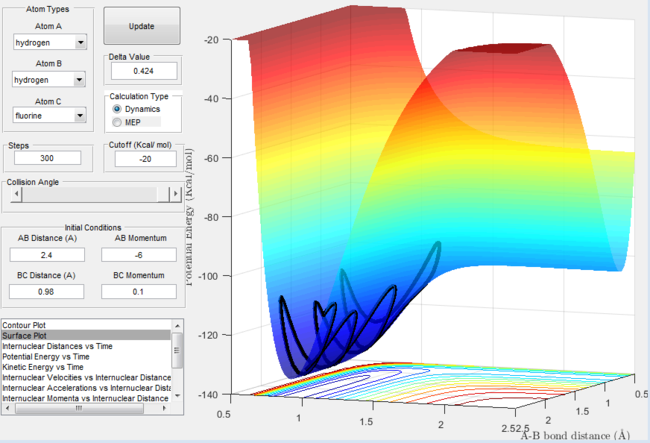 |
Internuclear momentum for the H + H-F reaction with excess translational energy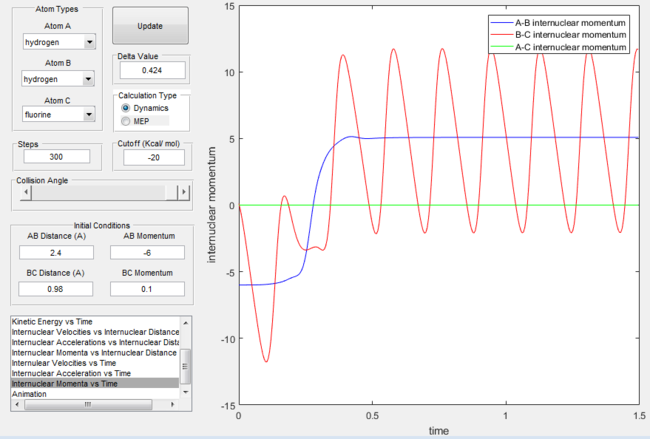 |
Conclusion
The reaction dynamics of the triatomic H-H-H and F-H-H systems were investigated using potential energy surfaces for the reaction as a function of nuclear positions. A point on the potential energy surface represents a state of the system and a trajectory from this point can then be calculated. These calculations are useful as they investigate the behavior of chemical reactions and how to maximise their efficiency.
References
- ↑ Protein dynamics and catalysis: the problems of transition state theory and the subtlety of dynamic control by J.R.E.T Pineda and S.D Schwartz, Phil. Trans. R. Soc. B.', 2006 361 (1472): 1433–1438. doi:10.1098/rstb.2006.1877
- ↑ Theoretical Study of the Validity of the Polanyi Rules for the Late-Barrier Cl + CHD3 Reaction by Zhaojun Zhang, Yong Zhou, and Dong H. Zhang, J. Phys. Chem. Lett., 2012, 3 (23), pp 3416–3419 DOI: 10.1021/jz301649w

