Sam Young Reaction Dynamics
H + H2 System
Q1 - Transition State Gradients

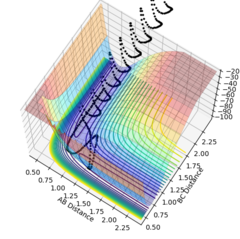
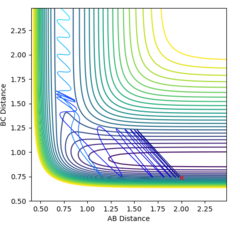
The minimum energy surface, shown running along the bottom of figure one obeys the derivative; ∂V/∂(rx) = ∂V/∂(ry) = 0, with rx and ry run parallel to their respective gradients. However, the saddle point where the transition state lies is located along the minimum energy surface at the maximum point. Therefore, it can be found by taking the second derivative, as the two orthogonal gradients have different signs, with one along the potential energy minimum being negative and the other orthogonal graident being positive.
∂2V/∂(rx)2 > 0
∂2V/∂(ry)2 < 0
Q2 - Transition State Estimate
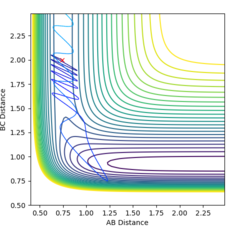
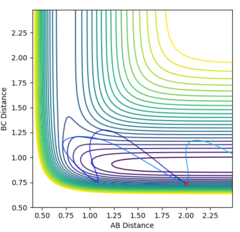
By making the momentum of the whole system equal to zero, it was possible to put the AB distance = BC distance and alter this value to obtain a result for the rts, which was found to be approximately 0.9077Å (one value due to the system being completely symmetric), which gave figure 2. This number was found by taking the intersect of the AB and BC lines from the internuclear plot with the same initial conditions given above, and optimising this value to give constant distances. Due to the gradient of potential energy at the transition state being zero, the system has no kinetic energy, only potential energy. Therefore, there is no oscillation and the plot of internuclear distance against time shows constant interatomic distances.

Q3 - MEP
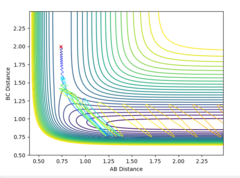
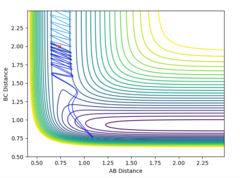
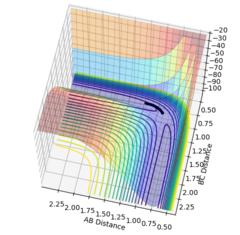
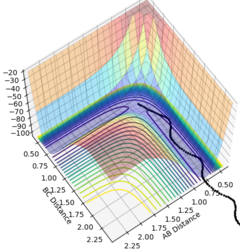
The MEP is the minimum energy pathway followed for the reaction H2 + H to take place, although it can be seen in figures 4 and 5 that it differs from the dynamic trajectory due to the masses of the atoms, and therefore the bond oscillations along the trajectory causing deviations from the mep. This is shown by the wavy black line on figure 5. Both figures illustrate the reaction path (represented by the black line) starting at the transition state point, with the dynamic reaction going to the complete formation of a H2 product, while the mep plot shows it going only slightly towards the product formation.
change with + - 0.01 and discuss
Q4 - Reactive and Unreactive Trajectories
Jas213 (talk) 21:27, 28 May 2018 (BST) Stating the initial conditions before the table and a concluding comment after the table would have been expected.
Q5 - Transition State Theory
Transition state theory focusses on the activated complexes formed at a transition state of the reaction, therefore by examining the transition state of a potential surface plot (found at the saddle point) one can obtain the rate of a reaction, due to the activated complex's quasi-equilibrium with the reactants. It assumes that if the collision is of sufficient energy to overcome the transition state, the products will form. This is based on the assumption that molecules react according to the classical picture, and does not take quantum mechanics into account, leading to limitations when considering phenomena such as tunnelling, whereby the reaction path bypasses a low activation energy. Furthermore the transition state theory does not account for reactions recrossing the activation barrier to return to the products as shown above. As a result, this theory would give a higher rate to the real situation, where the product can recross the transition state to return to the reactant (as shown in Part 2 Q5).
Jas213 (talk) 21:27, 28 May 2018 (BST) Correct observations. However you didn't clearly state all the main assumptions of TST giving a reference.
F H H System
Q1 - Energetics
F + H2 This reaction is shown to be exothermic (i.e. the system releases energy upon reacting, ΔH < 0) from the plot due to the energy minimum of the FH bond being lower in energy than the HH bond, therefore more stable. This is due to the large electronegativity difference between F (3.98) and H (2.20), as opposed to the non polar HH bond. As a result, the reaction of FH + H is therefore endothermic for the same reasons, due to the FH bond dissociation energy being larger than the HH bond formation enthalpy.

Q2 - Position of the Transition State
The transition state can be found at the point where the internuclear distances of the atoms does not change over time. This is the same point on the graph for both the forward and reverse reactions. By using Hammond's postulate, that the activated intermediate complex at the transition state should resemble the state that it is closest in energy to, therefore similar to an HF + H model. As a result, it was possible to look at the surface plot and optimise the bond distances around where the transition state was roughly located. It was found that the approximate internuclear distances at this transition state are H-F : 1.810 and H-H : 0.746.
Jas213 (talk) 21:29, 28 May 2018 (BST) Units missing.


Q3 - Activation Energy
By finding the equilibrium bond length of both reactants and products, and knowing the location of the transition state, it was possible to obtain energies for all of these positions, and therefore calculate the energy of activation.
Energy at HF minimum -133.586 AB 2.3 BC 0.9
Energy at HH minimum -103.33 AB 0.7 BC 2.3
Energy at transition state -103.742 AB 0.75 BC 1.81
Jas213 (talk) 21:30, 28 May 2018 (BST) Again units are missing, kcal/mol has no capital k. Energies are slightly different. This is an approach to check your results. However, the question explicitly asked you to use the MEP and obtain the TST from there. These plots are missing.
ΔE = E(transition state) - E(reactants)
ΔEFH + H‡ = (-103.742) - (-133.586) = 29.844 Kcalmol-1
ΔEH2 + F‡ = (-103.742) - (-103.330) = 0.412 Kcalmol-1
Q4 - Mechanism of Release of the Activation Energy
F + H2
This plot shows the reaction of initial conditions FH distance = 2.0Å HH distance = 0.74Å FH momentm = -0.5 HH momentum = -2.0, resulting in a successful reaction. Due to the exothermic nature of this reaction, it releases energy as the products have a lower potential energy than the reactants, and from the plot of internuclear distance vs. time, it is clear that this energy is converted to kinetic energy in the form of an oscillating F-H bond, which oscillates at a much higher energy than the original H-H bond. This could be confirmed experimentally by IR which would show the vibrationally excited state of the H-F bond, or energy can be measured by calorimetry inorder to prove that it is conserved.

Q5 - Efficiency of Reaction
Figures 10-14 clearly show the effect of varying the translaitonal and vibrational contributions to the reaction trajectory of both the endothermic and exothermic reactions. For the exothermic F + H2 reaction, the momentum of the translaitonal approach of the F atom was kept constant while the momentum of the H-H oscillation was varied between 3kgms-1 and -3kgms-1. The result clearly shows that for this early transition state reaction, a higher vibration energy causes the reaction path to overcome the transition state but it recrosses this barrier to return to the initial state due to too much energy. The limit (to 2 d.p.)of the vibrational energy was found to be -2.49kgms-1 in order for the reaction to be successful. A higher energy would cause the recrossing. This case is the opposite for the endothermic reaction, with a late transition state, whereby if the translational energy is too high the reaction will cross then recross the transition state to return to the products, resulting in an unsuccessful reaction. The limit of translational energy for this reaction was found to be -0.61kgms-1.
To conclude, the success of an early transition state reaction depends on the vibrational energy, while the success of the late transition state depends on the translational energy, with both rebounding back to reactants with of the energy is too high because it still has enough energy to overcome the reverse reaction due to it being energetically excited.
Jas213 (talk) 21:37, 28 May 2018 (BST) The limit is X, what do you mean? Higher or lower than that there will be no reaction? Try to be more specific. All your plots also only show the H2+F reaction, what about the reverse reaction that you are talking about? It is a bit confusing to follow. How does your observation relate to the Polanyi rules? You were expected to cite Polanyi's rules here.
Bibliography
Electronegativity values : https://sciencenotes.org/list-of-electronegativity-values-of-the-elements/
Physical Chemistry, Ninth Edition, Peter Atkins & Julio De Paula , Oxford University Press


