SA inorg comp
BH3
Method: B3LYP
Basis Set: 6-31G(d,p)
 Item               Value     Threshold  Converged?
 Maximum Force            0.000158     0.000450     YES
 RMS     Force            0.000079     0.000300     YES
 Maximum Displacement     0.000621     0.001800     YES
 RMS     Displacement     0.000310     0.001200     YES
 Predicted change in Energy=-1.466776D-07
 Optimization completed.
    -- Stationary point found.
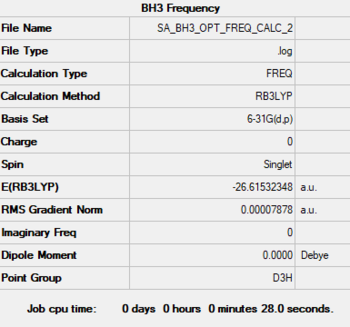
Low frequencies ---   -0.2458   -0.1130   -0.0054   43.9715   45.1306   45.1313
Low frequencies --- 1163.6034 1213.5913 1213.5940
File:SA BH3 OPT FREQ CALC 2.LOG
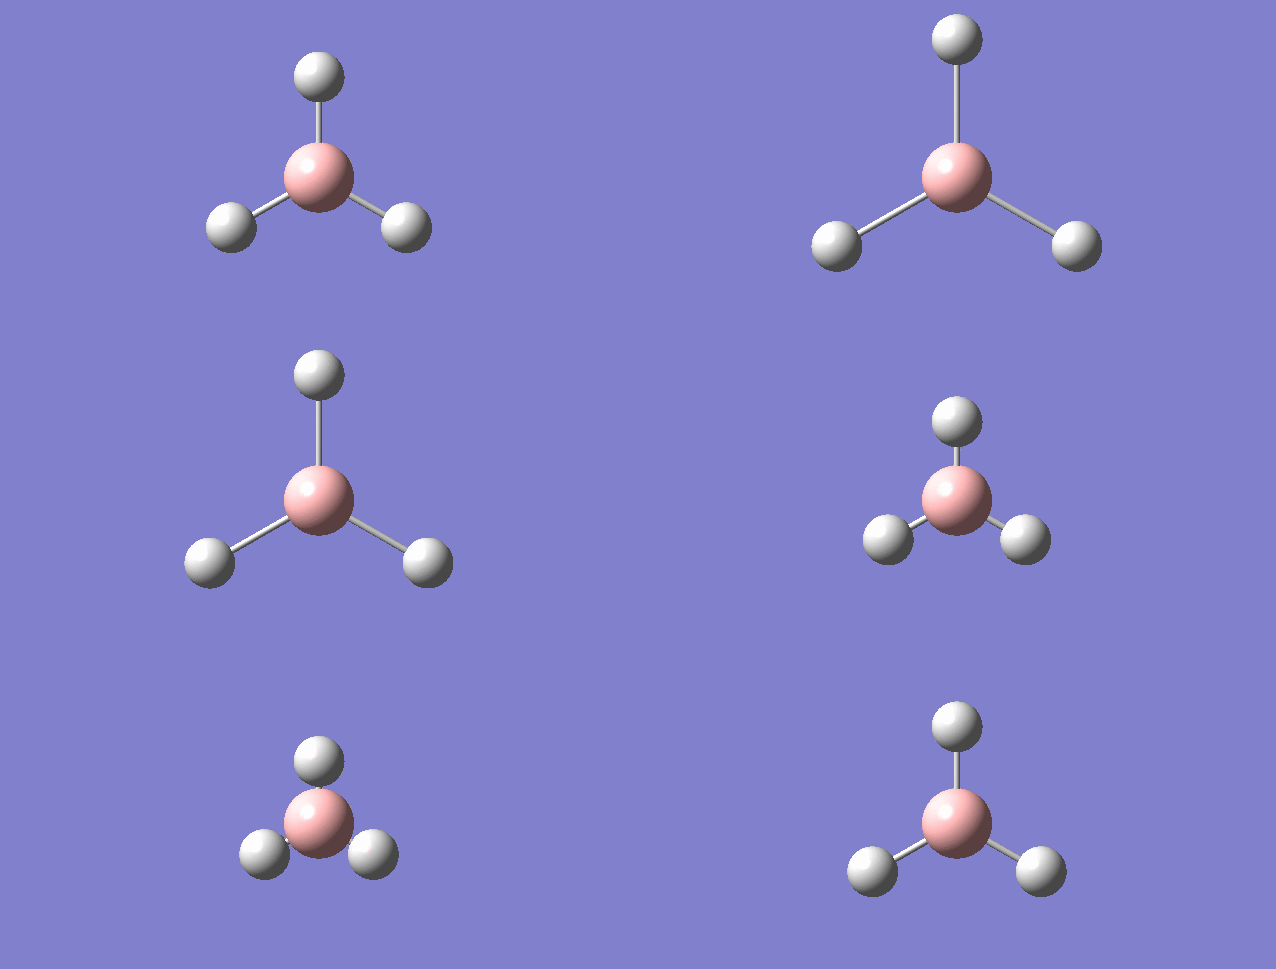
optimised BH3 molecule |
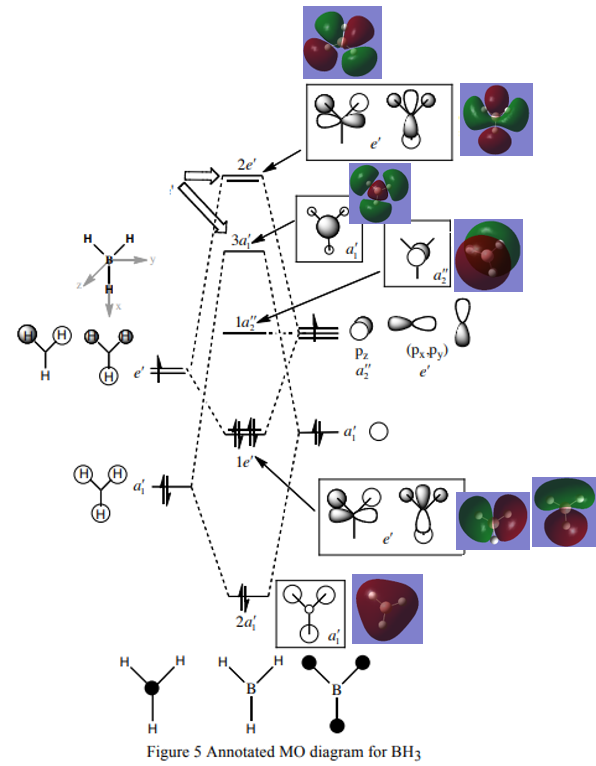
MO Diagram of BH3
(MO diagram for BH3, Lecture 4 Tutorial Problem Model Answers, P. Hunt, [1], accessed 22/05/19)
Ng611 (talk) 11:51, 7 June 2019 (BST) You should also add a comment about the accuracy/usefullness of qualitative MO theory here
Vibrations and IR Spectrum
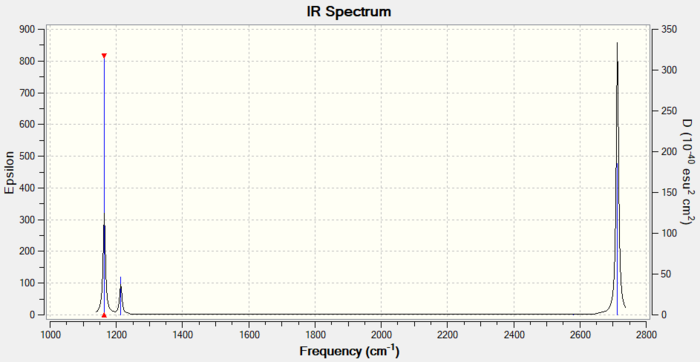
There are less than six peaks in the spectrum, although there are six vibrations.
This is because some of the vibrations are degenerate, i.e. mode 2 and 3, or 5 and 6. They have the same energy so they only result in a single peak.
Mode 3 cannot be observed since the vibration is symmetric and thus there is no change in dipole moment.
Association energies
NH3
Method: B3LYP
Basis Set: 6-31G(d,p)
Item               Value     Threshold  Converged?
 Maximum Force            0.000006     0.000450     YES
 RMS     Force            0.000004     0.000300     YES
 Maximum Displacement     0.000012     0.001800     YES
 RMS     Displacement     0.000008     0.001200     YES
 Predicted change in Energy=-9.844602D-11
 Optimization completed.
    -- Stationary point found.
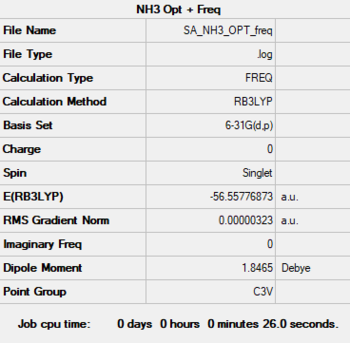
Low frequencies ---   -0.0129   -0.0024   -0.0007    7.1034    8.1048    8.1051
 Low frequencies --- 1089.3834 1693.9368 1693.9368
Ng611 (talk) 11:54, 7 June 2019 (BST) I need the .log file from your frequency job, not your opt+frequency job.
optimised NH3 molecule |
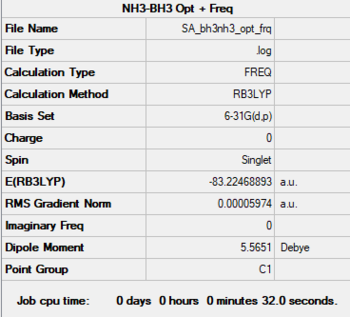
NH3-BH3
Method: B3LYP
Basis Set: 6-31G(d,p)
Item               Value     Threshold  Converged?
 Maximum Force            0.000123     0.000450     YES
 RMS     Force            0.000058     0.000300     YES
 Maximum Displacement     0.000585     0.001800     YES
 RMS     Displacement     0.000320     0.001200     YES
 Predicted change in Energy=-1.738521D-07
 Optimization completed.
    -- Stationary point found.
Low frequencies ---   -0.0006   -0.0006    0.0010   16.8436   17.4462   37.3291
Low frequencies ---  265.8243  632.2043  639.3227
optimised NH3-BH3 molecule |
Energies
E(NH3) = -56.558 au
E(BH3) = -26.615 au
E(NH3BH3) = -83.225 au
ΔE = E(NH3BH3)-[E(NH3)+E(BH3)]
ΔE = -83.225 - [(-56.558) + (-26.615)] = -0.052
Ng611 (talk) 11:57, 7 June 2019 (BST) You should round to 5 d.p., not 5 s.f.
ΔE = -0.052 au = -136.526 kJ/mol
Ng611 (talk) 11:57, 7 June 2019 (BST) Too many d.p. here. Your calculations are accurate to about 1 kJ/mol and the accuracy of your final answer should reflect this.
NI3
Method: B3LYP
Basis Set: 6-31G(d,p) on N, LanL2DZ on I
Item               Value     Threshold  Converged?
 Maximum Force            0.000088     0.000450     YES
 RMS     Force            0.000044     0.000300     YES
 Maximum Displacement     0.000859     0.001800     YES
 RMS     Displacement     0.000481     0.001200     YES
 Predicted change in Energy=-1.195113D-07
 Optimization completed.
    -- Stationary point found.
Low frequencies ---  -12.3843  -12.3779   -5.6125   -0.0040    0.0194    0.0711
Low frequencies ---  100.9306  100.9313  147.2331
File:SA NI3 OPT FREQ CALC 2.LOG
optimised NI3 molecule |
optimised N-I bond lengthː 2.184 Å
Metal Carbonyls
Predictions
Going along the periodic table from titanium (Ti) to iron (Fe) the charge on the metal atom becomes more positive. This should stabilise the molecular orbitals. Moreover, the back donation should decrease, so going fro Ti to Fe the metal-carbon bonds should get weaker while the carbon-oxygen bond gets stronger. The stronger C≡O bonds result in higher frequencies for the C≡O stretch.
As the more electron density is on metal the more back donation is expected, resulting in a stronger M-C bond, weaker C≡O bond. This it is expected that the Ti-C bond will be the strongest.
The Fe-C bond is expected to be the weakest since it has least electron density. It readily accepts sigma electron density but is reluctant in back donation.
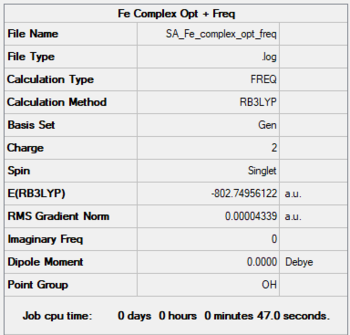
Fe - Complex
Method: B3LYP
Basis: 6-31G(d,p) for C≡O, LanL2DZ (pseudo potential) for Fe
Fe-C bond length: 1.942 Å
Item               Value     Threshold  Converged?
 Maximum Force            0.000054     0.000450     YES
 RMS     Force            0.000024     0.000300     YES
 Maximum Displacement     0.000429     0.001800     YES
 RMS     Displacement     0.000200     0.001200     YES
 Predicted change in Energy=-6.077456D-08
 Optimization completed.
    -- Stationary point found.
Low frequencies ---  -10.5292  -10.5292  -10.5292    0.0012    0.0014    0.0015
Low frequencies ---   82.1285   82.1285   82.1285
File:SA FE COMPLEX OPT FREQ.LOG
optimised Fe-complex molecule |
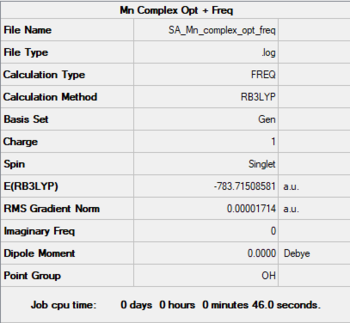
Mn - Complex
Method: B3LYP
Basis: 6-31G(d,p) for C≡O, LanL2DZ (pseudo potential) for Mn
Mn-C bond length: 1.908 Å
Item               Value     Threshold  Converged?
 Maximum Force            0.000054     0.000450     YES
 RMS     Force            0.000024     0.000300     YES
 Maximum Displacement     0.000435     0.001800     YES
 RMS     Displacement     0.000206     0.001200     YES
 Predicted change in Energy=-6.975532D-08
 Optimization completed.
    -- Stationary point found.
Low frequencies ---   -0.0003    0.0005    0.0006    4.7607    4.7607    4.7607
Low frequencies ---   76.3202   76.3202   76.3202
File:SA MN COMPLEX OPT FREQ.LOG
optimised Mn-complex molecule |
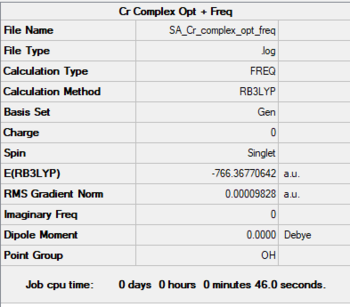
Cr - Complex
Method: B3LYP
Basis: 6-31G(d,p) for C≡O, LanL2DZ (pseudo potential) for Cr
Cr-C bond length: 1.915 Å
Item               Value     Threshold  Converged?
 Maximum Force            0.000160     0.000450     YES
 RMS     Force            0.000057     0.000300     YES
 Maximum Displacement     0.000218     0.001800     YES
 RMS     Displacement     0.000078     0.001200     YES
 Predicted change in Energy=-9.793326D-08
 Optimization completed.
    -- Stationary point found.
Low frequencies ---   -0.0003   -0.0002    0.0004   10.8502   10.8502   10.8502
Low frequencies ---   66.4359   66.4359   66.4359
File:SA CR COMPLEX OPT FREQ.LOG
optimised Cr-complex molecule |
Analysis
| Complex | Metal-Carbon bond length (Å) | Charge on Metal | C≡O bond length (Å) | C≡O stretching frequency (cm-1) |
|---|---|---|---|---|
| Ti | 2.047 | -2 | 1.183 | 1855 |
| V | 1.954 | -1 | 1.166 | 1969 |
| Cr | 1.915 | 0 | 1.149 | 2087 |
| Mn | 1.908 | +1 | 1.136 | 2198 |
| Fe | 1.942 | +2 | 1.125 | 2297 |
Ti and V Data from Shazeen Amir [2]
A trend is observed. From Ti to Mn the M-C bond length is decreasing, meaning the bond is getting stronger. This is contrary to what was predicted.
Iron is unusual as the Fe-C bond is weaker and longer than the Mn-C bond. This could be a result of the contraction of d-orbitals that is caused by the +2 on Fe. The contraction causes greater repulsion between the electrons (which are all spin paired). The contraction means there is less efficient overlap with C≡O causing longer/weaker bonds.
Speaking to Prof. Hunt resulted in the idea that the trend and the anomality of iron could be explained by correlation and exchange theory, which at the moment are too advanced for this course.
That the data contradicts the prediction may also be due to the calculation method used. For all these calculations the method used was B3LYP and there might be other more suitable methods.[3]
Ng611 (talk) 12:04, 7 June 2019 (BST) A very sensible explanation and discussion.
Furthermore from Ti to Fe the C≡O bonds get stronger. This is according to the predictions, and also shown by the increase in wavenumbers of the C≡O stretch.
Ng611 (talk) 12:05, 7 June 2019 (BST) Good!
Symmetric C≡O stretch
The symmetric C≡O stretch is not observable in IR spectroscopy as it causes no change in dipole moment. When comparing the calculated frequencies for the symmetric C≡O stretch for all the metal complexes, there is clearly a trendː from Ti to Fe the wavenumber increases.
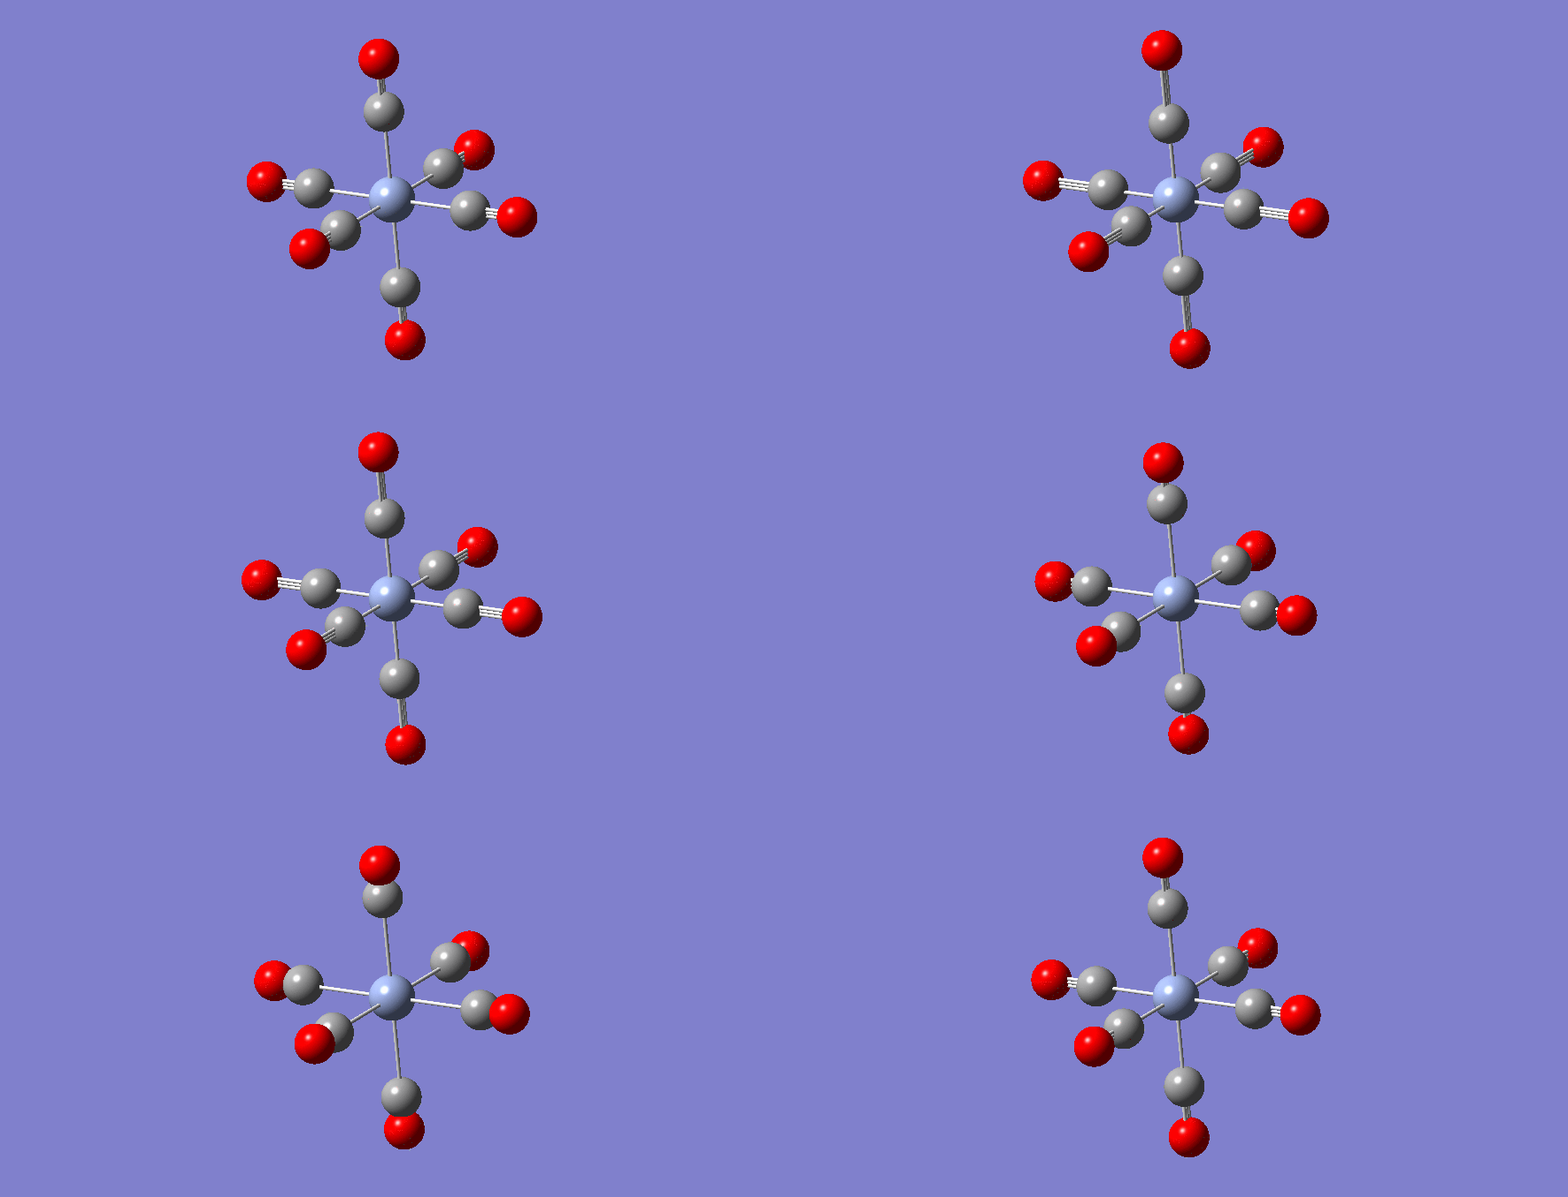
| Complex | C≡O symmetric stretching frequency (cm-1) |
|---|---|
| Ti | 1990 |
| V | 2095 |
| Cr | 2189 |
| Mn | 2265 |
| Fe | 2322 |
MOs of Cr-Complex


Ng611 (talk) 12:10, 7 June 2019 (BST) Good!


Ng611 (talk) 12:10, 7 June 2019 (BST) Good, although a little easy.
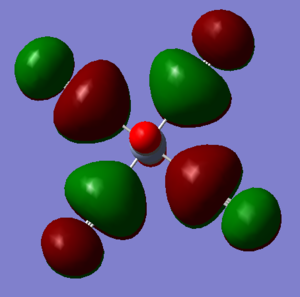

Ng611 (talk) 12:10, 7 June 2019 (BST) Correct LCAO but the difference in orientation between your GaussView picture and your LCAO diagram made it hard to correctly judge.
Ng611 (talk) 12:10, 7 June 2019 (BST) All correct, although I'd have liked to have seen some of the more challenging MOs tackled.

