Ruman comput wiki
What value do the different components of the gradient of the potential energy surface have at a minimum and at a transition structure? Briefly explain how minima and transition structures can be distinguished using the curvature of the potential energy surface?
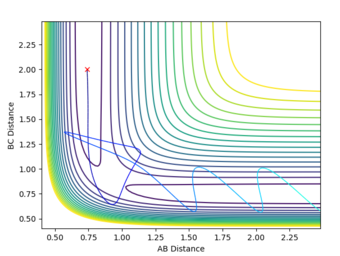
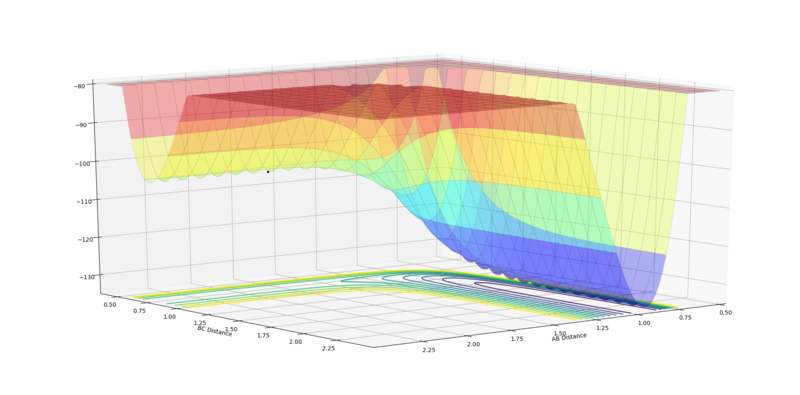
The transition state is present as a saddle point along the product and reactant channel. The reactant channel has a potential energy minima where ∂V(r1)/∂r1=0, and the product channel has a minima where ∂V(r2)/∂r2=0. The transition state is a maximum along these channels, however the transition state is a minimum orthogonal to these channels (saddle point). Here ∂V2(ri)/∂(ri)2<0 at the saddle point and ∂V2(ri)/∂(ri)2 = 0 at the reaction channels.
|
Mm10114 (talk) 20:31, 31 May 2018 (BST) Well explained.
Report your best estimate of the transition state position (rts) and explain your reasoning illustrating it with a “Internuclear Distances vs Time” plot for a relevant trajectory.
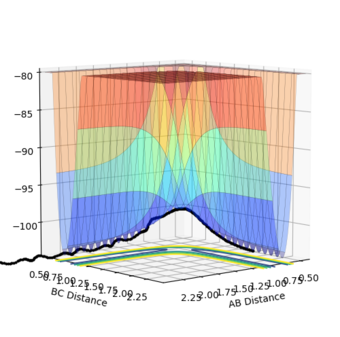
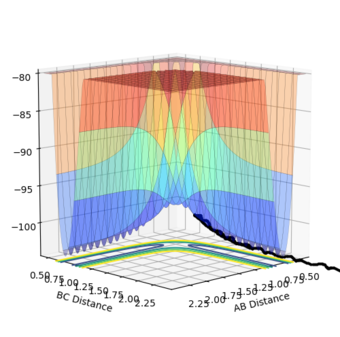
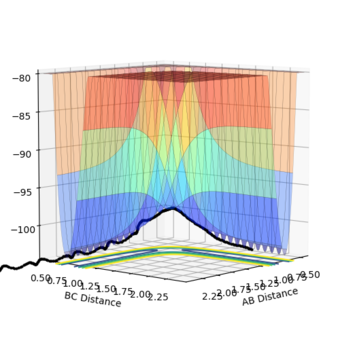
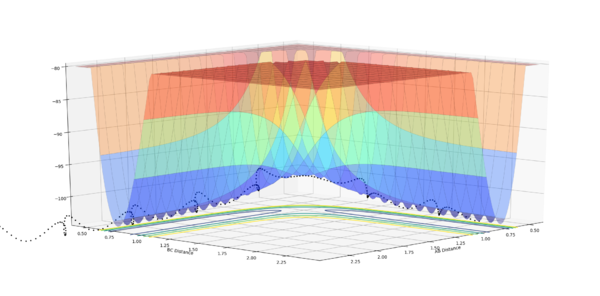
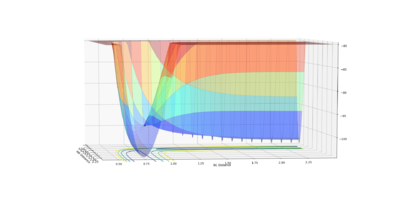
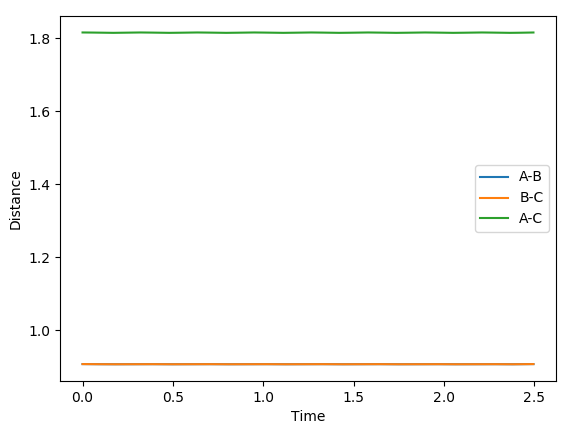
The transition point position is found when the A-C distance and B-C distance both 0.908Å. The potential energy surface point is evidence of this as it shows the bond to be single point at the saddle point. Furthermore, the Internuclear Distances vs Time shows the A-C and A-B plots to overlap, be constant throughout, indicating no oscillation to be present. Mm10114 (talk) 20:31, 31 May 2018 (BST) Could've described briefly how did you find it.
| Surface Plot | Surface plot (side view) | Internuclear Distances vs Time |
|---|---|---|
|
|
|
Comment on how the mep and the trajectory you just calculated differ.
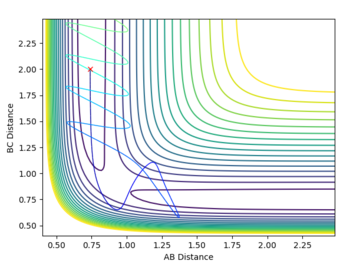
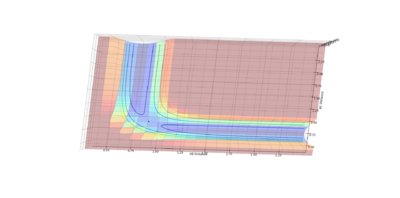
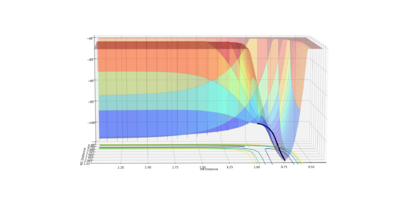
The MEP is the minimum energy path that corresponds to infinitely slow motion, where the velocity always reset to zero in each time step. The momenta is set to zero, hence no oscillation is present, this therefore displays a plot in which the trajectory is straight follows the valley floor to H1+ H2-H3.
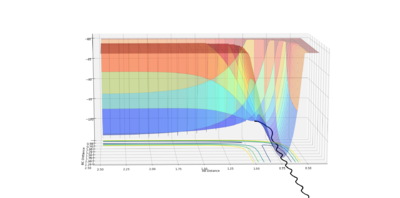
The calculation type was reset to Dynamics, to show the effect mass has upon the trajectory. The plot obtained shows inertia to sway the motion of the atoms, hence leading to a more curved trajectory pattern.
| MEP Surface Plot (20,000 steps used) | Dynamics Surface Plot |
|---|---|
|
|
Complete the table by adding a column with the total energy, and another column reporting if the trajectory is reactive or unreactive. For each set of initial conditions, provide a plot of the trajectory and a small description for what happens along the trajectory.
State what are the main assumptions of Transition State Theory. Given the results you have obtained, how will Transition State Theory predictions for reaction rate values compare with experimental values?
The two most basic assumptions of transition state theory 1:
1)Separation of electronic and nuclear motions, which is known as the Born-Oppenheimer approxiamtion in quantum mechanics
2)Reactant molecules are distributed among their states in accordance with the Maxwell-Boltzmann distribution
This theory makes three further assumptions:
3) Molecular systems that cross the transition state (forming products), cannot reform reactants
4) In the transition state, motion along the reaction coordinate can be treated as only transnational
5) When no equilibrium is present between products and reactants, transition states that are becoming products are distrusted among their states (follows the Maxwell-Boltzmann laws) Not necessary, follows from first assumption
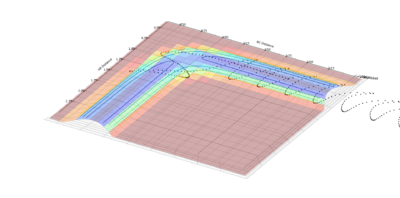
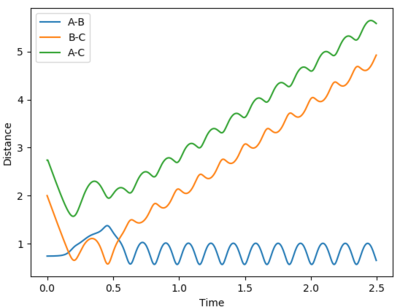
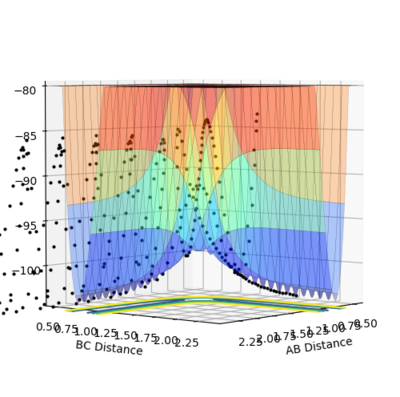
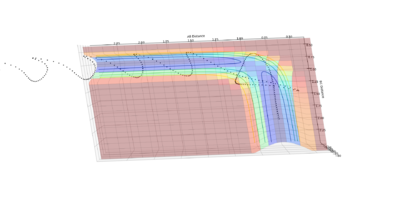
| Experiement 4 birds-eye view | Experiement 4 Internuclear Distance Vs Time | Experiment 5 | Experiment 5,Surface plot birds-eye view |
|---|---|---|---|
|
|
|
|
The results obtained from experiments 4 and 5, does not follow assumption 3 of the transition state theory. Both experiments show the trajectory crossing the transition state, then returning to reactant energy channel. These simulations were run with higher momentum values than needed in order to react, thus leading to high energy trajectory's which do not act as expected.
Mm10114 (talk) 20:31, 31 May 2018 (BST) Well done. However, you've forgot to comment how, in light to these assumptions, the TST predicted reaction rates compare to experimental values.
EXERCISE 2: F - H - H system
Classify the F + H2 and H + HF reactions according to their energetics (endothermic or exothermic). How does this relate to the bond strength of the chemical species involved?
The mean bond enthalpy for the H-H is 436 KJmol-1, whilst the H-F enthalpy is 565 KJmol-1. This therefore shows the F + H2 reaction to be exothermic as an excess of 129 KJmol-1 of energy is given out to the surroundings due to the formation of the stronger H-F bond. This therefore can be used to predict that the H + HF reaction will be endothermic as energy is needed to break the strong H-F bond and form the weak H-H bond 2.
Mm10114 (talk) 20:31, 31 May 2018 (BST) The 'kilo' in kJ should be lower case, there should be a space between kJ and mol and the -1 as upper-script. Keep more attention to the formatting.
Locate the position of the transition state
| System | r1 (Å) | r2 (Å) | Transition state (kcal/mol) |
|---|---|---|---|
| F-H-H | 1.8106 | 0.745 | -103.752 |
Report the activation energy for both reactions
Calculation type was set to MEP, with 200,000 steps.
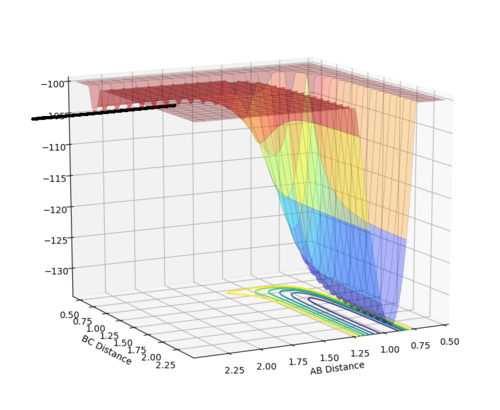
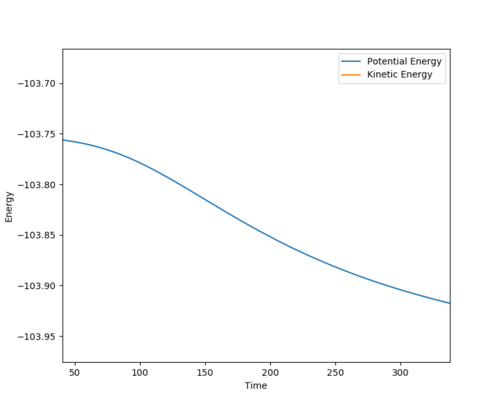
F + H2 System, the activation energy was found to be EA= 30.2533 kcal/mol. Where the r1 = 1.8306 and r2 = 0.745
| Surface plot of the activation energy | Energy vs Time (potential energy) |
|---|---|
|
|
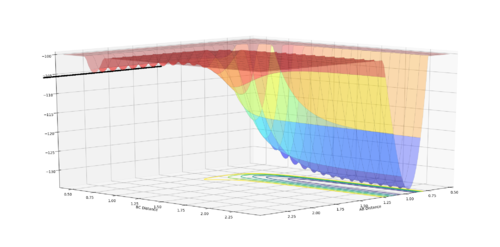
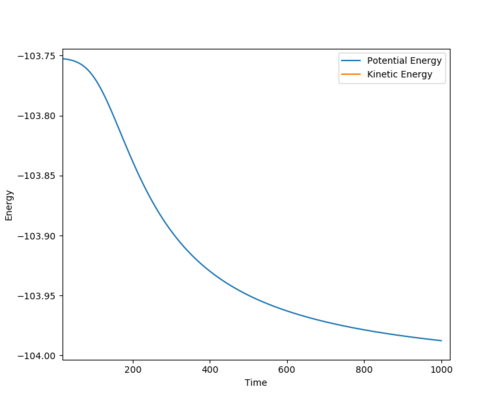
H + F-H System, the activation energy was found to be EA= 0.246777. Where r1 - 1.8206 and r2=0.750
| Surface plot of activation energy | Energy vs Time (potential energy) |
|---|---|
|
|
In light of the fact that energy is conserved, discuss the mechanism of release of the reaction energy. How could this be confirmed experimentally?
Identify a set of initial conditions that results in a reactive trajectory for the F + H2, and look at the “Animation” and “Internuclear Momenta vs Time”.
| System | r1 (Å) | r2 (Å) | p1 | p2 | Total energy (kcal/mol) |
|---|---|---|---|---|---|
| F + H2 | 2.5 | 0.745 | -0.8 | 0 | -103.752 |
These conditions result in a reactive trajectory, allowing the formation of H-F product.
The first law of thermodynamic states "That the total energy of an isolated system is constant", This means that energy cannot be created or destroyed, but can be transformed from one form to another. The internuclear momenta vs time graph shows the momentum of A to be constant until B-C is in a reasonable range to react. This shows a large amount of potential energy being converted into vibration energy. This vibrational energy causes the bond to oscillate at a high rate. Furthermore this large transfer of energy from potential to vibrational can be confirmed experimentally by measuring the change in electromagnetic radiation emitted in the IR region as the reaction proceeds.
Internuclear Momenta vs Time graph
Discuss how the distribution of energy between different modes (translation and vibration) affect the efficiency of the reaction, and how this is influenced by the position of the transition state.
The most important factor in determining the distribution of products is the location of the early barrier (in the reactants channel) and late barrier (in the products channel) on the reaction coordinate1.
Polanyi's empirical rules show that translational energy most effective to cross early barrier (early transition state, resembles reactants), whereas if the reactants vibrational energy is too high, the reaction may not proceed. This is the opposite for late energy barrier (late transition state, resembles product), where vibrational energy is preferred over translational energy.
F + H2 System (Earlier barrier)
| Situation | rFH (Å) | rHH (Å) | pFH | pHH | Reactive/unreactive | |
|---|---|---|---|---|---|---|
| High translational energy | 2.4 | 0.7453 | -0.7 | -0.2 | Reactive | 
|
| High vibrational energy | 2.4 | 0.7453 | -0.7 | -2 | Unreactive | 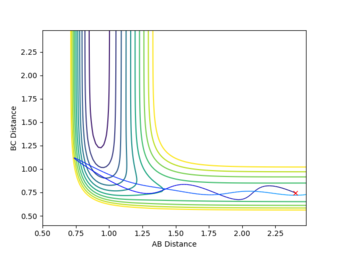
|
H + H-F System (Late barrier)
| Situation | rFH (Å) | rHH (Å) | pFH | pHH | Reactive/unreactive | |
|---|---|---|---|---|---|---|
| High translational energy | 0.91 | 2.4 | -7 | -7 | Unreactive | 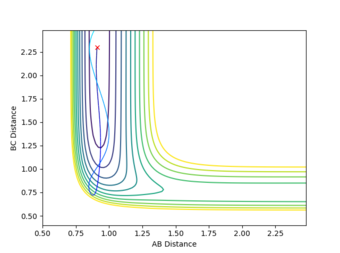
|
| High vibrational energy | 0.91 | 2.4 | -0.1 | -9 | Reactive | 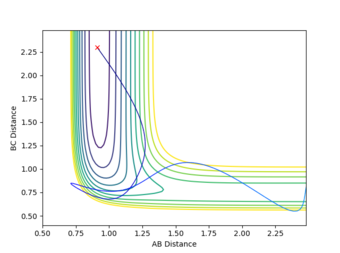
|
From the results generated it can be seen that an excess amount of translational energy would lead to the molecules hitting, and rebounding off the walls of the potential surface with no product formation. Whilst too much vibrational energy results in the molecules oscillating without reaching and exceeding the barrier
References
1) J. I. Steinfeld, J. S. Francisco, W. L. Hase Chemical Kinetic and Dynamics, Chapter 10, 297-310
2) P.Atkins and J. de Paula, Physical Chemistry, 10th Edition:2014

