Rep:Year3 MgO fd915
Felix de Courcy-Ireland - fd915 - 01062960 - Third Year 'Thermal Expansion of MgO' Computational Laboratory
Introduction
The aim of the third year 'Thermal Expansion of MgO' computation laboratory was to use two different forms of computational simulation (one based upon the quasi-harmonic approximation and the other a molecular dynamics calculation) to study the thermal expansion of magnesium oxide (MgO), to compute free energies of MgO, and calculate the volumetric thermal expansion coefficient of this system using Eq. 1.
Where is the volumetric thermal expansion coefficient, is the initial volume of the system, and is the rate of change in volume with temperature. A good understanding of thermal expansion has many useful applications. Civil engineers need to be able to predict how building materials expand as they are heated - this has lead to the incorporation of an expansion joint into bridges. Research is also done specifically on the computer-simulated thermal expansion of MgO, as the earth's mantle[1] contains a considerable amount of MgO, and so geophysicists are interested in fine-tuning these calculations.
Quasi-Harmonic Simulation
A brief discussion of the underlying theory is required to facilitate proper discussion of the quasi-harmonic approximation, and the results from the calculations carried out.
The quasi-harmonic approximation is based on quantum mechanics, and using it, the vibrations in a crystal lattice can be treated as waves or as quantised particles - these particles are referred to as phonons. A phonon is a discrete quantum of vibration, just as a photon is a discrete quantum of light[2]. Due to the large amount of atoms in these crystal systems, they can be treated as an infinite lattice of atoms, with each atom having associated with it a set of orbitals. As the orbitals on these atoms overlap, there is effectively a continuum of energies formed through the crystal lattice, ranging from the lowest energy, most bonding configuration to the highest energy, most anti-bonding configuration. This effective continuum of orbitals can be shown graphically, whereby it becomes known as a band structure, see Fig 1.
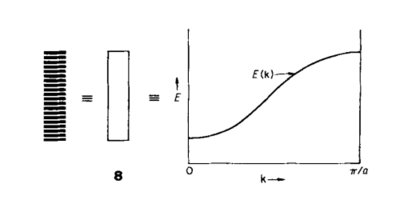
Fig. 1 shows a plot of the wavevector, k, and the energy levels corresponding energy to these values of k. The plot is for values of k between and , as it is between this limit that unique values for the energy levels are obtained. This limit defines what is known as the first Brillouin Zone[4]. Moving outside of this limit can be thought of in terms of translation through over the infinite lattice - if one translates by in any direction, one simply returns to the point where one started, and so the same energy value will be obtained.
Using the quasi-harmonic approximation, values of k are sampled to return their corresponding energy values, and from these energy values, phonon dispersion curves are obtained, see Fig. 2. These phonon dispersion curves show the energy levels associated with a specific path through k-space - the path taken is given as the x-axis.
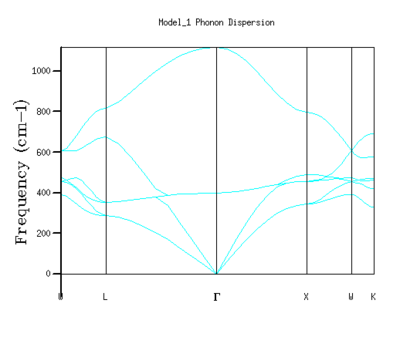
Ideally, one would cycle through every value of k and obtain the corresponding molecular energy levels, and then use this information to calculate properties of interest in the material. However, as the crystal structure contains atoms on the order of Avogadro's constant, there are a similarly vast amount of k values, which would take a very long time to analyse. The solution to this is to sample the Brillouin Zone at regular intervals, using a grid of sufficient density so that enough energy levels are sampled, yet not looking at so many k-values that the computation takes too long. If more k-values in the first Brillouin Zone are sampled, more energy levels are used in the calculations of density of state, and free energy, making the results from these more accurate.
Fig 1 also illustrates a second important concept required in the analysis the quasi-harmonic approximation, and that is the concept of reciprocal space.
As a face-centred cubic structure, the crystal structure of MgO can be described with a single lattice parameter, a. As can be seen from Fig 1, the repeat period of the sinusoidal curve from the Brillouin Zone is . This value, is defined as the cell length, a*, in the reciprocal lattice[4].
Where is the lattice parameter in direct space and is the lattice parameter in reciprocal space.
The first calculation method utilised the quasi-harmonic approximation, whereby shrinking factors where selected to choose a suitable grid density for sampling the phonon frequencies of the simulated MgO crystal at temperatures ranging from 0 - 1000 K. The quasi-harmonic approximation expands upon the harmonic approximation to better simulate the real behaviour of a material - this progression from the harmonic to the quasi-harmonic approximation is a good example of the perturbation method, often used in physics[4]. In the quasi-harmonic approximation, the equilibrium distance between atoms is permitted to change with temperature, therefore allowing the system to expand upon heating - this change in equilibrium bond distance is not permitted in the harmonic approximation[5].
Molecular Dynamics Simulation
The second method used molecular dynamics to simulate the expansion of the MgO crystal system. Molecular dynamics calculations rely on solving Newtons laws of motion, and are therefore classically mechanic [5]. At each fixed temperature, the initial system, with constant pressure and number of particles, was allowed to vary in volume. The simulated particles moved around randomly, as they would do in reality - and as the system equilibrated, the properties of the systems were computed from the average movement of the atoms.
Experimental
Two methods were used to calculate the volumetric expansion coefficient of MgO - making use of lattice dynamics and molecular dynamics. In a virtual Linux environment, DL Visualise[6] was used as the interface with the General Utility Lattice Program (GULP[7]) to simulate the expansion of MgO from 0 - 1000 K. Data for optimised energies and volumes were plotted and analysed using Python on a Jupyter Notebook.
First, a phonon dispersion curves for the MgO system were calculated. 50 points along a path W-L-G-X-W-K in the reciprocal space were computed - and the phonon dispersion curves in Fig 2 were returned.
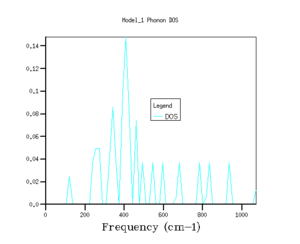
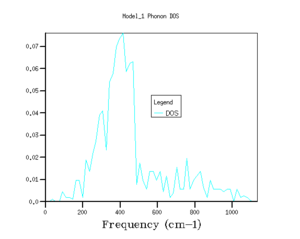
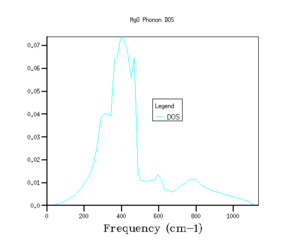
The shrinking factors were varied along the three axis of the reciprocal lattice, and the phonon density of states were calculated. Starting with a grid density of 1x1x1, the shrinking factors were increased up to 64x64x64, with the GULP program returning values for the minimised zero point energy for each calculation, as well as the phonon density of states graphs (see Fig's 3 - 8 and Table 1).
Next, the Helmholtz Free Energy of the MgO lattice was calculated, using the quasi-harmonic approximation. Shrinking factors from 1x1x1 to 64x64x64 were used to minimise the Helmholtz Free Energy at 300 K (see Table 3).
The Helmholtz Free Energy of the crystal was then optimised at 100 K intervals, between 0 and 1000 K, using a grid density of 32x32x32 - this was deemed to give the best balance between calculation accuracy and computational intensity. From the GULP output, plots were obtained for the Free Energy against temperature, and lattice constants from the optimised MgO system against temperature.
A further graph of optimised primitive cell area against temperature was plotted, and from the fitted gradient of this graph, the thermal expansion coefficient of MgO was obtained using eq. 1.
Finally, molecular dynamics calculations were carried out using a cell containing 32 MgO units. The number of particles, temperature and pressure were again kept constant, with the volume allowed to vary. Readings were taken at 100 K intervals, between 100 K - 1000 K. The values for the optimised unit cell volume were converted to corresponding values for the primitive unit cell. A plot of optimised primitive unit cell volume against temperature was then used to determine the volumetric thermal expansion coefficient.
Results and Discussion
Phonon Modes of MgO

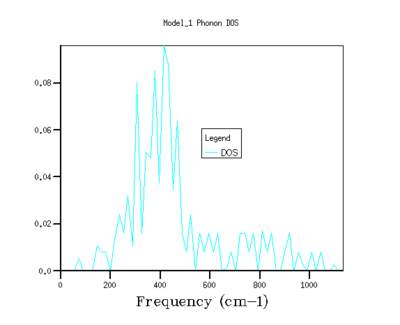
As shrinking factor increases and the grid is divided into smaller and smaller increments, the density of states distributes out across the entire frequency range. As the shrinking factor increases, the number of k values sampled increases, and so a fuller picture of the occupancy of energy states is obtained. As the Brillouin zone is divided up into smaller and smaller segments (by increasing the shrinking factor), more and more k values are measured, until effectively the plot of DOS versus energy appears to show a continuum.[3]. With a grid size of 5x5x5, the energy of system converges to a value in eV accurate to 6 dp (Fig 4), this is the limiting accuracy of the calculation. Graphically, the grid size needs to be increased closer to values of 32x32x32 (Fig 7) before there appears to be no change in the graph with increasing shrinking factor. However, although the graphs for the density of states do become smoother as the grid size increases, the main features of the graphs, such as the magnitude and positions of the peaks, are clear well before this.
| Grid Density | Energy (eV) |
|---|---|
| 1x1x1 | 0.172063 |
| 2x2x2 | 0.174209 |
| 3x3x3 | 0.174331 |
| 4x4x4 | 0.174339 |
| 5x5x5 | 0.174340 |
| 6x6x6 | 0.174340 |
| 8x8x8 | 0.174340 |
| 16x16x16 | 0.174340 |
| 32x32x32 | 0.174340 |
| 64x64x64 | 0.174340 |
Hoffmann describes the density of states as a return from k-space to real space, with the density of states curve being related to the gradient of the dispersion curve[3]. The smaller the gradient of the dispersion curve in a given energy range, the greater the density of states in this energy range. In plain English, the flatter the dispersion curve of a given energy range, the more energy levels there are in this energy range.[3]
With the density of states calculated for MgO, one can consider how these calculations might be altered if different materials were to be analysed. The consideration of three compounds with varying lattice parameters - Calcium oxide, Faujasite and lithium metal - provide this opportunity (Table 2).
| Compound | a (Å) | a* (Å) | Grid Size |
|---|---|---|---|
| MgO[8] | 4.21 | 1.49 | 32x32x32 |
| CaO[9] | 4.81 | 1.31 | 28x28x28 |
| Faujasite[10] | 24.57 | 0.26 | 6x6x6 |
| Lithium[11] | 3.5 | 1.79 | 38x38x38 |
As the unit cell of the material under study becomes larger, the size of the reciprocal lattice shrinks. This means for a given grid size, more values of the k-space are sampled if the unit cell of a material is large, compared to whether it is small. Therefore, a smaller grid size can be used to sample the reciprocal space of a material with a larger unit cell, and still obtain as much information on phonon frequency.
In this instance, MgO and Cao have very similar lattice parameter sizes, however the lattice parameter for CaO is slightly bigger than that of MgO. This leads to a smaller value for the unit cell of the reciprocal lattice of CaO, a*. This smaller value for a* means that a slightly smaller grid size could be used in the calculation on CaO, however the differences in the value for a* of MgO and CaO are small (see Table 2) and so a change in grid size would only cause minor changes to the calculation.
The lattice parameter a for the perovskite is far larger than that of MgO, by a factor of 6. Due to the inverse relationship between a and a*, the unit cell of the reciprocal lattice of Faujasite is 6 times small than that of MgO. Consequently, a calculation on Faujasite requires a far less dense grid compared to that of a calculation on MgO.
Finally, the body-centred cubic lithium structure has a lattice parameter of a = 3.5 A, and so consequently will have a slightly larger value of a* versus MgO. Therefore calculations with lithium require a slightly more dense grid size than that of MgO.
Calculating the Helmholtz Free Energy of MgO within the harmonic approximation
| Grid Density | Helmholtz Free Energy (eV) | Helmholtz Free Energy (kJ/mol) |
|---|---|---|
| 1x1x1 | -40.930301 | -3949.148006 |
| 2x2x2 | -40.926609 | -3948.791810 |
| 3x3x3 | -40.926432 | -3948.774713 |
| 4x4x4 | -40.926450 | -3948.776419 |
| 8x8x8 | -40.926478 | -3948.779123 |
| 16x16x16 | -40.926482 | -3948.779580 |
| 20x20x20 | -40.926483 | -3948.779614 |
| 24x24x24 | -40.926483 | -3948.779629 |
| 32x32x32 | -40.926483 | -3948.779641 |
| 64x64x64 | -40.926483 | -3948.779648 |
The free energy decreases with grid density, until a value of around 20x20x20 - at this point, the programme has minimised the free energy of the system accurate to 0.01 meV. A grid density of 3x3x3 was found to be appropriate for calculations accurate to 1 meV, and a grid density of 4x4x4 was found to be accurate for calculations accurate to 0.5 meV and 0.1 meV.
| Compound | a (Å) | a* (Å) | Grid Size |
|---|---|---|---|
| MgO | 4.21 | 1.49 | 20x20x20 |
| CaO | 4.81 | 1.31 | 18x18x18 |
| Faujasite | 24.57 | 0.26 | 3x3x3/4x4x4 |
| Lithium | 3.5 | 1.79 | 24x24x24 |
Using the previously mentioned arguments, one can speculate on the possible changes to the calculation that would be required if different materials, with different lattice parameters were analysed, using the ratios of the a* values to approximate changes to grid density (Table 4).
Thermal Expansion of MgO
Taking a value for the grid density of 32x32x32, graphs of Helmholtz Free Energy and temperature, and lattice parameter against temperature were plotted (Fig 9 and 10).
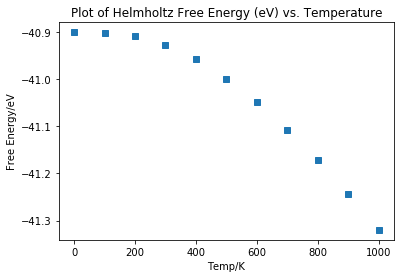


Both these curves show a linear region at the first two data points at 0 K and 100 K. Both curves then trace a line of fairly steady gradient for the final data points between 200 K and 1000 K. This linear portion can be attributed to quantum mechanical effects inherent in the use of the quasi-harmonic approximation, which contribute considerably at lower temperatures[5].
The coefficient for thermal expansion was calculated after omitting the first two data points at 0 K and 100 K due to these quantum mechanical. The value obtained was 2.711 x 10⁻⁵.
| Temperature (K) | (K-1 x 10 -5 )[12] |
|---|---|
| 100 | 0.63 |
| 200 | 2.24 |
| 300 | 3.11 |
| 400 | 3.57 |
| 500 | 3.84 |
| 600 | 4.04 |
| 700 | 4.17 |
| 800 | 4.29 |
| 900 | 4.41 |
| 1000 | 4.50 |
The value calculated in the lab was an average of the thermal expansion coefficient over a large temperature range (800 K).
The main approximations in these calculations are inherent in the difference between using the harmonic approximation versus the quasi-harmonic approximation. In the harmonic approximation, the bond equilibrium distance does not change, whereas in the quasiharmonic approximation, the equilibrium bond distance does change with temperature. This leads to a change in volume as the temperature is raised. It is this change in volume with temperature that allows calculation of the volumetric expansion coefficient.
The value obtained for the thermal expansion coefficient varied across the temperature range that was used in the calculations.
If the results from 200-600 K are used, then the value for alpha obtained is 2.334 x 10⁻⁵ - corresponding literature value is 3.84 x 10⁻⁵ If the results from 600-1000 K are used, the value obtained is 3.007 x 10⁻⁵, corresponding literature value is 4.39 x 10⁻⁵.
The calculation consistently underestimates the value for the thermal expansion coefficient.
The physical origin of thermal expansion is that as a sample is heated, the molecules in the given sample gain more kinetic energy, and the molecules vibrate more, with each molecule taking up a great amount of space. This leads to the thermal expansion of the material.
At the melting point of MgO, the sample undergoes a phase transition from a solid to a liquid. Phonons do not represent well the motion of ions in a liquid, as in a liquid, the atoms are free-flowing. Phonons require a regular arrangement of atoms through which to propagate, this regular arrangement of atoms breaks down in a liquid.
In the harmonic approximation, the length of the bond fluctuates between greater extremes as the temperature increases, however the equilibrium bond distance remains unchanged. In the quasi-harmonic approximation, the equilibrium bond distance is allowed to change as the temperature increases - this is a far more realistic representation. In the harmonic approximation, the temperature can increase infinitely, and the bond between the atoms will not break, however in the quasi-harmonic approximation, the equilibrium bond distance increases with temperature.
Molecular Dynamics
Fig 12. shows the fitted plot used to calculate the volumetric thermal expansion coefficient using a molecular dynamics simulation.

2.994205 x 10⁻⁵ K-1 predicted by the molecular dynamics simulations over the values 100 - 1000 K is closer to the experimental values obtained by Suzuki et al.[12] compared to the value of 2.711 x 10⁻⁵ obtained using the quasi-harmonic approximation over the temperature range 200 - 1000 K.
The two simulations are underpinned by contrasting models of motion, the quasi-harmonic approximation being based in quantum mechanics, and the molecular dynamics relying on classical, Newtonian mechanics.
It has been noted in the literature that at high temperatures[13], the quasi-harmonic approximation overestimates the molar volume of perovskite crystals of MgSiO3, as the approximation does not take into account higher-order anharmonic effects.
At lower temperatures, the molecular dynamics calculation is subject to quantum effects that can significantly alter the value for the volumetric thermal expansion coefficient[1] . In the literature, similar molecular dynamics calculations have required quantum corrections of 37 % of the classically derived value at temperatures of 300 K. In the calculation carried out in this laboratory, there was no amendment to the molecular dynamics simulation to atone for these quantum mechanical effects, such as the use of a Wigner-Kirkwood expansion[1].
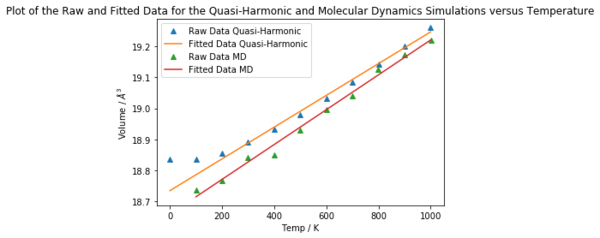
In theory, the larger the cell used, the more reliable the value obtained from the molecular dynamics calculation, although using a larger cell would be more computationally expensive. The molecular dynamics calculations gave a value for the volumetric thermal expansion coefficient of 2.994 x 10⁻⁵ K-1 over the temperature range 100 - 1000 K. Experimentally determined values are listed in Table X, and these values are of the same order of magnitude as that calculated by MD. The MD values are also closer to those calculated using the quasi-harmonic approximation.
At high temperature, the quasi-harmonic approximation tends to infinity, as the bonds between the atoms are broken. With the molecular dynamics.
Harmonic approximations cannot account for the thermal dependence of equilibrium properties such as the volumetric thermal expansion coefficient, or the occurrence of phase transitions[5]. At higher temperatures, the quasi-harmonic approximation suffers from some of these higher order anharmonic effects.
Conclusion
A lattice dynamics calculation using the quasi-harmonic approximation and molecular dynamics calculation were used in the calculation of the volumetric expansion coefficient. Both had with them errors associated with their relative basis in quantum mechanics and classical Newtonian mechanics. Both methods yielded values for the volumetric expansion coefficient to the correct order of magnitude, however both underestimated the experimentally determined values for the coefficient, and so further optimisation of the calculations is required, such as potentially modifying the molecular dynamics calculation with a Wigner-Kirkwood expansion.
References
- ↑ 1.0 1.1 1.2 M. Matsui, J. Chem. Phys., 1989, 91, 489.
- ↑ S.H. Simon, The Oxford Solid State Basics, OUP Oxford, 2013, https://ebookcentral.proquest.com/lib/imperial/detail.action?docID=1336493
- ↑ 3.0 3.1 3.2 3.3 3.4 R. Hoffmann, Angew. Chemie-International Ed. English, 1987, 26, 846–878
- ↑ 4.0 4.1 4.2 4.3 M. T. Dove, Introduction to Lattice Dynamics, CUP, 2016, ch. 2, pp. 18–35
- ↑ 5.0 5.1 5.2 5.3 M. T. Dove, Introduction to Lattice Dynamics, CUP, 2016, ch. 8, pp. 101-131
- ↑ B.G. Searle, Computer Physics Communications, 2001, 137, p. 25
- ↑ GULP - a computer program for the symmetry adapted simulation of solids, J.D. Gale, JCS Faraday Trans., 1997, 93, 629
- ↑ R.W.G Wyckoff, AJS Online, 1925, 9, 54, 448-459
- ↑ D.K. Smith, H.R. Leider, J. Appl. Cryst., 1998, 1, 246.
- ↑ H. D. Simpson, H. Steinfink, Jour. Am. Chem. Soc., 1969 91 (23), 6225-6229
- ↑ M.R. Nadler and C.P. Kempfer, Anal. Chem., 1959, 31, 2109.
- ↑ 12.0 12.1 Y. Sumino, O. L. Anderson and I. Suzuki, Phys. Chem. Miner., 1983, 9, 38–47
- ↑ G. D. Price and A. Patel, Geophysical Research Letters, 1994, 21, 1659–1662.

