Rep:YR316DYN
Molecular Reaction Dynamics
H + H2 system
Question 1: minimum and saddle
What value do the different components of the gradient of the potential energy surface have at a minimum and at a transition structure? Briefly explain how minima and transition structures can be distinguished using the curvature of the potential energy surface.
In this triatomic system where the HA is approaching HBHC with an initial momentum. r1 is the distance between HA and HB and r2 is the distance between HB and HC. The total potential energy of the system () is changing with respect to both r1 and r2. Hence the gradient of potential energy consists of two components: and . The minima correspond to the minimum potential energy of the oscillating system HBHC (before collision)or HAHB (after collision). Mathematically, the minimum can be expressed as =0 and =0 respectively. is partial differentiation, it differentiates V with respect to r2 while treating r1 as constant. The curvatures of the minima are described by the second partial derivative: Vr1r1 and Vr1r1 and smaller 0. They are the minimum point viewing from cross sections along r1 and r2 respectively. It is the same when Hc is leaving after the collision.
However, as said at the beginning while HBHC are oscillating, HA is approaching and this increases the potential energy of the system. The different minima at different r1 values increases to a saddle point. This is the maximum point in the trough created by joining the minima when viewing from potential surface. At this point both and are 0. The curvature at this point can be described by the determinant: Vr1r1•Vr1r1-V2r1r2. This point corresponds to the transition state of the system.
Ng611 (talk) 13:38, 8 June 2018 (BST) You've got the right idea for the TS, although your explanation is somewhat confusing to read. A diagram would help you significantly here.
Question 2: estimation of transition state
Report your best estimate of the transition state position (rts) and explain your reasoning illustrating it with a “Inter-nuclear Distances vs Time” plot for a relevant trajectory.
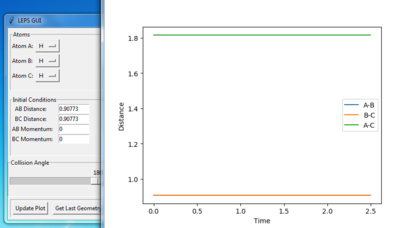
The transition state is estimated to be at r1=r2=0.90773 as shown in figure 1.
figure 1. “Inter-nuclear Distances vs Time” plot at stationary point
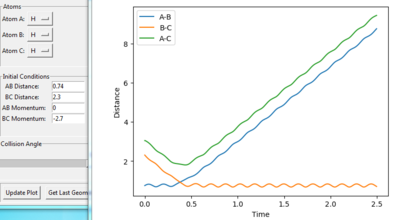
figure2. “Inter-nuclear Distances vs Time” plot under one initial condition
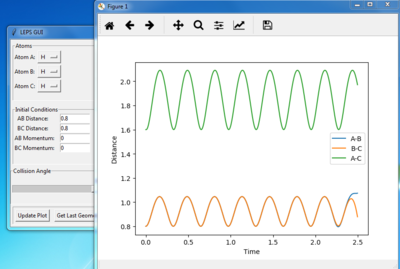
Figure 1 shows under one initial condition when HA collides with HB HC the intercept of the A-B and B-C line gives a rough estimation of where the transition would be. A more accurate estimation can be done by setting the momentum to zero while changing values for distances (keep r1=r2 as the potential surface of H + H2 is symmetric. The trajectory would be stationary i.e. distance does not vary with time for a transition state as suggested by the definition of a stationary point(saddle as an example). while at other point it would produce a oscillation pattern over time as shown in figure 3.
figure 3. “Inter-nuclear Distances vs Time” plot at stationary point at other r1=r2 points other then the stationary points
Question 3: comparing dynamics and MEP
Comment on how the MEP and the trajectory you just calculated differ.
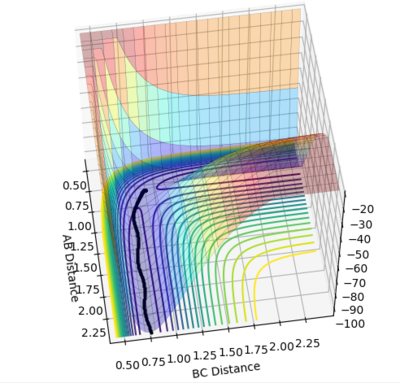
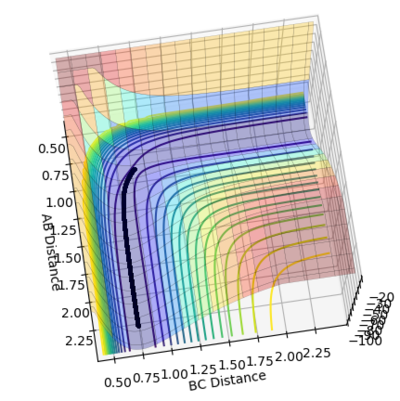
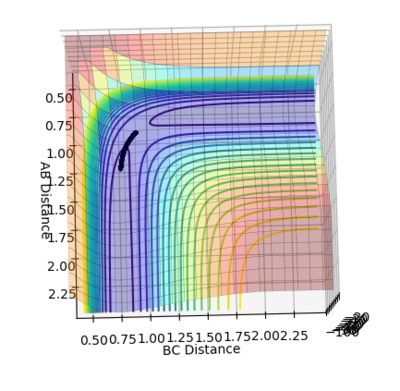
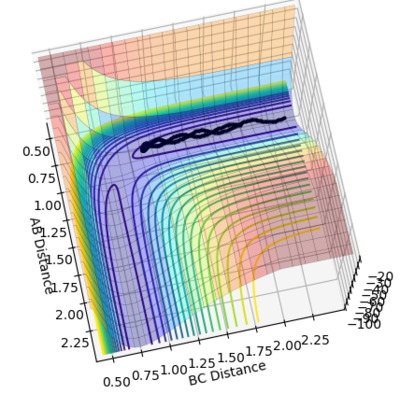
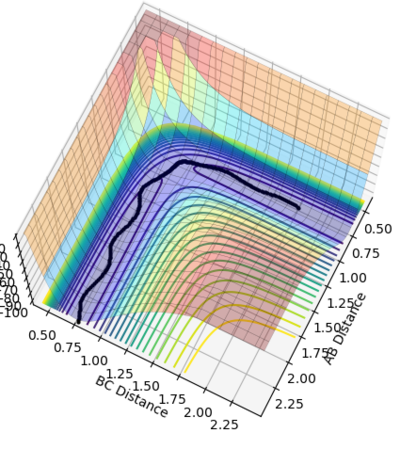
Figure 4 and 5 shows the reaction path calculation under dynamic method and MEP method respectively. Both of them have initial condition r1=0.91773, r2=0.90773, p1=p2=0. The pathway calculated with dynamic method is wavy, while the pathway calculated with MEP method is a smooth curve. MEP stands for minimum energy pathway, in each step of MEP the momentum was reset to zero, hence the inter-conversion between kinetic and the oscillation are ignored. HBH1 of the molecule was ignored and was set at minimum potential energy along the pathway. The step number chosen for dynamics was 150 steps while that of the MEP calculation was chosen to be 10000. The reason for MEP has a much larger step number is also because that in each step of MEP the momentum was reset to zero and the inertia of the particles are ignored, while the momentum in the dynamic method was cumulative. Hence, if the same step number was chosen for both method, MEP result would give a much shorter of path length due to this reset of momentum.
Ng611 (talk) 13:39, 8 June 2018 (BST) Good explanation!
Figure 4. Pathway calculation with dynamic method
Figure 5. Pathway calculation with MEP method
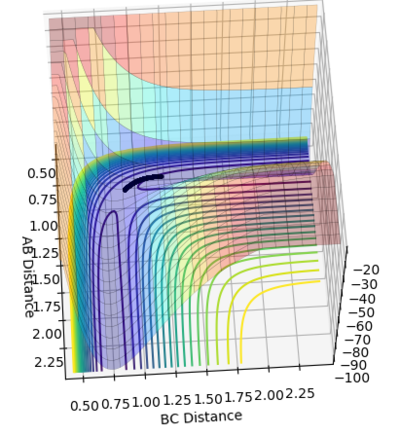
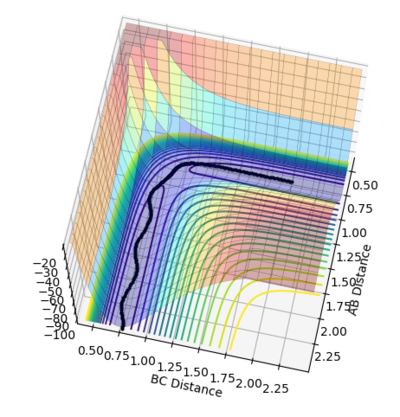
If the initial conditions was set to r1 = rts and r2 = rts+0.01 instead, the reaction pathways would be a mirror image of r1=rts+0.01 and r2=rts condition with orthogonal plane r1=r2 as the mirror plane as shown in figure 6. This is due to the fact that the initial position of the trajectory was reversed. If the initial positions was set to be the same as the final positions of the previous trajectory, the new resultant trajectory would represent the reverse reaction of the previous trajectory.
Figure 6. mirror image to each other: r1=rts+0.01 and r2=rts(left) r1 = rts and r2 = rts+0.01 (right) with steps extended to 500
Question 4: reactive and unreactive trajectory
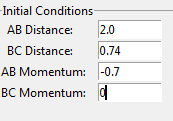
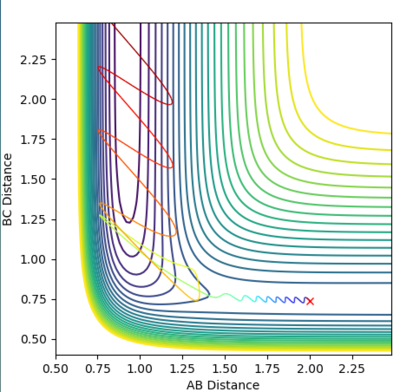
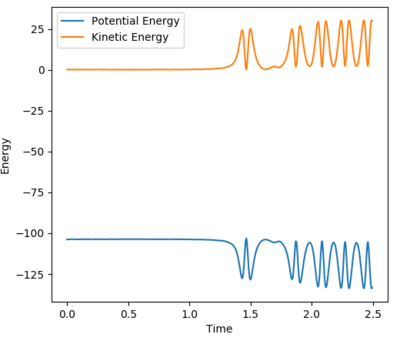
Complete the table by adding a column with the total energy, and another column reporting if the trajectory is reactive or unreactive. For each set of initial conditions, provide a plot of the trajectory and a small description for what happens along the trajectory.
when setting: r1=0.74 and r2= 2.0
table 1. Energy tabel and trajectories with various initial monenta
Question 5: Transition state theory
State what are the main assumptions of Transition State Theory. Given the results you have obtained, how will Transition State Theory predictions for reaction rate values compare with experimental values?
My answer:
The main assumption of transition state theory [1] are give as:
1. The reactants (or products) are in equilibrium with the activated complex.
2. Quantum-tunneling effects are negligible and the Born-Oppenheimer approximation is invoked.
3. Once the system attains the transition state, with a velocity towards the product configuration, it will not reenter the initial state region again.
According to the assumptions, the transition state prediction for rate of reaction should be slower than the experimental value. It can be rationalized by the following two reasons:
1. As stated in the second assumption above. Transition State Theory predictions ignores quantum tunneling effects and treat them as noreactive, where in reality particles with energies lower than the activation energy could react by tunneling through the activation energy barrier.
2. The third assumption can be interpreted that the reaction trajectory are only allowed to cross the transition state once. However, the calculated reaction trajectory for last initial condition in question 4 shows that the reaction trajectory could cross the transition states multiple times and eventually reach the product side. This reactive condition is also ignored by the transition state prediction.
Ng611 (talk) 13:41, 8 June 2018 (BST) A good explanation. It's also important to keep in mind that tunneling accelerates the real reaction compared to TS theory's predictions, while TS recrossing slows the real rate relative to TS theory. However, even for light systems, TS recrossing is a far more significant effect, and so the result is an overall overestimation in the rate.
The study F-H-H system
Question 6: energetic of the reactions
Classify the F + H2 and H + HF reactions according to their energetics (endothermic or exothermic). How does this relate to the bond strength of the chemical species involved?
My answer:
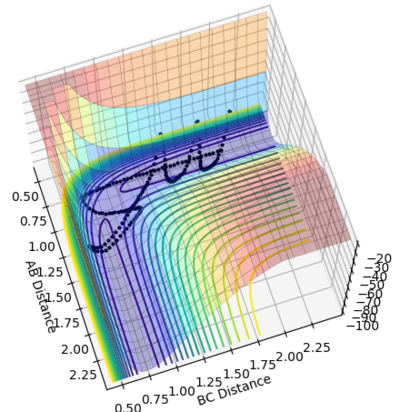
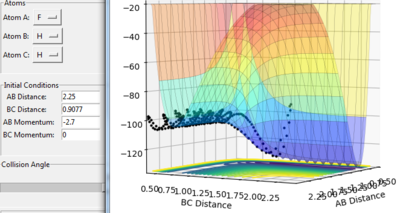
Figure 7 and figure 8 shows the potential surface of a F + H2 reaction and a H + HF reaction respectively.
Figure 7. Potential surface of Yu_HHF_condition.PNG reaction
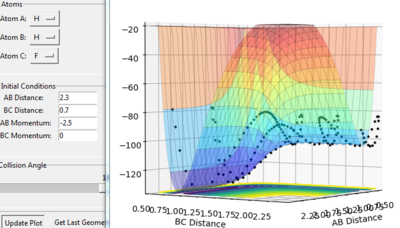
In this condition the F atom is approaching the H2 molecule with the momentum showing in the figure 12. The F + H2 has a higher potential energy then HF+H. This shows that the reaction: F + H2 ---> HF + H is exothermic. This result indicates that H-F which is formed is bond is stronger than the H-H which is broken.
Figure 8. Potential surface of H + HF reaction
In this condition the H atom is approaching the HF molecule with the momentum showing in the figure 13. The H + HF has a lower potential energy then H2 + F. This shows that the reaction: H + HF ---> H2 + F is endothermic. This result agrees with the previous result that H-H which is formed is bond is weaker than the H-F which is broken.
Question 7: Transition states
Locate the approximate position of the transition state.
My answer: Hammond's postulate [2] states that the transition state of a reaction resembles either the reactants or the products, to whichever it is closer in energy.
The first reaction: F + H2 = HF + H is exothermic. Hence, the transition state is closer in energy to the reactants: F + H2 and it adopts the following asymmetric geometry:
F------H--H
•H-H bond is only slightly elongated
•F atom is much further away
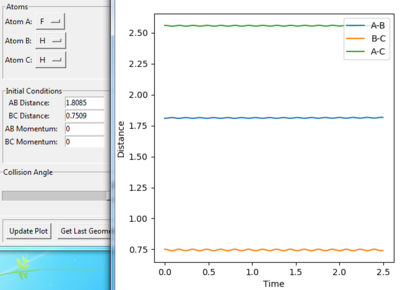
Figure 9 Distance vs time plot for the transition state of F + H2 = HF + H
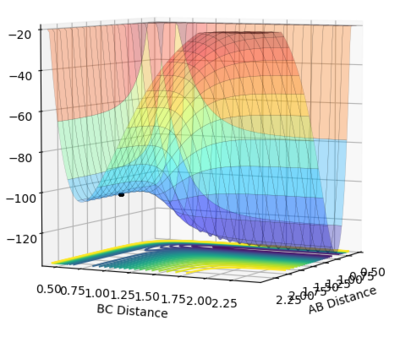
Figure 10 Surface plot for the transition state of F + H2 = HF + H
This is known as an early transition state. The method used to find this transition state is similar to the one used for H-H-H transition state. The H-H (BC) distance can be interpreted to be around 0.74 Å which is a typical H-H bond length. As shown in figure the transition state is at F-H=1.8085 Å and H-H=0.7509. Figure shows that the point is a stationary point and it lies closely to the reactants.
The second reaction: H + HF= H2 + F is endothermic. Hence, the transition state is closer in energy to the products: F + H2 and it adopts the following asymmetric geometry:
H--H-------F
•H-F bond is largely elongated
•H-H bond is almost formed
Figure 11 Distance vs time plot for the transition state of H + HF= H2 + F
Figure 12 Surface plot for the transition state of H + HF= H2 + F
This is known as a late transition state. The H-H (AB) distance can be interpreted to be around 0.74 Å. As shown in figure the transition state is at H-H=0.7495 Å and H-H=1.8080. Figure shows that the point is a stationary point and it lies closely to the products.
Question 8: Activation energy
Report the activation energy for both reactions.
My answer:
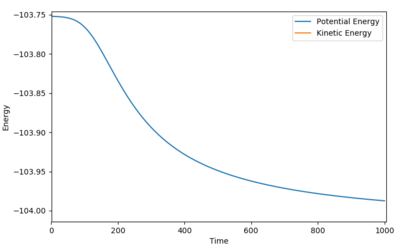
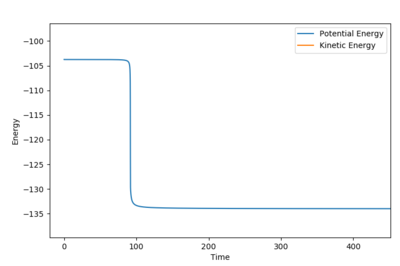
Activation energy is the energy between the reactant and the transition state. If the initial condition is set to be slightly displaced from the transition state and closer to the reactant position, the trajectory will end in the reactant condition. The energy vs time graph would start as a plateau which resembles the energy of the transition state and drops and finally reaches a plateau with resembles the energy of the reactant. The energy difference between the two plateau would give the activation energy of the reaction.
For F + H2 ---> HF + H:
Ng611 (talk) 13:43, 8 June 2018 (BST) There's a slight residual gradient at the end of your simulation, which means you've underestimated the activation energy somewhat. It's probably not significant but you should comment on it.
Figure 13 Activation energy for F + H2 ---> HF + H
| Energy of the transition state(kJ/mol) | Energy of the transition state(kJ/mol) | Activation energy(kJ/mol) |
| -103.752 | -103.987 | 0.235 |
Table 2 Activation energy for F + H2 ---> HF + H
For H + HF= H2 + F:
Figure 14 Activation energy for H + HF= H2 + F
| Energy of the transition state(kJ/mol) | Energy of the transition state(kJ/mol) | Activation energy(kJ/mol) |
| -103.694 | -133.827 | 30.133 |
Table 3 Activation energy for H + HF= H2 + F
Question 9: the reaction trajectory
In light of the fact that energy is conserved, discuss the mechanism of release of the reaction energy. How could this be confirmed experimentally?
My answer:
The following initial condition was set:
Figure 15. Contour plot for visualizing the reaction trajectory
Figure 16. Energy vs time plot for the reaction with above initial condition
Figure 17. Momentum vs time plot for the reaction with above initial condition
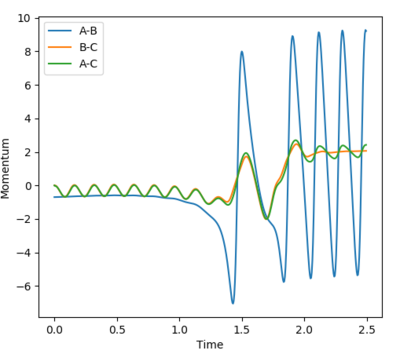
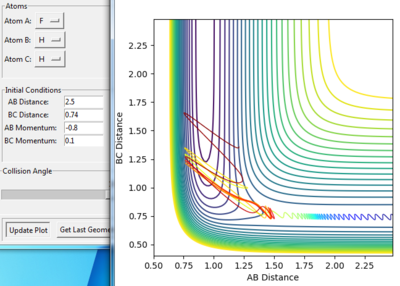
The reaction is exothermic. The reaction energy are converted to kinetic energy and specifically vibrational energy of the newly formed H-F bond in this case. As shown on the contour plot, the oscillation along AB (HF in this case) distance axis is significantly larger than the oscillation along BC (HH in this case) distance. This can be confirmed by the energy versus time plot (figure 16) as it shows a constant conversion between kinetic and potential energy. The momentum versus time plot (figure 17) also show a vibration pattern for AB after the reaction and the amplitude is much larger than that of BC before the reaction.
The course of reaction can be studied by the flow method. The reaction mixture that traveled further down in reaction tube were left reacted for a longer time. Hence, the reaction mixture furthest away from the point of mixing resembles the product and the mixture at the point of mixing resemble the reactants, between these two points are the intermediates.
Carrying out IR spectroscopy measurement the points allows the study of the vibration of chemical bonds. As said above, the reaction is exothermic and allows higher vibrational energy levels to become populated. Therefore, besides the original Vn=0 to Vn=1 transition, hot band transitions such as transition from Vn=1 to Vn=2 become possible. This gives rise to overtone signals in the spectrum. Overtones peaks are lower in energy and intensity when compared to the absorption peak representing Vn=0 to Vn=1 transition. The more vibrational energy levels populated the more overtone bands can be observed. Hence the spectrum of the product would have more overtone signals compared to the reactant.
Ng611 (talk) 13:45, 8 June 2018 (BST) Good explanation and good proposal!
Question 10: efficiency of the reaction
Discuss how the distribution of energy between different modes (translation and vibration) affect the efficiency of the reaction, and how this is influenced by the position of the transition state.
My answer: As the higher translational and vibrational energy level occupied by the molecule the higher the efficiency of the reaction in general. However, that is not always the case. More detailed discussion can be achieved by quoting the Polanyi's rule[3]:
The Polanyi's Empirical Rules states that translational energy is more efficient at promoting early transition state reactions, while vibrational energy is more efficient at promoting late transition state energy reactions.
We can look at specific examples of the reactions:
1.For a early transition state reaction: F + H2 ----> HF + H
Figure 18. the contour plot for a early transition state reaction: F + H2 ----> HF + H
As shown in the figure 18 above the reaction trajectory is reactive. The H2 is vibrating with a small amplitude. The translation energy which can be roughly interpreted by PHF is large. The effect varying vibrational energy by varing PH2 value between -3 and 3 has a small impact. This agrees with the first part rules stated above.
2.For a late transition state reaction: H + HF ----> H2+ F
Figure 19. the contour plot for a late transition state reaction: H + HF ----> H2+ F
A reactive trajectory is show as the figure above in figure 19. The H-F bond oscillates with a large amplitude this corresponds to the fact that the vibrational energy is more efficient in promoting this reaction. A much higher AB momentum is needed if BC vibration is set small, and will often cause the trajectory to bounce back resulting in a nonreactive condition.
Ng611 (talk) 13:47, 8 June 2018 (BST) Some very good examples and overall a very good report. Take care with your discussion and explanations, as some of them (for example, your discussion of the TS) were a little hard to follow. Besides this, a very good piece of work. Well done.
Reference
1. T. Bligaard, J.K. Nørskov, Heterogeneous Catalysis in Chemical Bonding at Surfaces and Interfaces, 2008
2. 1 J. Clayden, N. Greeves, S. Warren and P. Wothers, Organic Chemistry, 2001, vol. 40.
3. Z. Zhang, Y. Zhou, D. H. Zhang, G. Czakó and J. M. Bowman, J. Phys. Chem. Lett., 2012, 3, 3416–3419.

