Rep:Y3C MgO:hjt14
Introduction
From transition state to molecular dynamic simulation, computation chemistry allows us to explore the impossible in the experiment and provides an alternative way to understand a reaction or a material which nicely compliment the practical approach taken by the experimentalist. This computational lab aims to demonstrate the strength of computation chemistry by predicting the thermal expansion coefficient of magnesium oxide, MgO using two different theoretical approaches. The computed results were then compared and contrasted with experiment results.
The system under study is magnesium oxide, MgO. It is a white, ionic, crystalline solid and it has a rock salt crystal structure, i.e. the magnesium ions sit at the lattice point of a face-centered cubic unit cell and the oxide ions sit at all the octahedral holes in the unit cell[1]. There are several ways to represent the repeating unit of MgO crystal structure. The aforementioned face-centered cubic unit cell is one way, and other ways included primitive cell and super cell. Different unit cell representation will have different lattice parameters and the lattice parameters can be interconverted using trigonometric rules.
Thermal expansion of a material, , is defined as follow:
= thermal expansion coefficient
= initial lattice volume
= lattice volume
= temperature
= pressure
To obtain , two theoretical approaches, namely quasi-harmonic approximation, and molecular dynamics were used to construct the graph of MgO volume as a function of temperature.
Quasi-Harmonic Approximation [2]
Affected by thermal energy, the ions in a lattice is not static and move about an equilibrium position. In our study, an anharmonic potential- Buckingham potential, was employed to model the interactions. However, we assumed that the displacement of an ion from equilibrium position is small. As a result, we can model the interactions between ions using a quadratic function and this is what known as the harmonic approximation. By summing up all the interaction energy between ions, we will obtain the lattice energy for the system under study. The summation of lattice energy and the zero-point energy of all the phonon states will give us the internal energy. Internal energy alone is not enough to describe the thermodynamic state of a system, what we need is the free energy. In the system where the volume is held constant, we will use the Helmholtz free energy. To calculate the free energy, a second component- entropy, is required. To do so, vibration energy level of the system, which is quantised, need to be obtained and this can be achieved by computing phonon dispersion and then derived the density of state as a function of energy. The occupancy of these phonon states will then determine the entropy of the system. Entropy together with internal energy will then allow us to compute the free energy of a system, and the following shows the expression for the Helmholtz free energy:
= Helmholtz free energy
= lattice energy of MgO
= wavevector of phonon
= label for branch
= h bar (a constant)
= vibrational frequency of phonon ()
= Boltzmann constant
= temperature
What is characteristic of this quadratic potential well is that the excited state and ground state have the same equilibrium position and the bonds between atoms will not break. For these reasons, this model is not particularly useful to study thermal expansion because this model does not predict thermal expansion. To account for the change in equilibrium position when the ions get excited to higher vibrational state, extra steps were taken, i.e. the lattice parameter was allowed to change at a fixed temperature and the one which gave minima in free energy was identified as the optimal lattice parameter for that particular temperature.
Molecular Dynamics [2]
In this approach, the interactions between ions were modeled using Buckingham potential, however, no harmonic approximation was made and quantisation of vibrational state was not considered. After specifying the initial conditions, all the pair forces in the system will be calculated using the negative derivative of the potential surface with respect to the displacement of the ion. By using newton third law, the forces will be used to update the velocity and also the position of the ions. The system will continue to evolve within a number of timesteps. Within that timesteps, the energy and temperature will eventually converge to a constant.
Discussion
Quais-Harmonic Approximation
Lattice Energy of MgO Crystal
In the first part of this lab, the lattice energy was calculated for a primitive unit cell of MgO using General Utility Lattice Program (GULP) and the results are reported as follow:
  Components of energy:

--------------------------------------------------------------------------------
  Interatomic potentials     =           6.72119980 eV
  Monopole - monopole (real) =          -5.11592628 eV
  Monopole - monopole (recip)=         -42.68059111 eV
  Monopole - monopole (total)=         -47.79651739 eV
--------------------------------------------------------------------------------
  Total lattice energy       =         -41.07531759 eV
--------------------------------------------------------------------------------
  Total lattice energy       =           -3963.1403 kJ/(mole unit cells)
--------------------------------------------------------------------------------
The potential that was used to model the interaction was Buckingham potential. What the computational chemistry software did was to compute the lattice energy by summing up all the interaction energy between every pair of ions. The literature values are 3795 kJ/mol (total lattice potential energies)[3] and 3791 kJ/mol (Born–Fajans–Haber cycle)[3]. The discrepancy between our data with total lattice potential energies is probably because different potentials were used in modeling the interaction between ions.
Phonon Dispersion of MgO
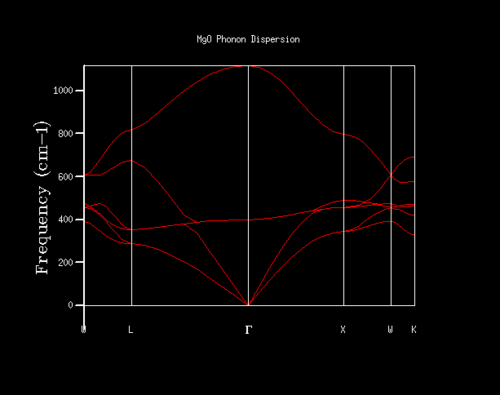
Again, using a primitive unit cell of MgO, the phonon dispersion was computed using GULP along a series of special k points, namely W, L, G, W, X, K. The computed phonon dispersion and the k values are shown below:
| Graph | k value |
|---|---|
 |
W: 1/2 1/4 3/4 |
| L: 1/2 1/2 1/2 | |
| G: 0 0 0 | |
| X: 1/2 0 1/2 | |
| K: 3/8 3/8 3/4 |
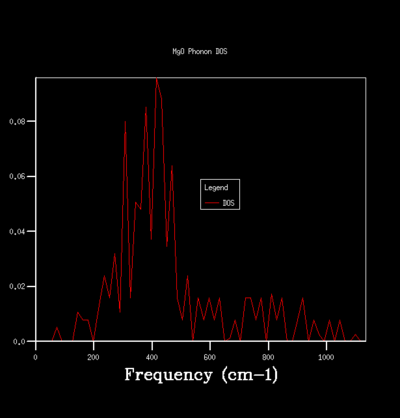
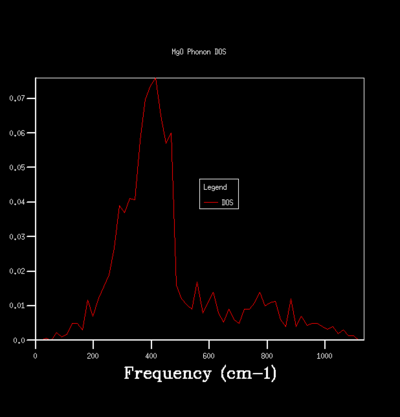
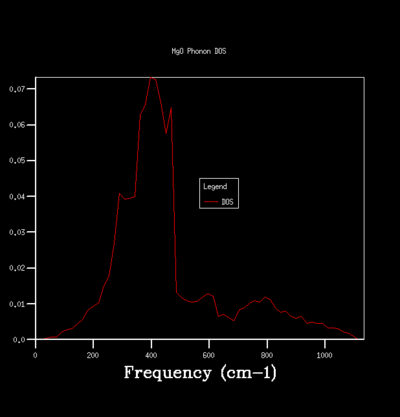
By sampling the energy states on dispersion curve at different k points, one can construct a graph of the number of sampled energy state as a function of energy or frequency and this is equivalent to the density of state of phonon vibration (DOS). The DOS graph is crucial for zero point energy and entropy calculation. To determine the optimal number of sampling one should perform in constructing a DOS, one can do so qualitatively by computing DOS of different grid size and see how the general profile of the DOS change with grid size. The grid size determines the number of sampling done along the k points, the larger the grid size, the more k points are being sampled and the more accurate the DOS is going to be. Beyond the optimal grid size, the DOS profile will remain relatively unchanged. The followings summerise the DOSs computed for a primitive unit cell of MgO using different grid size:
| Grid Size/ Shrinking Factor | 1x1x1 | 5x5x5 | 10x10x10 |
|---|---|---|---|
| Graph | 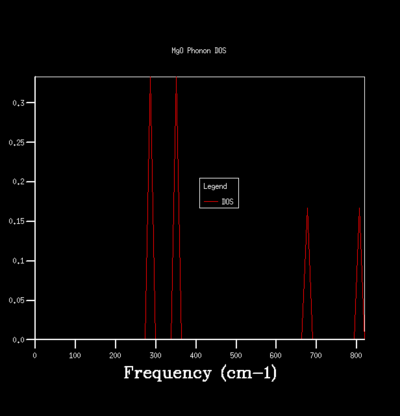 |
 |
 |
| Grid Size/ Shrinking Factor | 15x15x15 | 20x20x20 | 25x25x25 |
| Graph | 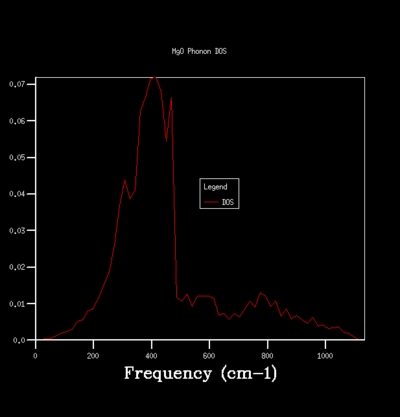 |
 |
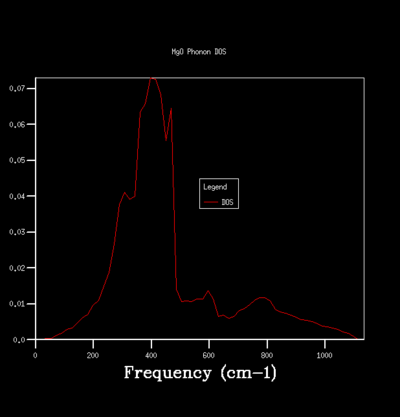 |
For the grid size of 1x1x1, only one k point was sampled. Consequently, the DOS graph showed a group of sharp peaks and each corresponds to a phonon state at that k point. By comparing the number of peaks and the frequency of the peaks with the phonon dispersion, the k point was identified to be 1/2 1/2 1/2. By increasing the grid size, more phonon states are being sampled. As a result, the number of the peak in DOS increases and some will merge together and causes broadening of the peak. It can be seen from the table that below the grid size 15x15x15, the DOS plot changes significantly with grid size. Among the changes is the merging of the peaks at 400 cm-1 to form one broad peak. For grid size beyond 15x15x15, the DOS plot remains relatively unchanged. This observation suggests that any grid size beyond 15x15x15 is suitable for free energy calculation.
The optimal grid size used in the construction of DOS depends on the material. If a material has very similar crystal structure to MgO, its DOS plot can be approximate using the MgO optimal grid size. For example, calcium oxide (CaO) has the same crystal structure as MgO and about the same lattice parameter as MgO, we can approximate the optimal grid size for CaO using the optimal grid size determined for MgO.
| Conventional unit cell lattice parameter | |
|---|---|
| MgO [1] | CaO [4] |
| NaCl structure; 0.42127 nm | NaCl structure; 0.481059(9) nm |
This is due to the fact that CaO and MgO have very similar phonon dispersion. Therefore using MgO optimal grid size in the construction of CaO DOS will yield a CaO DOS with the same resolution as that of MgO. For systems with different crystal structure such as Faujasite and lithium metal, a different optimal grid is needed to construct DOSs of these systems, as the phonon dispersion of these systems will be different from the that of MgO. In fact, a smaller grid size can be used in Faujasite and also lithium metal to achieve the same DOS resolution as that of MgO. Faujasite is a zeolite with a very complex structure and its formula unit is (Nax,Cay,Mgz)3.5[Al7Si17O48].32H2O (x,y,z=1-2)[5]. To describe Faujasite using a unit cell, the number of atoms one must includes is at least the number of atoms appear in the formula unit of Faujasite, which is 86 atoms (excluding water molecules). Increasing the number of atoms included in a unit cell will increase the number of branches in phonon dispersion and this is equivalent to folding the phonon dispersion graph for every increase in the number of atoms. Consequently, even with grid size lower than the optimal grid size used for MgO, we can still sample enough Faujasite phonon states to achieve the same resolution as that of MgO. In the case of lithium metal, the optimal grid size will be smaller because of the narrow phonon dispersion. MgO is an ionic solid and the vibration of the ions strongly couple with their ionic neighbors. The structure of lithium metal can be described as metal cations embedded in the sea of delocalised electrons. The sea of electron screens the cation from each other and result in weak vibrational coupling and hence a narrow lithium phonon dispersion. As the phonon states of lithium spread across a relatively narrow range, it is enough to construct the DOS of lithium with grid size smaller than the optimal grid size of MgO to achieve the same resolution as that of MgO.
Free Energy Using Harmonic Approximation
Determining the optimal grid size to use in free energy calculation can be done qualitatively by looking at how the DOS vary with grid size, however, this approach is very subjective. To be more quantitative, one can determine the optimal grid size by looking at how the Helmholtz free energy changes with grid size as shown below:

The free energy increases significantly with grid size and then reaches the plateau at 5x5x5 and then converges to -40.926483 eV per mole of primitive unit cells at 20x20x20. Choosing an optimal grid size is a balancing act because using grid size that is too large will result in long computer calculation time and using grid size that is too small will give a large error in free energy. The free energy reaches the plateau at 5x5x5, hence grid size beyond 5x5x5 is acceptable depending on the level of accuracy one is after. All the calculations did in the following part of this lab used 20x20x20 grid size as it is the first point where the free energy converge to a constant. The following table summarises the optimal grid size which can be used for different levels of accuracy:
| Level of Accuracy | Optimal Grid Size |
|---|---|
| -40.926 ± 0.001 eV | 2x2x2 |
| -40.9265 ± 0.0005 eV | 2x2x2 |
| -40.9265 ± 0.0001 eV | 3x3x3 |
Thermal Expansion of MgO
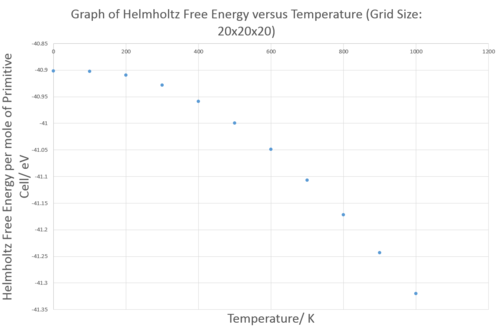
The first three sections demonstrated how the Helmholtz free energy was calculated using GULP and in this section the relationship between Helmholtz free energy and volume will be used to plot a graph of volume as a function of temperature. As mentioned in the introduction, simple harmonic approximation does not predict thermal expansion as the equilibrium position of the system does not change with excitation. To predict thermal expansion, geometrical optimisation needs to be carried out. Helmholtz free energy is a function of temperature and volume. For the system under study, we fixed the temperature, hence to minimise the Helmholtz free energy at a particular temperature, the volume of the system must change and this is why the thermal expansion was observed even though harmonic approximation was used in computing the free energy. Because of these extra steps, this method is known as Quasi-Harmonic approximation. Using this method, the Helmholtz free energy and volume of a primitive unit cell of MgO were computed as a function of temperature and the results are shown below:
As the temperature increases, the free energy of MgO decreases and the lattice parameter of primitive cell of MgO increases. In other words, the MgO crystal expands with temperature and this causes the free energy to decrease. The pressure of the system was fixed at 0 Pascal, therefore the decrease in free energy is due to the positive change in entropy and not the work done against external pressure. The change in entropy is positive because by increasing the unit cell volume we make the system more disorder as there are more ways to arrange the ions in space.
The gradient in both graphs is relatively small at low temperature. Beyond 200 K, the magnitude of both gradients increase significantly and stay constant to give an almost straight line graph. The gradient of volume graph is connected to the expansion coefficient by the following equation:
To calculate the thermal expansion coefficient, a linear fit was used to obtain the gradient of volume data points collected beyond 300K (See Graph 5). The gradient was then multiplied with to yield ; is primitive cell volume at 300K. The was then compared with literature value (average of a series of data point measured from 300K to 1000K). The result is shown below:
| Thermal Expansion Coefficient, /K -1 | |
|---|---|
| Quasi-Harmonic Prediction | Experimental Result |
| 2.812797 x 10⁻⁵ | 3.99 x 10⁻⁵ [6] |
Albeit the simplification in the potential surface used, the result obtained is in the right order of magnitude as literature value. The discrepancy between computed value and experimental value is due to the fact that the free energy contribution of the anharmonicity of potential surface was neglected.[7]
Molecular Dynamics Simulation
To allow for comparison between two theoretical approaches, the volume of MgO as a function of temperature was computed using molecular dynamic and the results are shown below:

There are three interesting features in Graph 5. Within the temperature range under study, the volume of MgO computed using molecular dynamics approach is always lower than volume computed using quasi-harmonic approximation. Furthermore, molecular dynamics predicted a straight line and quasi-harmonic approximation predicted a curve line. Lastly, the difference in results obtained using different approaches decreases as the temperature increases. These observations can be attributed to the different treatment of the potential surface in different approaches. In a molecular dynamic simulation, the vibrational states are not quantised but are treated as a continuous band and there is no zero point energy in each phonon mode. In quasi-harmonic approach, quantisation of energy level and zero point energy are taken into account. In the situation where the volume of MgO at low temperature was computed using quasi-harmonic approximation, the internal energy plays the dominating role in determining the volume of the system as the entropy contribution is small. Having this zero point energy gave MgO studied using quasi-harmonic approach a 'head start in volume' over MgO computed using molecular dynamics. This explains why volume of MgO computed using quasi-harmonic approach at low temperature is significantly greater than that computed using molecular dynamics approach. To explain the curve trend obtained using quasi-harmonic approach and also the decreasing differences between two plot, again, we have to revisit the idea of quantisation of vibrational energy state. At low temperature, , the thermal energy is too low to excite the system to higher vibrational state. Consequently, the entropy contribution is close to zero at low temperature and only contribute significant when . Therefore it is important to include quantisation of vibrational energy state into our model to give a more accurate result. In fact, the curve trend obtained at low temperature in quasi harmonic approach also appears in experimental result making quasi harmonic approximation a more realistic approach at low temperature [8][9]. At high temperature, the quantisation of vibrational energy states become irrelevant because . Relative to the thermal energy, the energy difference of consecutive energy level is very small, making the energy states look more like a band than discrete energy level. For this reason, the volume of MgO computed using quasi-harmonic method approaches the volume of MgO computed using molecular dynamic which the energy states are continuous. When the temperature goes beyond the melting point of MgO, MgO computed using MD will undergo a sharp increase in volume which is characteristic of phase transition. Phase transition happens because the potential surface in MD is anharmonic and bonds between ions are allowed to break. However, in quasi harmonic approximation, sharp change in volume will not be observed as the potential surface is quadratic and bonds between ions will never break.
To put thing into perspective, all the computed thermal expansion coefficient and also experimental result (average of a series of data point measured from 300K to 1000K) are summarised as follow:
| Thermal Expansion Coefficient, /K-1 | ||
|---|---|---|
| Quasi-Harmonic Approximation | Molecular Dynamics | Experimental Result |
| 2.812797 x 10⁻⁵ | 3.073744 x 10⁻⁵ | 3.99 x 10⁻⁵ [6] |
Again, the thermal expansion coefficient computed using molecular dynamics simulation is in the correct order of magnitude and is closer to the literature value than that computed using quasi harmonic approximation. The discrepancy between literature value and MD simulated data is believed to arise from the fact that the energy levels were treated as a continuous band (Not the anharmonicity free energy contribution as anharmonicity in potential surface had already been taken into account).
Conclusion
In conclusion, the thermal expansion coefficient, , obtained from quasi harmonic approach and also molecular dynamics are in close agreement with literature value for temperature ranging from 300K to 1000K. Albeit the limitation at low temperature in our case, computation chemistry is indeed a very powerful tool as it allow us to approximate properties of material. The ability to predict and approximate material properties is important in guiding the direction of material synthesis. Instead of trial and error, one can attempt to synthesis of just a few materials with desirable properties predicted by computation chemistry. The relevance of the prediction to reality rely heavily on how well the theory used fits the reality and also the approximation invoked. This lab demonstrated exactly this; at low temperature, quantisation of energy level becomes important and needs to be taken account, making molecular dynamics simulation a relatively poor model to study the thermal properties of MgO. However, at high temperature, quantisation of energy level becomes irrelevant and both methods gave very similar results. The takeaway is one should not blindly follow a particular computation method but understand the approximation and see whether the approximation is compatible the reaction condition in order to obtain meaningful results.
References
- ↑ 1.0 1.1 MgO Crystal Structure, http://materials.springer.com/isp/crystallographic/docs/sd_0561181 (access date: 8th March 2017)
- ↑ 2.0 2.1 G. Mallia, Introduction to the Computational Laboratory, http://www.ch.ic.ac.uk/harrison/Teaching/Thermal_Expansion/Introduction.pdf
- ↑ 3.0 3.1 W. M. Haynes, ed., CRC Handbook of Chemistry and Physics, 97th Edition (Internet Version 2017), CRC Press/Taylor & Francis, Boca Raton, FL.
- ↑ CaO Crystal Structure, http://materials.springer.com/isp/crystallographic/docs/sd_1400207 (access date: 8th March 2017)
- ↑ Faujasite Subgroup, https://www.mindat.org/min-35126.html (access date: 8th March 2017)
- ↑ 6.0 6.1 O. L. Anderson and K. Zou, J. Phys. Chem. Ref. Data, 1990, 19, 69–83.
- ↑ Z. Wu and R. M. Wentzcovitch, 2006, arXiv:cond-mat/0606745v1
- ↑ M. A. Durand, Physics., 1936, 7, 297.
- ↑ D. K. Smith and H. R. Leider, J. Appl. Crystallogr., 1968, 1, 246–249.


