Rep:WM1415MgO
This is William Micou's report on the 3rd year computational MgO experiment, starting Monday 27/11/2017
Introduction
Thermal Expansion
Thermal expansion is an important property of materials to consider in engineering. Demonstrative examples include rails and bridges, which are specifically designed to expand and contract with temperature. The thermal expansion coefficient, , can be used to calculate thermodynamic properties of crystals, such as entropy[1]. It measures the fractional change in volume as temperature varies (at constant pressure):
In this experiment, the thermal expansion coefficient of the fcc crystal of MgO (or periclase[2]), will be determined using computational methods. Two models will be investigated and compared: the quasi-harmonic approximation (QHA), and molecular dynamics (MD) calculations. As one of the components of the Earth's mantle, studies of periclase are important to better understand seismic velocities at the Earth's interior[2]. Since a wide range of studies have been performed on the thermal expansion of MgO, this is a useful exercise to appreciate the level of the approximations used in these calculations and to explore the theory of vibrations in crystals.
Vibrational band theory
In order to calculate thermodynamic properties for the MgO lattice, the vibrational band structure must be calculated. The electronic band structure of metals is based on very similar theory: it is simplest to consider the vibrations within a crystal as a series of H 1s wavefunctions[3], with their phases arranged in accordance with the vibrational mode of interest. The interactions between these wavefunctions gives rise to the continuous series of vibrational energy levels - a band. A linear combination of these orbitals yields the Bloch function[3]:
The lattice parameter is given by a. The wavevector k is given by . As the value of k increases, the wavelength of the vibration decreases and hence the energy of vibration increases. The First Brillouin Zone (FBZ) is comprised of all the unique values of k: it is delimited by the region in k space given by [3]. The lattice vibration modes exhibit wave-particle duality: phonons are the particle associated with a lattice vibration at a particular frequency. In the 1D case, the frequency associated with a particular value of k is given by:
The density of states (DOS) is a useful construct to appreciate the number of energy levels associated with a particular frequency. It is defined by[3]:
The Quasi-Harmonic Approximation
In order to calculate thermodynamic properties, the phonon modes over the First Brillouin Zone (FBZ) must be known[4]. In this experiment, a grid of k-points under the shrinking factor 32 was used to sample the phonon modes of the MgO crystal. Under the harmonic approximation, 3M (M - number of atoms in the cell) harmonic oscillators are associated with every point in k-space in the FBZ, with energies[4]:
Due to the symmetry of the crystal lattice, the vibrational canonical partition function can be explicitly calculated[4]:
Explicitly evaluating the vibrational partition function allows for the calculation of the temperature dependence of entropy, and internal energy, from statistical mechanics relations[4,5]. However, under the harmonic approximation, the thermodynamics of the system are calculated independently of volume: as a result, zero thermal expansion is predicted[4], among other properties which cannot be modelled at this simple level[6,7].
To calculate the thermal expansion a dependence of phonon frequency on on volume [4] is introduced to the free energy. This is the basis of the Quasi-Harmonic Approximation (QHA)[4]:
is the internal energy of the crystal at 0 K, with zero vibrational contribution[4] and is the zero point energy contribution of the phonons: . To probe the temperature dependence of the volume, , the geometry of the MgO crystal is optimised by minimising the free energy, , at constant T[4].
Molecular Dynamics
The molecular dynamics method is a purely classical model. The physical properties of MgO are estimated by numerical integration of Newtonian equations of motion[8]. The algorithm used in this experiment, lifted directly from the lab script:
- Generate an ideal lattice of MgO, with individual atoms having random velocities assigned by the Boltzmann distribution
- Compute the forces on the atoms
- Compute the accelerations from Newton's Law
- Update the velocities:
- Update the positions of the atoms:
MD calculations are typically executed on a supercell of a crystal lattice; that is, a large cell containing many MgO units. The larger the supercell, the better the representation of the collective motion of the lattice - the phonons[9].
Methodology
Input calculation files were constructed in DLVisualize and were executed using GULP (General Utility Lattice Program) version 1.4.43 (last modified March 2003). All calculations were run under an ionic potential, excluding shells. Non-Coulombic interatomic interactions were modelled with Buckingham potentials. Long-range interactions were accounted for by Ewald summation.
Phonon Dispersion and DOS
A single-point phonon dispersion calculation was run on a primitive cell of MgO. The phonon eigenvectors were calculated at 50 points along the W-L-G-X-W-K direction in k-space. To calculate the DOS, a grid of points in k-space were chosen to sample the possible vibrations: the number of points in the grid depends on the shrinking factors chosen in the experiment.
Thermal Expansion in QHA
From temperatures 0-2900 K (in steps of 100 K), an optimisation of the free energy was computed on a primitive cell of MgO, keeping T constant and allowing the volume to vary. A shrinking factor of 32 (to give a grid size 32x32x32) was used to calculate the phonons, as this was deemed sufficient to obtain a satisfactory approximation of the free energy (further detailed later in the report).
Thermal Expansion in MD
From temperatures 100-3000K (in steps of 100 K), a single-point MD calculation was performed on a supercell of MgO, containing 32 MgO units, in the NPT ensemble. This allowed for the volume to vary while keeping the temperature constant. Time intervals were chosen to be 1.0 fs. The system was allowed to equilibrate for 500 steps; the volumes of the next 500 steps were recorded and averaged.
Results and Discussion
Phonon Modes
MgO Experiment
How does the DOS related to the dispersion curves?
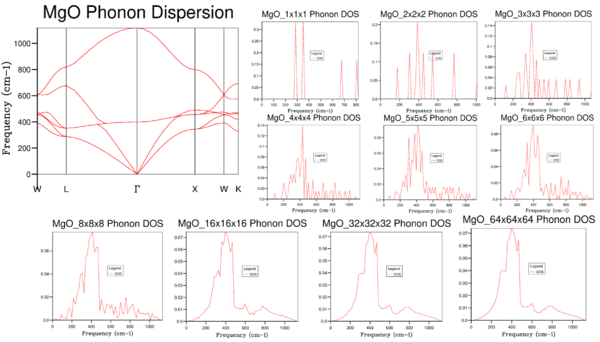
Figure 1 shows the phonon dispersion of MgO, calculated at 50 points along the conventional path in k-space: W-L-G-X-W-K, as well as the density of states calculated for a selection of shrinking factors. The density of states represents the number of states available to the system at a particular frequency (energy)[3]. The exact density of states is obtained by integration of the dispersion curve across the Brillouin Zone:
Since analytical integration is computationally costly, the DOS is instead approximated via a numerical integration: a finite grid of points in k-space is chosen. At each point, the phonons are calculated and weighted (by the inverse of the total number of grid points). It is worth noting that not all points in the grid are evaluated, as some are related by symmetry and hence are identical.
Which k-point was computed in the DOS 1x1x1 grid calculation?
For a 1x1x1 grid, only ony point in k-space is sampled: this corresponds to the point L on the phonon dispersion curve shown in Figure 1 (coordinates in k-space: [0.5, 0.5, 0.5]). Four distinct peaks are obtained at 286, 351, 676 and 806 cm-1: these agree with the intersections of the phonon dispersion curve with the vertical line at L. The intensities of the peaks at 281 and 351 cm-1 are exactly double the intensities of the other two peaks, as there are doubly degenerate states at these frequencies (it can be seen that the dispersion curve splits up into two lines).
How does the density of states vary with grid size? What grid size is the minimum for a reasonable approximation of the DOS?
As the grid becomes more and more subdivided, more points in k space are sampled for the numerical integration of the phonon dispersion, and the increased number of peaks in the DOS plot begins to approach a continuous function. If the grid were further subdivided into infinitesimally small separations, the analytical integration of the phonon dispersion would be obtained. With an 8x8x8 grid, a reasonable approximation of the DOS is obtained, but there remains a considerable amount of noise, and smaller features of the plot cannot be seen. The resolution continues to improve until the 32x32x32 grid, which is almost identical to the plot obtained from the 64x64x64 grid. However, since the 64x64x64 calculation is so much more intensive, further calculations in this experiment involving MgO will use shrinking factors of 32x32x32.
Extension to other systems
CaO: Ca is in the same group as Mg: one would expect a similar lattice parameter and hence the periodic repeat unit in reciprocal space, a* with , will also be similar. A reasonable approximation of the DOS would require sampling over a similar number of points in k-space, so a 32x32x32 grid would most likely be optimal for CaO as well. A study[4] has confirmed that the shrinking parameters from MgO also led to convergence for CaO.
Zeolites: The periodic repeat dimension in real space, lattice parameter a for zeolites is much larger than for MgO. Therefore, the repeat unit in reciprocal space a* would be much smaller: the first Brillouin zone would span a smaller range of k-values. One would expect a greater extent of 'folding'[3] in the branch structure for a zeolite. Hence, a single k point would sample many more frequencies in a zeolite compared to MgO. Therefore, in total, fewer k-points would need to be sampled in order to obtain an approximation for the DOS plot, and a smaller grid size could be used.
Metals (e.g. Lithium): The lattice parameter for a metal such as lithium is expected to be much smaller. Therefore, in reciprocal space, the Brillouin zone would span a larger range of k values. A higher number of k-points must be sampled in order to obtain a good representation of the phonon dispersion; hence a larger grid size would be required compared to MgO.
Computing the Free Energy
MgO Experiment
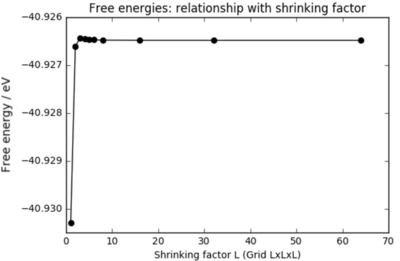
Table 1 shows the calculated free energies in meV obtained from various grid sizes. All significant figures output from the calculation have been included to demonstrate the convergence of the free energy optimisations. A 2x2x2 grid is sufficient to obtain an approximation for the free energy to within 1 meV; 3x3x3 and 4x4x4 grids are sufficient for approximations to within 0.5 and 0.1 meV respectively. This table of data is further evidence that a 32x32x32 grid of k points yields a numerical integration that is sufficiently accurate: there is no distinction between the values from the 32x32x32 and 64x64x64 grids at the level of precision of this experiment. In the next section, when free energies of MgO will be calculated at different temperatures, a shrinking factor of 32 will be chosen (grids 32x32x32).
| Lattice Size | Free Energy (meV) |
|---|---|
| 1x1x1 | -40930.301 |
| 2x2x2 | -40926.609 |
| 3x3x3 | -40926.432 |
| 4x4x4 | -40926.450 |
| 5x5x5 | -40926.463 |
| 6x6x6 | -40926.471 |
| 8x8x8 | -40926.478 |
| 16x16x16 | -40926.482 |
| 32x32x32 | -40926.483 |
| 64x64x64 | -40926.483 |
Extension to other systems
The calculation of the free energy requires the evaulation of the phonons over the FBZ[4]. Therefore, the required grid sizes for CaO, zeolites and metals will be the same as required for an accurate depiction of the DOS. As outlined in the prior section: CaO can use approximately the same grid size as MgO, zeolites a smaller grid size, and metals a larger grid size.
It is worth noting that the increased polarisability[4] of Ca with respect to Mg leads to the breakdown of the QHA at lower temperatures: around 100 K for CaO [4] compared to around 1000 K for MgO[4].
Thermal Expansion of MgO
Quasi-Harmonic Approximation
Free energy and lattice constant relationship with temperature
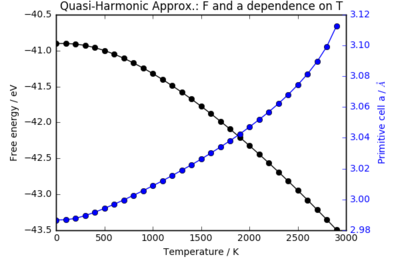
A grid of k-points under the shrinking factor 32 was used to sample the phonon modes of the MgO crystal. An optimisation of the free energy was run at constant temperature, allowing only the volume to minimise F(V,T).
Figure 3 shows how the free energy and lattice parameter of MgO varies with temperature under the QHA model. Below 500 K, there is a non-linear decrease in the free energy as temperature increases. Above 500 K and below the breakdown of the QHA at around 1400 K, there is a linear dependence of the free energy on temperature: however, there is deviation from this straight line at higher temperatures.
The equation for the free energy under the QHA, as outlined in the introduction, can be generalised as:
As higher vibrational levels are populated, the entropy increases as there are more states accessible to the system. Plotting the entropy term of the free energy against temperature, , one finds a linear relationship above the vibrational temperature - the temperature above which excited vibrational states begin to be appreciably populated. The curved region at low temperatures is a manifestation of the quantised, discrete energy levels in the harmonic oscillator model: there is insufficient thermal energy to fully populate the excited, , states. The decrease in free energy with temperature is dominated by the entropy term: the variations in and are comparatively minor (since the volume has a temperature dependence, these terms will also depend on T). At 0 K, the free energy is the sum of the internal energy with zero vibrational contribution and the sum of the zero point energies of all the phonons.
As the temperature approaches the melting point of MgO, how well do the phonon modes represent the actual motions of the ions?
At high temperatures, over 1500 K, there is a deviation away from the linear relationship: the gradients of the plots for both the free energy and the lattice parameter increase. These deviations are more pronounced in the volume-temperature plot, which will be examined in the next section. This is a result of the breakdown of the quasi-harmonic approximation. At such elevated temperatures, the anharmonic terms of the phonons that are ignored in the QHA become increasingly important. The infinite number of equally spaced vibrational energy levels in the harmonic approximation is no longer an accurate picture and the QHA is no longer valid. As the melting point is approached, an anharmonic model would predict bond dissociation: however, no such transition occurs in the QHA. In fact, attempts to run an optimisation calculation at 3000 K did not yield a converged structure within a reasonable time frame. The optimisation of the free energy for such an unrealistic system results in the deviation from linearity at high temperatures.
Computing the coefficient of thermal expansion,
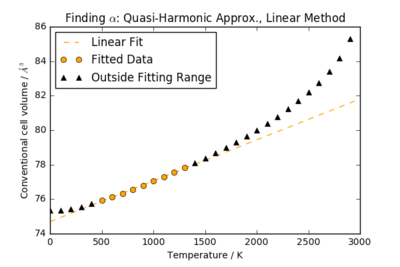
The volumetric thermal expansion coefficient at constant pressure, , expresses the fractional change in volume of MgO as the temperature changes:
For temperatures 500 K < T < 1400 K, the cell volume of MgO is an approximately linear function of T. By performing a linear fit in this restricted region, can be calculated from the gradient, with as the cell volume at 500 K: . It is worth noting that this uncertainty is only a reflection of the quality of the linear fit: the error in the gradient was extracted from the Numpy polyfit() function to calculate the error in .
The main approximations in this calculation are the quasi-harmonic approximation itself - assuming that the phonons exhibit a harmonic potential at all volumes - and the assumption that the thermal expansion coefficient is independent of temperature in the region 500 K < T < 1400 K. Evidently smaller approximations have been made, such as in the methods for evaluating interatomic potentials, the exclusion of shells and the polarisability of the ions, and the assumption that the MgO crystal is perfect - with no defects or impurities. In the literature, some attempts have been made to account for quantum effects[8], polarisability [4], and defects[17]. Later in this report, an attempt will be made to determine the temperature dependence of from the data obtained from the QHA calculations, and the values for the thermal expansion coefficient will be compared to those found from the MD simulations and literature values.
What is the physical origin of thermal expansion?
In a classical sense, thermal expansion is caused by the increased kinetic energy of the atoms within the lattice. As the temperature increases, the atoms vibrate more strongly and there is increased average separation of the atoms, leading to thermal expansion. The origins of thermal expansion within the QHA will now be discussed.
In a diatomic molecule with an exactly harmonic potential, would the bond length increase with temperature? Why does the bond length increase in the solid under the quasi-harmonic approximation?
Under an exactly harmonic potential, the bond length is independent of temperature and will thus remain constant for all T. In the QHA, the phonons follow a harmonic potential at every volume: however, the phonon modes themselves have a volume-dependence. It is the inclusion of this anharmonic effect[10] that results in an increase in the bond length at higher temperatures and hence a thermal expansion is predicted[4,9]. To properly account for anharmonic effects, phonon-phonon interaction coefficients for all modes in the Brillouin Zone would have to be calculated[9]. However, this is not a practical exercise, and the other anharmonic terms are ignored in the QHA. In the literature, attempts have been made to include these higher terms within the approximation, giving rise to the Modified-QHA[17].
Since the pair potentials as a function of interatomic distance are known for our system, the volume-dependence of the phonon modes can be obtained by performing harmonic-lattice-dynamics calculations for a large number of selected volumes[10]. Hence the minimisation of the free energies by varying the volume is made possible, and thermal expansion results.
Molecular Dynamics Simulation
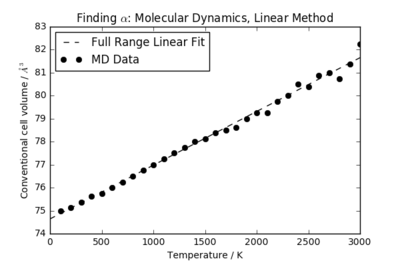

The volume-temperature relationship for the MD calculations is plotted in Figure 5. A comparison between the volume-temperature curves in the MD and QHA models is shown in Figure 6.
Because of the classical nature of the calculation, the volume has a linear relationship with temperature for all T in the molecular dynamics simulation. Since the energy states are continuous rather than discrete, this linear relationship holds for even low temperatures (which do not excite the first vibrational state in the QHA). A linear fit over the full temperature range yields the thermal expansion coefficient . Once again, the uncertainty stated refers only to the error in the gradient of the linear fit calculated in Python. Over the same temperature range as used in the QHA (500 K < T < 1400 K), the MD simulation gives (with the uncertainty in the gradient being negligible).
How large a cell should be used to reliably perform MD for MgO?
In this experiment, 32 MgO units were used in the MD calculations. A prior study of MgO with MD techniques utilised a cell containing 256 MgO units[8]. With larger supercells, the phonons are better represented[9]: this comes at the cost of higher computational effort. The lack of ergodicity[9] limits the numerical efficiency of MD at low temperatures. For the purposes of this experiment, a 32 MgO unit supercell was sufficient. However, for more precise predictions, a larger cell should be used.
How does the thermal expansion predicted by MD compare to that from QHA?
Despite the very different approaches used in each model, the predicted thermal expansion coefficients are in remarkable agreement - at least, in the range where the QHA gives a linear relationship for V(T). In the MD simulation, where V(T) is linear for all T, the calculated thermal expansion coefficient is independent of temperature. Further in this report, the temperature dependence of in the QHA will be examined and compared to reference values.
Why do the two methods produce different answers - and how does the difference depend on temperature? What would happen to the cell volume at high temperature in both models?
Figure 6 shows the MD and QHA V(T) plots line up almost exactly from 500 K < T < 1400 K; the same region where a linear dependence was found in the QHA calculation. The values for the thermal expansion in this region match up almost exactly. At low temperatures, the QHA predicts a slightly larger volume: this is because the zero point energy of the phonons is taken into account; the interatomic spacings cannot be further reduced. The energy spacings for the harmonic oscillator (phonons) are quantised: at low temperatures, the first excited state is only partially accessible. A molecular dynamics calculation was not performed at 0 K since the system would not change from its initial state. At high temperatures, the QHA deviates significantly from the MD calculations as the anharmonicity of the phonons becomes more pronounced, and a deviation from linearity is observed as previously discussed. Near the melting point, such is the breakdown of the QHA that the simulation no longer converges (or at least, not within a reasonable timescale) as the free energy cannot be optimised for T > 3000K. At high temperatures, large fluctuations are seen in the MD calculations: the ions have much higher velocities and move much further in each timestep. It was observed in the animations produced from the trajectories of the MD simulations that, as a result of very high temperature, some quite unusual vibrations were calculated - the atoms move so far in each timestep that this is made possible. Using a smaller timescale and a greater number of equilibration steps may reduce the noise at high temperatures.
By calculating the forces on each individual atom at every step of the calculation, the MD simulation can account for the anharmonicity of the bonds in the lattice, unlike the QHA model.
Comparison with reference data
The thermal expansion coefficient is temperature-dependent. In the literature, is usually reported at a large selection of temperatures. The thermal expansion coefficients calculated so far have assumed a linear relationship between the lattice volume and the temperature. Table 2 gives some reference values for under standard conditions (T = 300 K), collated by Scanavino[2].
The thermal expansion coefficients obtained in this experiment from the linear region of QHA, and MD calculations, are in remarkable agreement with literature values under standard conditions. In the literature[4,17], is sometimes determined via a polynomial fit of the volume-temperature relationship. A similar approach will be attempted for this experiment, under the QHA model.
Polynomial fits for V(T) were calculated using the polyfit() function in Matplotlib. For a fit of degree , the function returns:
To find , the gradient at any point can be explicitly calculated:
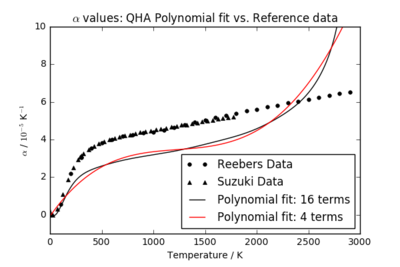
Figure 7 shows the computed values plotted against reference MgO data from Suzuki and Reebers. The polynomial fit with 16 terms is a better match than the 4 term fit to the general shape of the reference data from 0 < T < 1500 K. However, both produce curves which significantly underestimate the thermal expansion coefficient of MgO. Perhaps this is due to the more advanced models used in the literature, such as the MQHA, which account for higher anharmonic terms. The inclusion of shells and atom polarisability in this experiment may have improved the fit compared to the reference data. However, the shape of the function produced by the 16 term fit is similar to the dependencies calculated in the literature. As a further extension, it would be beneficial to repeat this experiment using the more developed models from the literature.
| Source | / |
|---|---|
| Saxena et al.[11] | 3.12 |
| Fei[12] | 3.16 |
| Chopelas[13] | 3.11 |
| Isaak et al.[14] | 3.12 |
| Karki et al. (computational)[15] | 3.11 |
| This experiment - QHA | 3.13 ± 0.06 |
| This experiment - MD | 3.12 ± 0.05 |
| QHA Polynomial Fit | 3.08 ± 0.24 |
Conclusion
In this experiment, the phonon dispersion of MgO was calculated and analysed. For a number of shrinking factors, DOS plots were drawn and optimised free energies were determined in order to select an appropriate level of calculations for further parts of the investigation. The thermal expansion coefficient was determined using a quasi-harmonic approximation and molecular dynamics methods, to within remarkable accuracy of reference values recorded under standard conditions. As an extension, the temperature dependence of the thermal expansion coefficient was evaluated for the QHA simulations: a similar shape was obtained to the QHA fits from literature, but the thermal expansion coefficient was significantly underestimated compared to reference values. A further investigation into the improved models used in the literature could explain this difference.
References
1 O. L. Anderson and K. Zou, J. Phys. Chem. Ref. Data, 1990, 19, 69–83.
2 I. Scanavino, R. Belousov and M. Prencipe, Phys. Chem. Miner., 2012, 39, 649–663.
3 R. Hoffmann, Angew. Chemie-International Ed. English, 1987, 26, 846–878.
4 A. Erba, M. Shahrokhi, R. Moradian and R. Dovesi, J. Chem. Phys., 2015, 142.
5 P. Atkins and J. de Paula, Atkins' Physical Chemistry, Oxford University Press, UK, 8th edn, 2006, pp. 560-600
6 N. W. Ashcroft and N. D. Mermin, Solid State Physics (Saunders College, Philadelphia, USA, 1976).
7 S. Baroni, P. Giannozzi, and E. Isaev, Rev. Mineral. Geochem. 71, 39 (2010).
8 M. Matsui, J. Chem. Phys., 1989, 91, 489.
9 S. Baroni, P. Giannozzi and E. Isaev, Rev. Mineral. Geochemistry, 2009, 71, 1–19.
10 L. L. Boyer, Phys. Rev. Lett., 1979, 42, 584–587.
11 S. Saxena, N. Chatterjee, Y. Fei, G. Shen (1993) Assessment of Data on Some Oxides and Silicates: Calorimetry and High-Pressure Phase Equilibrium Experiments. In: Thermodynamic Data on Oxides and Silicates. Springer, Berlin, Heidelberg
12 Y. Fei, L. Zhang, A. Corgne, H. Watson, A. Ricolleau, Y. Meng and V. Prakapenka, Geophys. Res. Lett., 2007, 34, 1–5.
13 A. Chopelas, Phys. Chem. Miner., 1990, 17, 142–148.
14 D. G. Isaak, O. L. Anderson and T. Goto, Phys. Chem. Miner., 1989, 16, 704–713.
15 B. B. Karki, Am. Mineral., 2000, 85, 1447–1451.
16 I. Suzuki, J. Earth Sci., 1975, 23, 145–159.
17 R. R. Reeber, K. Goessel and K. Wang, Eur. J. Mineral., 1995, 7, 1039–1047.
