Rep:Transition States and Reactivity - SR2815
Introduction
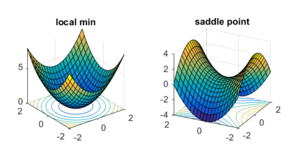
When analysing a potential energy surface, there are 2 main features that are particularly important when it comes to studying a molecule's reactivity: any local minima, which represent resting structures (i.e. reactants and products), and any saddle points, which often link two separate local minima, and thus represent the transition state between the two.
These can be defined mathematically by their gradients and curvatures. In the case of a local minimum, this will have a gradient of 0, and a positive curvature in all directions. However, for a saddle point, this also has a gradient of 0, but instead, has a positive curvature in one direction, and a negative curvature in the perpendicular direction. This therefore gives rise to an overall negative Gaussian curvature, as opposed to local minima, whose Gaussian curvatures are positive.
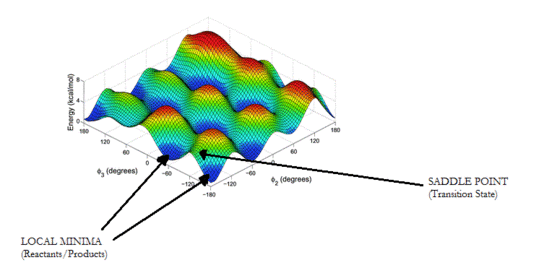
Local minima and saddle points in 3-D can be further differentiated using the partial second derivative test, whereby a 2x2 Hessian matrix consisting of partial second derivatives of a function, f, is formed, and the sign of the determinant indicates what type of critical point is present. A positive determinant is indicative of a minimum or maximum point, and a negative determinant is indicative of a saddle point.
Nf710 (talk) 11:10, 6 March 2018 (UTC) This is correct only in the 2x2 case. In Gaussian we use a 3N-6 potentially energy surface where. we dont looks at the determinant we look at the eigenvalues of the hessian.
Computational methods (e.g. software such as GaussView) have proved extremely useful in analysing potential energy surfaces, as well as the structures of reactants, products, and indeed, transition states. GaussView works by acting as an interface for Gaussian, a software which performs complex mathematical calculations, specifically solving the Schrödinger equation according to what the user inputs into GaussView. Gaussian does this using various basis sets (usually in the form of a linear combination of atomic orbitals), which the user can select. These are broken down into categories based on how Schrödinger equation is solved, and these are further broken down into basis sets of various complexities. The higher the basis set, the more accurate the final result will be, but the longer this calculation will take. In this particular experiment, two different basis sets are used: a semi-empirical basis set (PM6), and a density functional theory basis set (B3LYP), the latter of which is more complex, and thus takes longer, but gives more accurate results.
Nf710 (talk) 11:13, 6 March 2018 (UTC) You have some confusion here, PM6 and DFT are levels of theory. PM6 had a built in basis set and you choose the basis set for DFT different basis sets have more/less functions and can better represent the given molecular system.
One particular function of GaussView is that it is able to predict the vibrational frequencies of a given structure. In the case of a transition state, the negative Gaussian curvature gives rise to a negative force constant, k. This is related to vibrational frequency as follows:
Thus, a negative value of k gives rise to an imaginary frequency, represented in GaussView by a negative frequency. Therefore, if a structure returns one negative vibrational frequency, this is indicative that the structure is a transition state.
This particular computational experiment aims to investigate the reactivities and transition structures of various pericyclic reactions, such as Diels-Alder and Cheletropic reactions.
Exercise 1
The first exercise in this experiment was to investigate the Diels-Alder reaction between butadiene and ethylene.
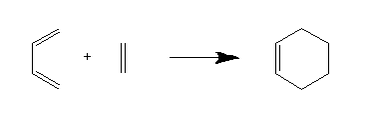
The transition state structure was determined through an initial guess of the transition state, followed by freezing of the two sets of carbon atoms which form C-C bonds during the reaction, optimising the structure to a minimum, then optimising the resulting structure to a transition state (Berny). Both a frequency analysis and an IRC were carried out on said structure.
This reaction is an example of normal demand Diels-Alder, meaning that it is the LUMO of the dienophile (ethylene) that interacts with the HOMO of the diene (butadiene) in the C-C bond forming step.

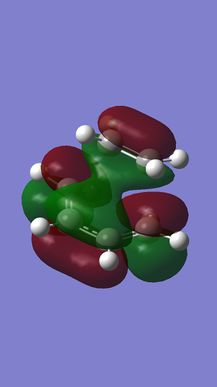
(Fv611 (talk) There is a lot of confusion here. Your MO diagram does not reflected the relative energies of the TS MOs, but it also does not reflect the way atomic orbitals interact. AOs can combine either in a bonding/antibonding fashion OR be non-bonding. I suggest reading up on MO theory.)
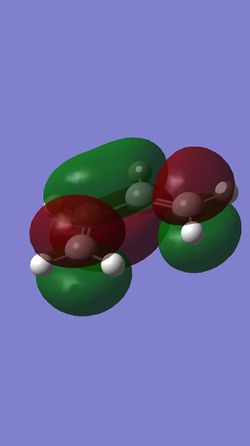
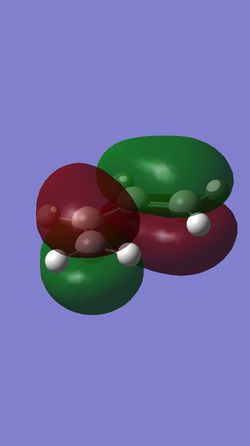
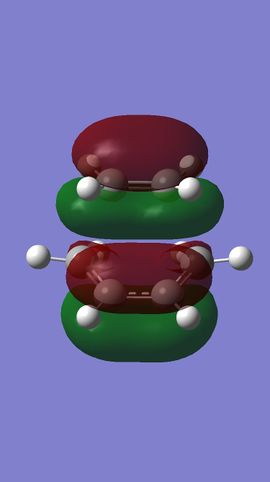
MO analysis shows that the HOMO and LUMO of ethylene are the π and π* MOs, respectively. The HOMO and LUMO of butadiene are the the conjugated combinations of π orbitals, containing 1 and 2 nodes, respectively. It is the antisymmetric LUMO of ethylene and antisymmetric HOMO of butadiene which combine to give the HOMO-1 and LUMO+1 MOs in the final TS, which are bonding and anti-bonding, respectively. The HOMO and LUMO of the TS represent combinations of the symmetric HOMO of ethylene and the symmetric LUMO of butadiene. As can be seen from their MOs (see Figures 7 & 8), these are generally either non or anti-bonding, however, there is a slight secondary bonding interacting in the LUMO (see Figure 13).
What can therefore be concluded about this reaction is that it is only 'allowed' when two MOs of the same symmetry are close enough in energy to interact, since symmetric and antisymmetric MOs will not do so with each other. Furthermore, it is therefore also the case that the orbital overlap for antisymmetric-antisymmetric interactions is greater than 0, for antisymmetric-symmetric interactions is 0, and for symmetric-symmetric reactions, it is perhaps slightly greater than 0, due to the presence of smaller bonding interactions.
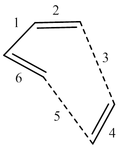
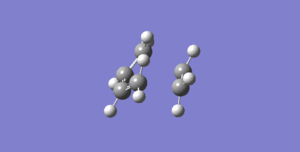
It is also possible to analyse the progression of bond lengths during the reaction. Table 1 shows the the bond lengths in the reactants, transition state, and products, in accordance with Figure 14.
| Bond | Reactants | Transition State | Product |
|---|---|---|---|
| 1 | 1.46835 | 1.41109 | 1.33766 |
| 2 | 1.33530 | 1.37979 | 1.50034 |
| 3 | - | 2.11469 | 1.54003 |
| 4 | 1.32731 | 1.38177 | 1.54076 |
| 5 | - | 2.11479 | 1.54003 |
| 6 | 1.33530 | 1.37977 | 1.50034 |
What is seen is that bonds which started as C=C bonds (2, 4 & 6) increase in length throughout the reaction, due to their reduction in bond order from 2 to 1, and thus elongation of the bond occurs. The opposite is true for bond 1, which starts as a C-C bond, and finishes as C=C, thus becoming shorter during the reaction. Comparing this to standard carbon-carbon bond lengths, we see that bonds in the reactants are generally shorter than the average bond length (e.g. Bonds 2, 4 & 6 < Average sp2-sp2 length = 1.47 Å[3]; Bond 1 < Average sp3-sp2 length = 1.50 Å[3]). However, in the product, bond lengths appear to be a lot closer to average bond lengths (e.g. Bonds 2 & 6 ≈ Average sp3-sp2 length = 1.50 Å[3]; Bonds 3, 4 & 5 ≈ Average sp3-sp3 length = 1.54 Å[3]). For the transition state, bonds 3 & 5 are particularly interesting, as, given that the Van der Waals radius of carbon is 1.70 Å,[4] bond lengths of around 2.11 Å represent the two radii of the carbons atoms overlapping, and thus the two atoms begin to become attracted.
Finally, upon performing a frequency analysis of the transition state, we can assign a vibrational frequency of 948.57i cm-1 (-947.57 cm-1 in GaussView) to the C-C bond forming vibration, since this is the (only) imaginary frequency present (see Figure 15). This animation shows the C-C bond formation to be synchronous, also supported by roughly equal bond lengths (bond 3 & 5) in the transition state (see Table 1).
Appropriate files can be found below:
Optimised butadiene [PM6] - File:Sr2815 BUTADIENE OPT PM6.LOG
Butadiene MOs [PM6] - File:Sr2815 Butadiene opt PM6.chk
Optimised ethylene [PM6] - File:Sr2815 ETHYLENE OPT PM6.LOG
Ethylene MOs [PM6] - File:Sr2815 Ethylene opt PM6.chk
Optimised transition state + frequency analysis [PM6] - File:Sr2815 BUTADIENE ETHYLENE TS OPTFREQ PM6.LOG
Transition state MOs [PM6] - File:Sr2815 Butadiene Ethylene TS OptFreq PM6.chk
Transition state IRC [PM6] - File:Sr2815 BUTADIENE ETHYLENE TS IRC PM6.LOG
Optimised cyclohexene [PM6] - File:Sr2815 CYCLOHEXENE OPT PM6.LOG
Exercise 2
This exercise aimed to investigate a more complex cycloaddition, specifically that of the Diels-Alder reaction between cyclohexadiene and 1,3-dioxole. Not only are the molecules in this example larger, but their structure means that the product has two possible stereochemistries, known as the exo and endo products. Analysis of the transition states involved in the formation of these products might give rise to an explanation as to why one is favoured over the other.
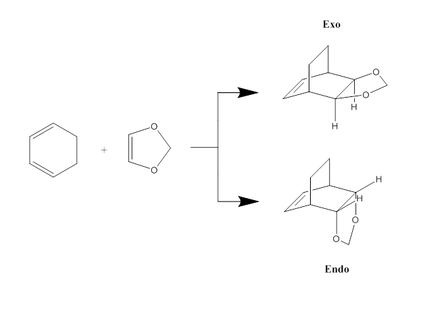
Transition states were determined via the same method as described in exercise 1, although for this example, PM6-optimised structures were re-optimised further at a B3LYP 6-31G(d) level. IRCs were also carried out on both transition states (at a PM6 level due to time constraints, using the PM6-optimised transition states), and frequency analyses were carried out an all reactants, products and transition states.
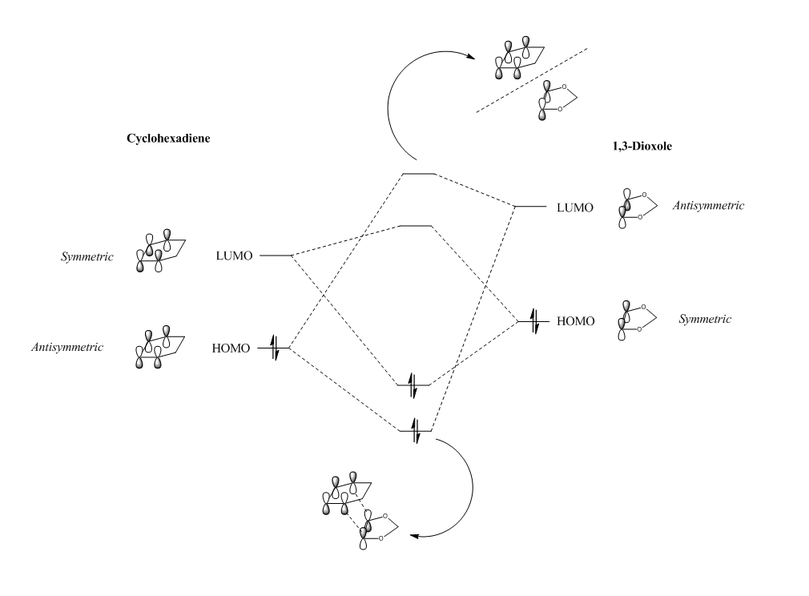

(Fv611 (talk) You haven't paid attention to the relative energies of the TS MOs, and you have not indicated their symmetry.)
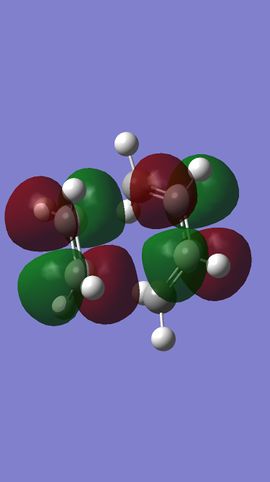
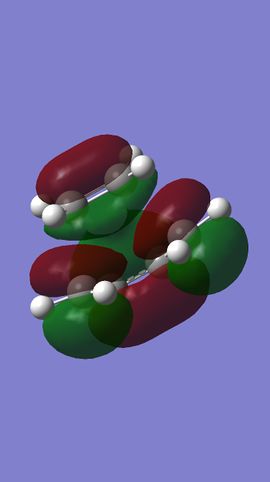
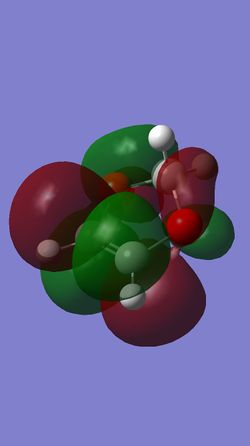
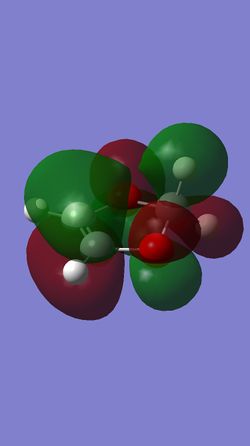
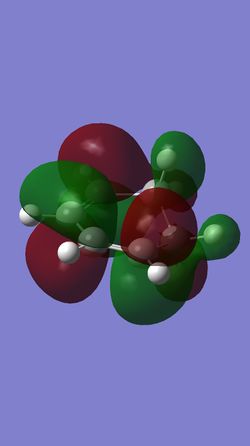
The order of energy levels of the two reactants is slightly different in this example than that seen in exercise 1, however, analysis of MOs shows that this reaction is still a normal demand Diels-Alder reaction, in which the antisymmetric LUMO of the dienophile (1,3-dioxole) interacts with the antisymmetric HOMO of the diene (cyclohexadiene) to give the primary C-C bond forming interaction (HOMO-1 and LUMO+1 orbitals). However, in this example, there is also a clear interaction between the two symmetric orbitals (the LUMO of cyclohexadiene and the HOMO of 1,3-dioxole), which gives rise to the HOMO and LUMO of the transition states, which are largely bonding and anti-bonding, respectively.
Nf710 (talk) 18:18, 6 March 2018 (UTC) This reaction is inverse. You can investigate this quantitatively by looking at the reactant MOs from the IRC with a single point energy calc.
What proves to be more significant, however, are the differences in the MOs between the endo and exo transition states. Specifically, looking at the HOMOs of both TS's, the endo TS has a very clear secondary orbital interaction between the π orbitals of the two oxygen atoms of 1,3-dioxole, and two π orbitals of the conjugated π system in cyclohexadiene (see Figure 21). This interaction undoubtedly stabilises the endo transition state, and since it is not present in the exo transition state, may well lead to preferential formation of the endo product.

This can be further investigated by analysis of the Gibbs free energies of the transition states and products, as tabled below:
| Conformation | Reactants | Transition State | Product | Reaction Barrier | Reaction Energy |
|---|---|---|---|---|---|
| Endo | -1,313,781.868759 | -1,313,622.0571995 | -1,313,849.2732205 | 159.8115595 | -67.4044615 |
| Exo | -1,313,781.868759 | -1,313,614.220082 | -1,313,845.684162 | 167.648677 | -63.815403 |
Therefore, according to the calculations, the endo product proves to be both the kinetically and thermodynamically favoured product. Thermodynamically, this is most likely primarily due to the aforementioned secondary orbital overlap which stabilises the endo product. Kinetically, this is most likely due to possible steric clashes between 1,3-dioxole and the -CH2CH2- group of the cyclohexadiene ring in the exo transition state, which destabilises it more than that of the endo transition state.
Nf710 (talk) 18:21, 6 March 2018 (UTC) You have got mixed up here. Kenetics is due to the TS being stabalised. which is Due to the SOO. This is not present significantly in the product. the sterics lead to it endo being thermodynamically favoured. You have got the energy correct and shown the SOO, but you made a few mistakes in this section.
Appropriate files can be found below:
Optimised cyclohexadiene + frequency analysis [B3LYP 6-31G(d)] - File:Sr2815 CYCLOHEXADIENE OPTFREQ 6-31G.LOG
Cyclohexadiene MOs [B3LYP 6-31G(d)] - File:Sr2815 Cyclohexadiene OptFreq 6-31G.chk
Optimised 1,3-dioxole + frequency analysis [B3LYP 6-31G(d)] - File:Sr2815 DIOXOLE OPTFREQ 6-31G.LOG
1,3-Dioxole MOs [B3LYP 6-31G(d)] - File:Sr2815 Dioxole OptFreq 6-31G.chk
Optimised endo transition state + frequency analysis [B3LYP 6-31G(d)] - File:Sr2815 CYCLOHEXADIENE DIOXOLE ENDO TS OPTFREQ 6-31G.LOG
Endo transition state MOs [B3LYP 6-31G(d)] - File:Sr2815 Cyclohexadiene Dioxole Endo TS OptFreq 6-31G.chk
Endo transition state IRC [PM6] - File:Sr2815 CYCLOHEXADIENE DIOXOLE ENDO TS IRC PM6.LOG
Optimised exo transition state + frequency analysis [B3LYP 6-31G(d)] - File:Sr2815 CYCLOHEXADIENE DIOXOLE EXO TS OPTFREQ 6-31G.LOG
Exo transition state MOs [B3LYP 6-31G(d)] - File:Sr2815 Cyclohexadiene Dioxole Exo TS OptFreq 6-31G.chk
Exo transition state IRC [PM6] - File:Sr2815 CYCLOHEXADIENE DIOXOLE EXO TS IRC PM6.LOG
Optimised endo product + frequency analysis [B3LYP 6-31G(d)] - File:Sr2815 cyclodiox ENDO PRODUCT OPTFREQ 6-31G.LOG
Optimised exo product + frequency analysis [B3LYP 6-31G(d)] - File:Sr2815 cyclodiox EXO PRODUCT OPTFREQ 6-31G.LOG
Exercise 3
This exercise continues to look at Diels-Alder reactions, in addition to another type of pericyclic reaction: a cheletropic reaction. Both reactions are seen between ortho-xylylene and SO2.
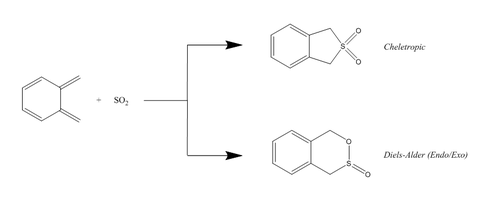
The transition states for this experiment were obtained via constructing the desired product of the reaction, optimising at a PM6 level, deleting the 2 bonds formed during the reaction, separating the reacting atoms by a suitable distance, then continuing as previously described in exercises 1 & 2 (i.e. freezing, optimising etc.). IRCs were carried out on all transition states, as well as frequency analyses on all transition states and products. The results of the IRCs can be seen below:

(Use straight lines between stationary points in the reaction profile Tam10 (talk) 10:57, 6 March 2018 (UTC))
Something that can be seen from Figures 36-38 is how for each pericylic reaction, aromaticity is established in the 6 membered ring. This explains why ortho-xylylene is so unstable, as establishing aromaticity will stabilise the products majorly compared to the reactants, thus driving the reaction forward.
Similar to exercise 2, the Gibbs free energies of the reactants, transition states and products can be tabulated and analysed to work out the reaction barriers and energies for each reaction:
| Reaction | Reactants | Transition State | Products | Reaction Barrier | Reaction energy |
|---|---|---|---|---|---|
| Cheletropic | 154.426659 | 260.087281 | -0.0078765 | 105.660622 | -154.4345355 |
| Diels-Alder (Endo) | 154.426659 | 237.775782 | 56.983852 | 83.349123 | -97.442807 |
| Diels-Alder (Exo) | 154.426659 | 241.7481635 | 56.3301025 | 87.3215045 | -98.0965565 |
What can be seen from this data is that the cheletropic reaction is clearly the thermodynamically favoured reaction, possessing the largest reaction energy. However, it also possesses the largest reaction barrier, and thus it is the two Diels-Alder reactions which prove to be more kinetically favoured. Specifically, considering the two Diels-Alder reactions, the endo reaction is the more thermodynamically favoured reaction, whereas the exo is the more kinetically favoured reaction. This is most likely, once again, due to possible secondary orbital interactions in the endo product while stabilise it compared to the exo product, causing it to be lower in energy. However, for this reaction, there are no major steric clashes in the exo transition state (c.f. exercise 2), and thus the transition state for the exo reaction is lower in energy than that of the endo reaction, which causes it to be kinetically favoured.
In addition, an investigation was carried out to determine whether Diels-Alder reactions could take place at the diene of the 6-membered ring in ortho-xylylene. The following data was obtained:
| Reaction | Reactants | Transition State | Products | Reaction Barrier | Reaction energy |
|---|---|---|---|---|---|
| Diels-Alder (Endo) | 154.426659 | 267.984785 | 172.2564295 | 113.558126 | 17.8297705 |
| Diels-Alder (Exo) | 154.426659 | 275.819277 | 176.711903 | 121.392618 | 22.285244 |
Therefore what can be seen is that, compared to what is seen for the Diels-Alder reactions in Table 3, both the endo and exo reactions here are both kinetically and thermodynamically unfavourable. This is most likely due to the lack or aromaticity in the final product of the reaction, as well as a greater steric influence of the ring.
Appropriate files can be found below:
Optimised xylylene + frequency analysis [PM6] - File:Sr2815 XYLYLENE OPTFREQ PM6.LOG
Optimised SO2 + frequency analysis [PM6] - File:Sr2815 SO2 OPTFREQ PM6.LOG
Optimised cheletropic transition state + frequency analysis [PM6] - File:Sr2815 CHELETROPIC TS OPTFREQ PM6.LOG
Cheletropic transition state IRC [PM6] - File:Sr2815 CHELETROPIC TS IRC PM6.LOG
Optimised endo transition state + frequency analysis [PM6] - File:Sr2815 DA ENDO TS OPTFREQ PM6.LOG
Endo transition state IRC [PM6] - File:Sr2815 DA ENDO TS IRC PM6.LOG
Optimised exo transition state + frequency analysis [PM6] - File:Sr2815 DA EXO TS OPTFREQ PM6.LOG
Exo transition state IRC [PM6] - File:Sr2815 DA EXO TS IRC PM6.LOG
Optimised cheletropic product + frequency analysis [PM6] - File:Sr2815 CHELETROPIC PRODUCT OPTFREQ PM6.LOG
Optimised endo product + frequency analysis [PM6] - File:Sr2815 DA ENDO PRODUCT OPTFREQ PM6.LOG
Optimised exo product + frequency analysis [PM6] - File:Sr2815 DA EXO PRODUCT OPTFREQ PM6.LOG
Optimised disfavoured endo transition state + frequency analysis [PM6] - File:Sr2815 DISFAVOURED DA ENDO TS OPTFREQ PM6.LOG
Optimised disfavoured exo transition state + frequency analysis [PM6] - File:Sr2815 DISFAVOURED DA EXO TS OPTFREQ PM6.LOG
Optimised disfavoured endo product + frequency analysis [PM6] - File:Sr2815 DISFAVOURED DA ENDO PRODUCT OPTFREQ PM6.LOG
Optimised disfavoured exo product + frequency analysis [PM6] - File:Sr2815 DISFAVOURED DA EXO PRODUCT OPTFREQ PM6.LOG
Conclusions
The results of these 3 computational investigations demonstrate the power of computational chemistry. Using software like GaussView, we are able to visualise the structures and orbitals of molecules, which in turn, through consideration of factors such as secondary orbital interactions and sterics, allows us to predict the reactivity of these molecules, on an extremely short timescale.
References
[1]: Arora S., Hardt M., Vishnoi N. Off the Convex Path. Available from: http://www.offconvex.org/2016/03/22/saddlepoints/ [Accessed February 2018]
[2]: Sturdy Y. K., Clary D. C. Torsional anharmonicity in the conformational analysis of tryptamine. Phys. Chem. Chem. Phys. 2007;9:2065-2074. Available from: doi:10.1039/B615660F
[3]: Fox, Marye Anne; Whitesell, James K. Organische Chemie: Grundlagen, Mechanismen, Bioorganische Anwendungen. Springer; 1995. ISBN 978-3-86025-249-9.
[4]: Bondi, A. Van der Waals Volumes and Radii. J. Phys. Chem. 1964;68(3):441-451. Available from: doi:10.1021/j100785a001


