Rep:Title=Mod:rp1912
Optimisation of Ex3
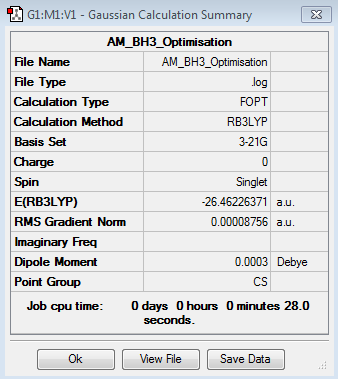
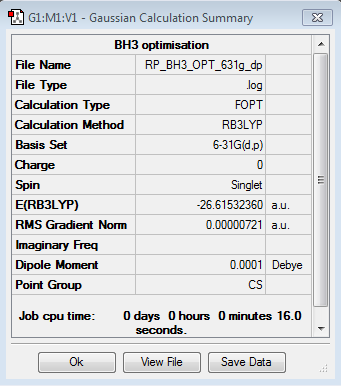
BH3
Optimisation log file here
Optimisation log file here
| summary data | convergence | Jmol | |||
|---|---|---|---|---|---|
|
Item Value Threshold Converged? Maximum Force 0.000012 0.000450 YES RMS Force 0.000008 0.000300 YES Maximum Displacement 0.000064 0.001800 YES RMS Displacement 0.000039 0.001200 YES |
|
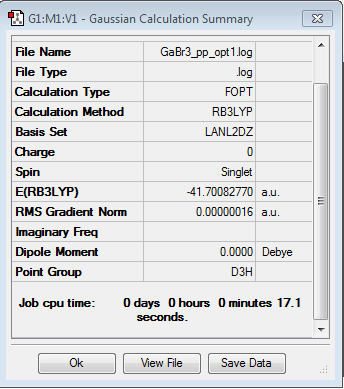
GaBr3
Optimisation log file here
optimisation file: DOI:10042/85146
| summary data | convergence | Jmol | |||
|---|---|---|---|---|---|
|
Item Value Threshold Converged? Maximum Force 0.000000 0.000450 YES RMS Force 0.000000 0.000300 YES Maximum Displacement 0.000003 0.001800 YES RMS Displacement 0.000002 0.001200 YES |
|
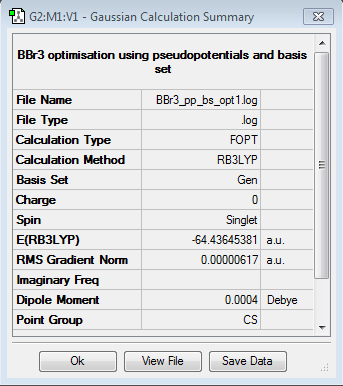
BBr3
Optimisation log file here
optimisation file: DOI:10042/85415
| summary data | convergence | Jmol | |||
|---|---|---|---|---|---|
|
Item Value Threshold Converged? Maximum Force 0.000013 0.000450 YES RMS Force 0.000006 0.000300 YES Maximum Displacement 0.000058 0.001800 YES RMS Displacement 0.000029 0.001200 YES |
|
Comparison of EX3 Geometry
| BH3 | BBr3 | GaBr3 | |
|---|---|---|---|
| r(E-X) | 1.19 Ǎ | 1.93 Ǎ | 2.35 Ǎ |
| θ(X-E-X) | 120.0° | 120.0° | 120.0° |
It can be seen from the Geometry data of BH3 and BBr3 that changing the ligand from H to Br leads to an increase in E-X bond length. There is no change in bond angle from 120.0°as expected for Trigonal planar structures. The difference in bond length can be attributed to the strength of orbital overlap in B-H compared to B-Br. In order for good orbital overlap there must be a match in both orbital size and energy. For example, this means that bonding orbital overlap in BH3 is stronger than bonding orbital overlap in BBr3. This is because Br is larger and heavier. It has larger and more diffused valence orbitals than hydrogen, leading to poor orbital size match with the Boron bonding orbitals. In terms of similarities in orbital energy, the boding orbitals of boron is closer in energy to the 1s bonding orbitals of H than the 4p based orbitals of bromine leading to weaker overlap with bromine. Bromine is also a heavier atom with a larger nucleus than hydrogen and so the equilibrium bond length with boron will be longer due to greater nuclear repulsion. Hydrogen on the other and is very small and so will have a shorter equilibrium bond length with boron due to reduced nuclear repulsion. H and Br both have 1 unpaired electron in their valence orbitals and form Trigonal planar structures with boron to fill their valence orbitals. T It can be seen from the geometry data of BBr3 and GaBr3 that changing the central atom from B to Ga leads to an increase in bond length. As before there is no change in bond angle. This can also be explained in terms of the strength of orbital overlap between the central atom and the Br using an orbital size and energy match analysis as before. The bonding orbitals of bromine is both more similar in size and energy to the boron bonding orbitals than the Gallium bonding orbitals. Also as explained earlier, since Ga is heavier, it's equilibrium bond length with Br will be longer. B and Ga are both group 13 elements with 3 valence electrons.
Strong, Medium and Weak Bonds
A chemical bond is a favorable electrostatic interaction between two or more atoms which results in a stable molecule that is lower in energy than before the formation of the bond.There are many types of interactions that lead to the formation of a chemical bond. Covalent and ionic bonds are strong bonds. Covalent bonds involves sharing of electrons and arise form the electrostatic attraction between the nuclei and electrons through orbital overlap of the bonding orbitals of the atoms forming the bond. There is degree of balance between the attractive and repulsive forces present in the two atoms (at equilibrium distance between them) that results in the formation of the stable molecule. Covalent bonds have energies in the range of hundreds of kJ/mol[1]. Ionic bonds results from the electrostatic attraction between oppositely charged ions where there is a large electronegative difference (>1.7) between the two species. these types of bonds can have energies in the range of thousands of kJ/mol[1].Hydrogen bonds or permanent dipole-dipole interactions arise from electrostatic interactions between hydrogen and electronegative atoms such as oxygen, nitrogen and fluorine. These are medium strength bonds and have an energy in the region of 0-20 kJ/Mol[1]. London dispersion forces/van der waals interactions are weak bonds and have an energy in the region of 0-1 kJ/Mol[1].
The program employed in this study Gaussview does not always recognize all the bonds present in a molecule. This is because it is programmed in a way to only draw chemical bonds if the distance between the two atoms come within a specified range (based on the covalent radii of the atoms for example). This means that weaker interactions such as Van der Waals that exist at longer distances will not be recognized as bonds.
EX3 Frequency and Vibrational spectrum
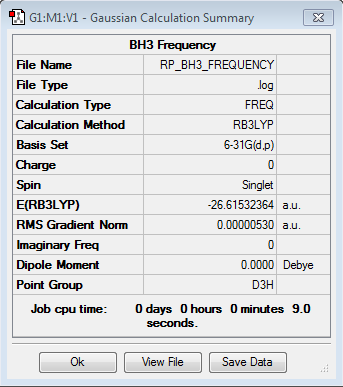
Frequency analysis for BH3
Frequency file: here
| summary data | low modes |
|---|---|
|
Low frequencies --- -14.5183 -14.5142 -10.8197 -0.0005 0.0169 0.3454 Low frequencies --- 1162.9508 1213.1230 1213.1232 |
Vibrational spectrum for BH3
| wavenumber | Intensity | IR active? | type |
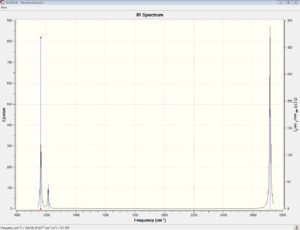
| 1163 | 93 | yes | bend |
| 1213 | 14 | slightly | bend |
| 1213 | 14 | slightly | bend |
| 2583 | 0 | no | stretch |
| 2716 | 126 | Yes | stretch |
| 2716 | 126 | Yes | stretch |
As you can see from the table and the spectra above, there are fewer vibrational peaks on the IR spectrum than there are actual vibrations in the molecule. This is because in order for a vibration to be IR active, there must a change in dipole moment in the molecular vibrations. The lower intensity peaks are only slightly IR active because there isn't a a large change in dipole.
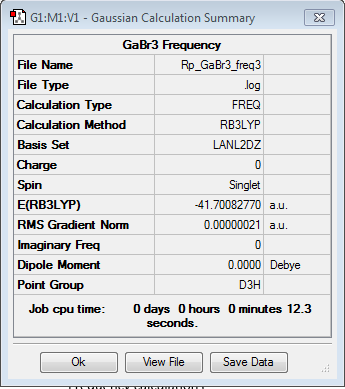
Frequency analysis for GaBr3
Frequency file: here Frequency file: DOI:10042/90638
| summary data | low modes |
|---|---|
|
Low frequencies --- -1.4877 -0.0015 -0.0002 0.0096 0.6540 0.6540 Low frequencies --- 76.3920 76.3924 99.6767 |
Vibrational spectrum for GaBr3
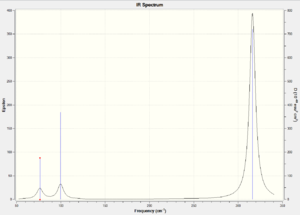
| wavenumber | Intensity | IR active? | type |
| 76 | 3 | very slightly | bend |
| 76 | 3 | very slightly | bend |
| 100 | 9 | very slightly | bend |
| 197 | 0 | no | stretch |
| 316 | 57 | Yes | stretch |
| 316 | 57 | Yes | stretch |
| BH3 | GaBr3 | |
|---|---|---|
| Central atom | 0.16 | 0.89 |
| Ligand | -0.57 | -0.26 |
| Ligand | -0.57 | -0.26 |
| Ligand | -0.57 | -0.26 |
As you can see from the frequency analysis of BH3 and GaBr3 that there is a large difference in the frequencies computed. BH3 frequencies are over 1000 cm-1 larger than the GaBr3 frequencies, indicating that the bonds in GaBr3 are of lower energy than the bonds in BH3, since frequency is directly related to energy. This is consistent with the bond distances calculated earlier, as Ga-Br bond (2.35Ă) was found to be longer than B-H bond (1.19 Ă) indicating weaker bonding in GaBr3 than in BH3. Therefore, the low frequencies obtained for GaBr3 correspond to these bonds that are lower in energy than the B-H bonds in BH3.
There has been a rearrangement of the A2" umbrella motion from mode 1 (lowest energy vibration) in BH3 to mode 3 in GaBr3 . In GaBr3, the A2" umbrella motion is no longer the lowest energy vibration. The reason for this can be see from the displacement vectors of the umbrella motion of BH3 and GaBr3 shown above. The larger z coordinate displacement by -0.57 of each of the lighter hydrogen ligands in the BH3 shows the ease at which they are undergoing the vibrational motion compared to the heavier central boron atom which is only displaced by 0.16 in the z coordinate. This can be compared to the displacement vectors of the Ga and Br atoms in GaBr3. Since the central Ga atom is now lighter than the Br ligand, the displacements seen can be justified where the Ga is being displaced (by 0.89) in the Z coordinate and the Br ligands are only being displaced by -0.26. The greater displacement of the ligands in the umbrella motion leads to a lower frequency (lower energy) vibration in the overall lighter BH3. The greater displacement of the central atom leads (in the overall heavier GaBr3) leads to a higher frequency vibration. The relative frequencies of vibrations of the BH3 compared to the GaBr3 can also be explained by looking that the relatives sizes of atoms in BH3 and GaBr3. Ga and Br and much heavier that B and H. This means that overall BH3 will have higher frequency vibrations than GaBr3 since the frequency of vibrations are inversely proportional to the reduced mass of the system. The relative intensities of the vibrations can be explained based on the relative sizes of the dipole moments. BH3 shows higher intensity vibrations than GaBr3 meaning that there is a larger change in dipole in BH3 that leads to more absorption of IR radiation.
The same basis set must be used for both optimization and frequency calculations for each of the molecules so that a direct comparison can be made for the absolute energies of the molecule. Using a more complicated basis set will give you a better energy minima, however if this same basis set is not used for the frequency calculation as used for the optimisation, the frequencies will not correspond to the molecule you optimized using a different basis set.
A frequency analysis was carried out on these structures to confirm that an energy minima was found for the optimised structures. The data obtained from the frequency analysis is the second derivative of the potential energy surface of the system under study. If all of the frequencies obtained using this analysis are positive, this corresponds to the energy minima. If there is a negative frequency obtained then this will correspond to a transition state. However if there are more than one negative values then,this means that optimisation method for employed failed to find the energy minima of the system. The frequency analysis also provides vibrational information of the structure including all 3N-6 vibrational modes and their corresponding frequencies which can be used to generate a theoretical IR spectrum for the molecule. From the frequency analysis, low frequency values were also obtained, these correspond to the motions of the center of mass of the molecule.
EX3 Molecular Orbital Analysis
Molecular Orbital Analysis of BH3
MO analysis file here: DOI:10042/98237
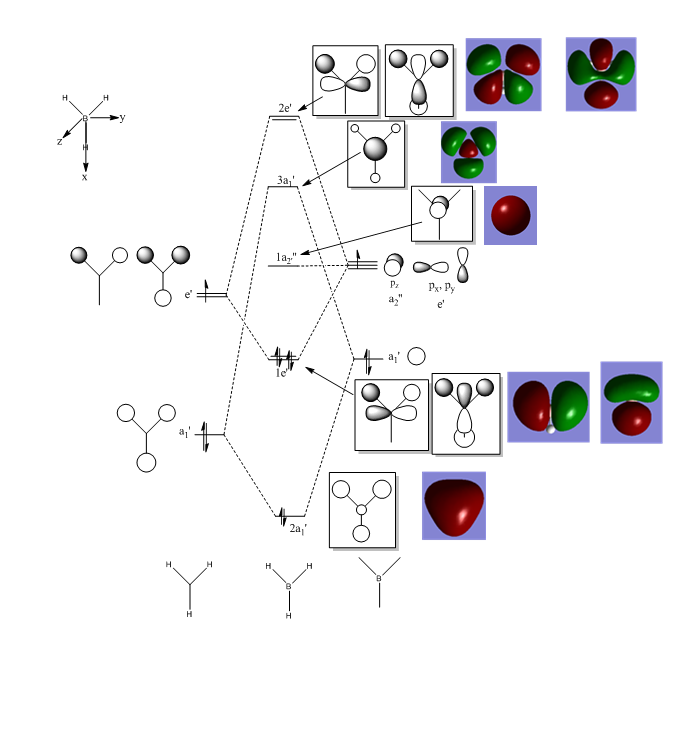
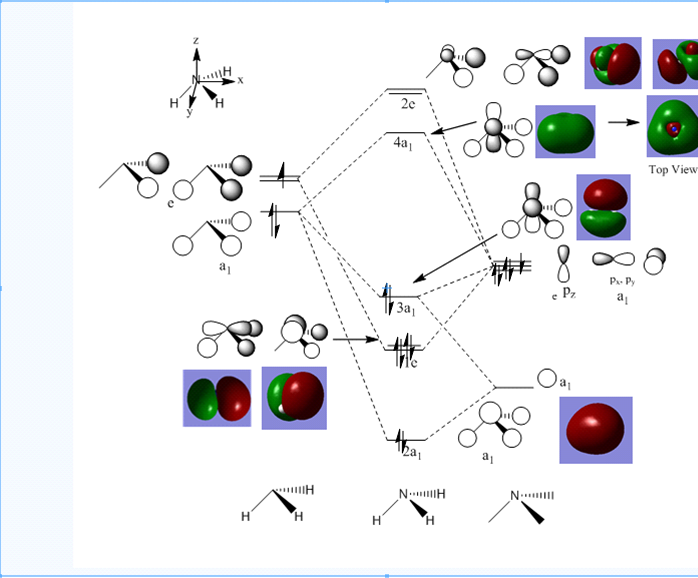
There are no significant differences between the computed MOs and the MOs obtained using the LCAO method. This means that the method employed to obtain MOs using the LCAO method is fairly accurate. The main observed difference between the LCAO and the computed MOs is that for the 3a' antibonding MO, according to the LCAO, the more electropositive boron S orbital is expected to have a larger contribution to this antibonding MO. This is expected because this AO is closer in energy to the 3a' MO and thus should have a larger contribution to this MO. However this is not observed in the computed 3a' MO. This highlights a major advantage in using the LCAO method to understand exactly which orbitals are involved in the interactions that form these MOs, as the computed method gives as the more realistic delocalised versions of the MOs.
NH3 Analysis
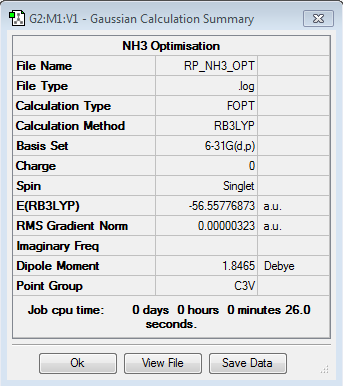
Optimisation of NH3
Optimisation log file here
| summary data | convergence | Jmol | |||
|---|---|---|---|---|---|
|
Item Value Threshold Converged? Maximum Force 0.000006 0.000015 YES RMS Force 0.000004 0.000010 YES Maximum Displacement 0.000012 0.000060 YES RMS Displacement 0.000008 0.000040 YES |
|
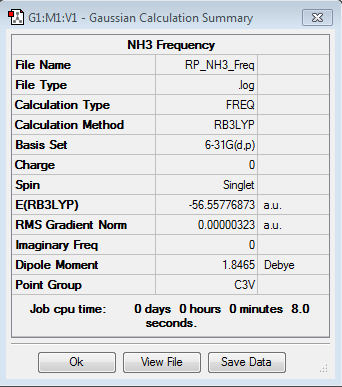
Frequency analysis of NH3
Frequency file: here
| summary data | low modes |
|---|---|
|
Low frequencies --- -0.0130 -0.0022 -0.0017 7.0722 8.1014 8.1017 Low frequencies --- 1089.3849 1693.9369 1693.9369 |
Molecular Analysis of NH3
MO analysis file here: DOI:10042/103970
There are no significant difference between the computed MOs and the MOs obtained using the LCAO method. This means that the method employed to obtain MOs using the LCAO method is accurate. The advantage of using MOs computed this way, is that it gives a more realistic view of the MOs, where the orbitals are very delocalised, whereas in the LCAO, the AOs are drawn in a more localised fashion. However, the LCAO method of drawing the orbitals does allow for a better understanding of the exactly which orbitals are involved in the MOs and thus explain the relative energies of these MOs better.
NBO Analysis of NH3
| Charge Distribution of NH3 | Charge |
|---|---|
|
|
| NBO Charge of NH3 |
|---|
|
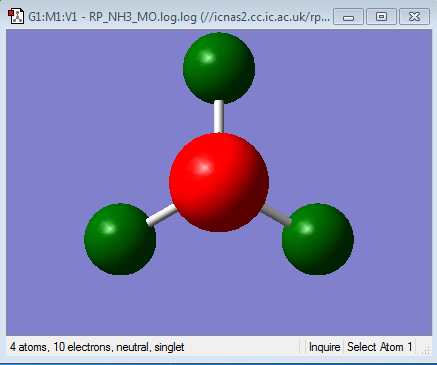
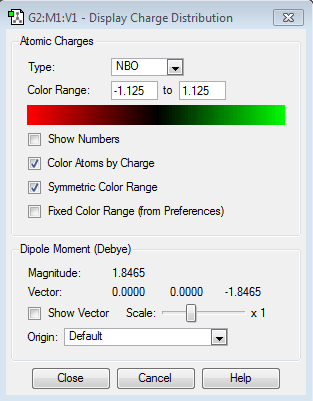
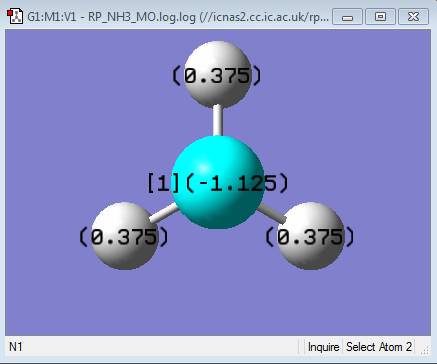
As you can see from the charge distribution, the central N is very negative, expected from a highly electronegative atom attached to electropositive hydrogens.(electronegativity of N = 3.04 and H = 2.20[1])
NH3BH3 Analysis
Optimisation of NH3BH3
Optimisation log file here
| summary data | convergence | Jmol | |||
|---|---|---|---|---|---|
|
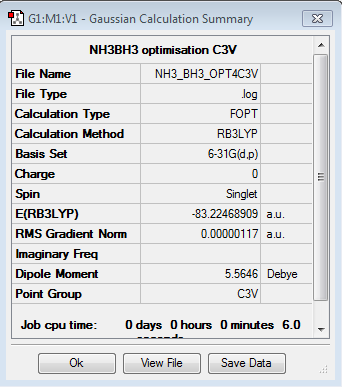
Item Value Threshold Converged? Maximum Force 0.000001 0.000015 YES RMS Force 0.000001 0.000010 YES Maximum Displacement 0.000012 0.000060 YES RMS Displacement 0.000004 0.000040 YES |
|
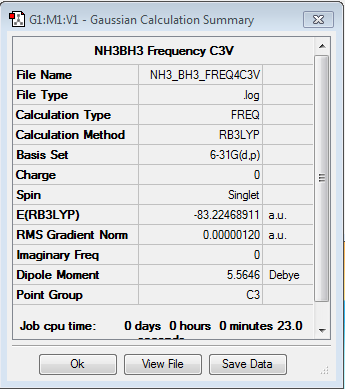
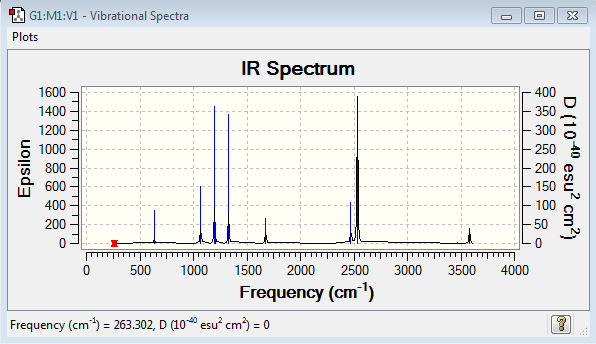
Frequency Analysis of NH3BH3
Frequency file: here
| summary data | low modes |
|---|---|
|
Low frequencies --- -5.1194 -0.2829 -0.0409 -0.0001 1.3216 1.3823 Low frequencies --- 263.3023 632.9615 638.4658 |
| Vibrational spectrum of NH3BH3 |
|---|
|
B-N bond dissociation Energy (ΔE)
| E(BH3) | -26.6153236 AU |
| E(NH3) | -56.5577687 AU |
| E(NH3)E(BH3) | -83.2246891 AU |
Therefore,
ΔE=E(NH3BH3)-[E(NH3)+E(BH3)] = (-83.2246891)-((-26.6153236)+(-56.5577687))
                            = -0.0515968 AU
                            = -135.47 kJmol-1
It can be seen from the energy calculated here (in kJmol-1) and from discussion earlier on relative energies of strong medium and weak bonds that the B-N bond in aminoborane is likely to be a covalent interaction.
Ethane Analysis
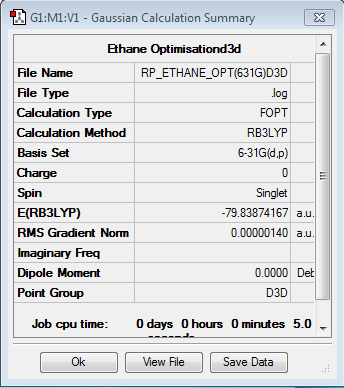
Optimisation of ethane
Optimisation log file here
| summary data | convergence | Jmol | |||
|---|---|---|---|---|---|
|
Item Value Threshold Converged? Maximum Force 0.000002 0.000015 YES RMS Force 0.000001 0.000010 YES Maximum Displacement 0.000007 0.000060 YES RMS Displacement 0.000004 0.000040 YES |
|
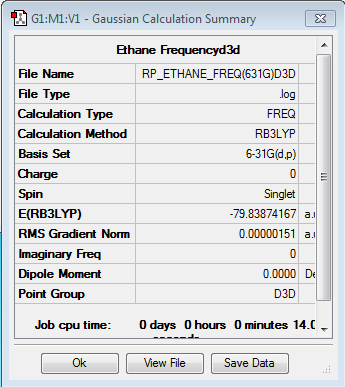
Frequency Analysis of ethane
Frequency file: here
| summary data | low modes |
|---|---|
|
Low frequencies --- -1.3251 -1.3192 -0.0012 -0.0012 -0.0011 6.5722 Low frequencies --- 313.0605 828.0023 828.0023 |
MO analysis
MO analysis file here: DOI:10042/104124
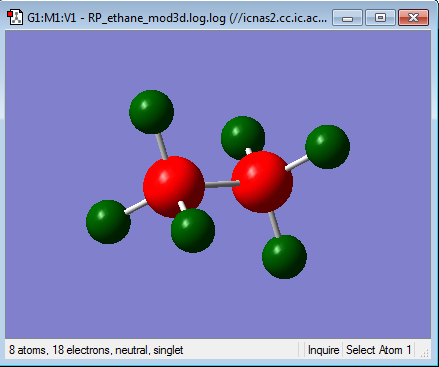
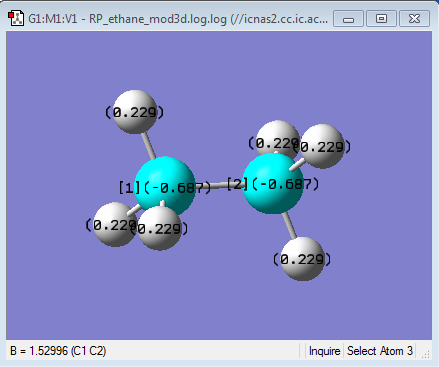
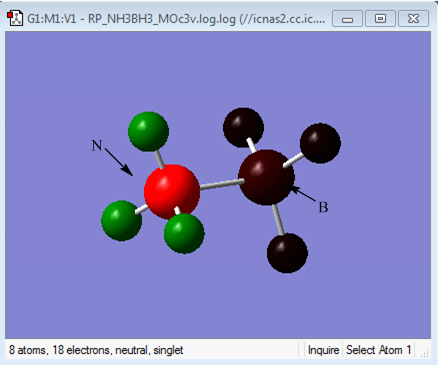
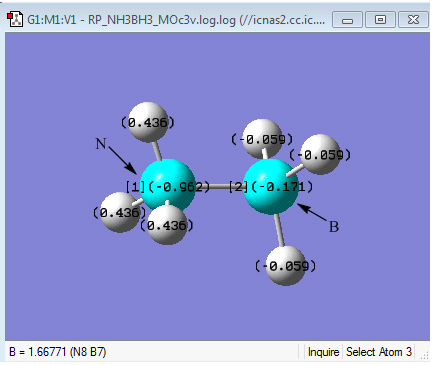
NBO comparison of Ethane and NH3BH3
| Charge Distribution of Ethane | NBO charge |
|---|---|
|
|
| Charge Distribution of NH3BH3 | NBO Charge |
|---|---|
|
|
It can be seen that the NBO charges on the carbon atoms of ethane are both the same. This is as expected because both carbons are in the same environment, meaning that their charges based on their electronegativities are not affected. Both carbons have a negative NBO charge and hydrogen a positive charge. This is because carbon has a pauling electonegativity of 2.55 and hydrogen has a lower electronegativity of 2.2[1], meaning that the δ- is on carbon which is pulling electrons towards itself resulting in a δ+ charge on the hydrogen.
It can be seen above that the NBO charges of N and B in NH3BH3 are different. N has a much more negative charge (-0.962) than B (-0.171). This can be accounted to the larger electronegativity of the N (3.04) compared to B (2.04)[1]. However this does imply that Boron should bear a positive charge as it is attached to a highly electronegative atom. This is not the case as shown. However, a more important observation is that boron does bear a more positive charge than nitrogen, as expected. The slightly negative charge of -0.171 on the boron instead of positive charge indicate that the lone pair of electrons on the nitrogen are being donated into an empty bonding orbital of the boron to form a dative type interaction between B and N. It can be also be seen from the charge distribution diagram above, that the whole of the BH3 species is effectively neutral. This is because both B and H have very similar electronegativities of 2.04 and 2.2 respectively[1]. Furthermore, the NBO analysis (given in the MO analysis log file), found that in the B-N bond, there was an 82% contribution from the N and only an 18% contribution from the B. This suggests that the lone pair on the Nitrogen is being donated to the Boron to form a dative covalent bond. This can also be supported by the dissociation energy of the B-N bond of -135 kJmol-1 calculated earlier. This energy range as discussed earlier corresponds to a covalent type interaction.
Chemical manipulations can be made to control the charges of the Carbon, Nitrogen and Boron by changing the ligands attached to them. For example, the charge on the carbon can be made more positive by changing the ligand from H to a much more electronegative atom such as F. The N-B interaction can also be weakened by changing the ligands on the N from H to more electonegative atom such as Oxygen. This will inductively pull the Nitrogen lone pair that is forming the B-N bond towards the NX3 species weakening the dative B-N interaction.
Ionic Liquids Project
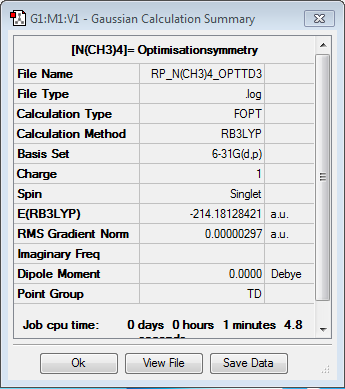
Optimisation for [N(CH3)4]+
Optimisation log file here
optimisation file: DOI:10042/101534
| summary data | convergence | Jmol | |||
|---|---|---|---|---|---|
|
Item Value Threshold Converged? Maximum Force 0.000011 0.000015 YES RMS Force 0.000003 0.000010 YES Maximum Displacement 0.000032 0.000060 YES RMS Displacement 0.000014 0.000040 YES |
|
Frequency analysis for [N(CH3)4]+
Frequency file: here
| summary data | low modes |
|---|---|

|
Low frequencies --- -0.0009 -0.0005 -0.0005 21.3480 21.3480 21.3480 Low frequencies --- 188.5495 292.6677 292.6677 |
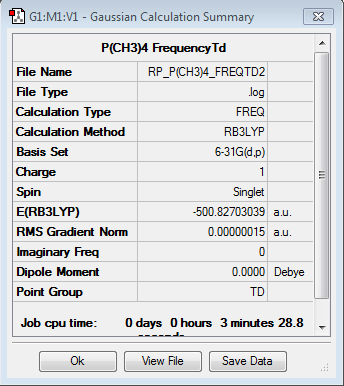
Optimisation for [P(CH3)4]+
Optimisation log file here
| summary data | convergence | Jmol | |||
|---|---|---|---|---|---|

|
Item Value Threshold Converged? Maximum Force 0.000000 0.000015 YES RMS Force 0.000000 0.000010 YES Maximum Displacement 0.000006 0.000060 YES RMS Displacement 0.000002 0.000040 YES |
|
Frequency analysis for [P(CH3)4]+
Frequency file: here
| summary data | low modes |
|---|---|
|
Low frequencies --- 0.0020 0.0029 0.0030 24.7032 24.7032 24.7032 Low frequencies --- 160.0469 194.7857 194.7857 |
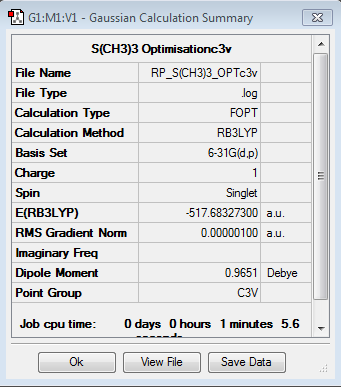
Optimisation for [S(CH3)3]+
Optimisation log file here optimisation file: DOI:10042/104236
| summary data | convergence | Jmol | |||
|---|---|---|---|---|---|
|
Item Value Threshold Converged? Maximum Force 0.000001 0.000015 YES RMS Force 0.000001 0.000010 YES Maximum Displacement 0.000011 0.000060 YES RMS Displacement 0.000005 0.000040 YES |
|
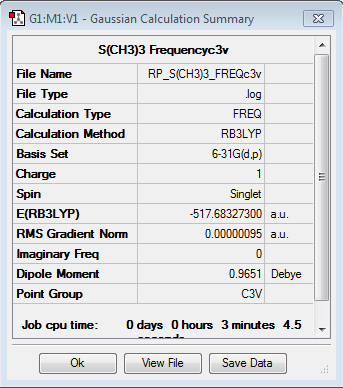
Frequency analysis for [S(CH3)3]+
Frequency file: here
| summary data | low modes |
|---|---|
|
Low frequencies --- -7.8128 -7.6893 -7.6860 -0.0033 -0.0013 0.0092 Low frequencies --- 161.9237 199.6457 199.6457 |
Comparison of 'onium' cation Geometries
| [N(CH3)4]+ | [P(CH3)4]+ | [S(CH3)3]+ | |
|---|---|---|---|
| r(E-C) | 1.51 Ǎ | 1.82 Ǎ | 1.82 Ǎ |
| r(C-H) | 1.09 Ǎ | 1.09 Ǎ | 1.09 Ǎ |
| θ(C-E-C) | 109.5° | 109.5° | 102.7° |
| θ(H-C-H) | 110.1° | 109.0° | 111.1° |
| θ(H-C-E) | 108.9° | 109.9° | 110.6° |
It can be seen that the heteroatom (E)- Carbon bond length in the ammonium cation is the shortest, suggesting that the N-C bond is the strongest when compared to to P-C and S-C bonds. This is due to the better valence orbital overlap of the C and N. This is because C and N are both neighboring 2nd row elements, leading to good orbital size and energy match, essential for good orbital overlap. It can be seen that both P-C and S-C bonds lengths are similar. This is because P and S are both 3rd row elements, meaning that the valence orbital overlap between these elements and the carbon are not as strong, leading to weaker and longer bonds.
The C-E-C bond angles of 109 degrees computed for the ammonium and phosphonium cations arise from sp3 hybridisation of the central N and P heteroatoms leading to Td geometries around them (the hybridization data can be obtained from the natural bond analysis log file given below). The C-E-C bond angle of 102.7 degrees computed for the sulphonium cation is due to the pyramidal structure around the central heteroatom. This geometry can be explained using the VSEPR (valence shell electron repulsion) theory, where the lone pair on the sulfur forces the 3 methyl groups closer together reducing the Td bond angle from 109 to the 103 degrees obtained here.
NBO Charge Analysis
MO file of [N(CH3)4]+ : DOI:10042/110643
MO file of [P(CH3)4]+: DOI:10042/110634
MO file of [S(CH3)3]+: DOI:10042/110638
| [N(CH3)4]+ | [P(CH3)4]+ | [S(CH3)3]+ | |
|---|---|---|---|
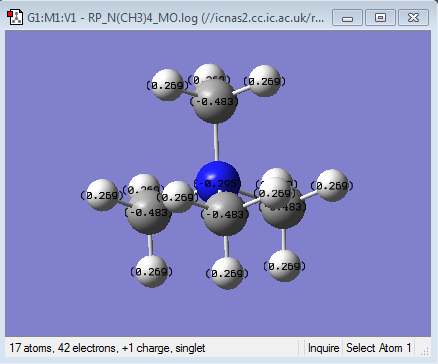
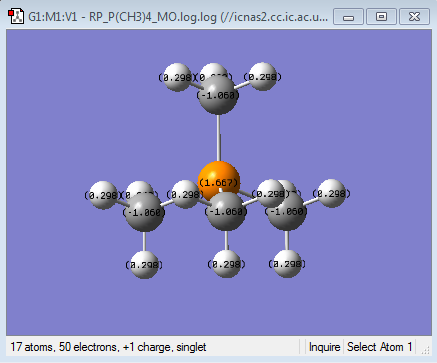
| Heteroatom | -0.295 | 1.667 | 0.917 |
| Carbon | -0.483 | -1.060 | -0.846 |
| Hydrogen | 0.269 | 0.298 | 0.279 |
| [N(CH3)4]+ | [P(CH3)4]+ | [S(CH3)3]+ | |
|---|---|---|---|
| C | 34% | 60% | 49% |
| Heteroatom (E) | 66% | 40% | 51% |
| Electronegativity | |
|---|---|
| c | 2.55 |
| N | 3.04 |
| P | 2.19 |
| S | 2.58 |
| H | 2.20 |
| Charge Distribution of [N(CH3)4]+ | NBO charge |
|---|---|
 
|
|
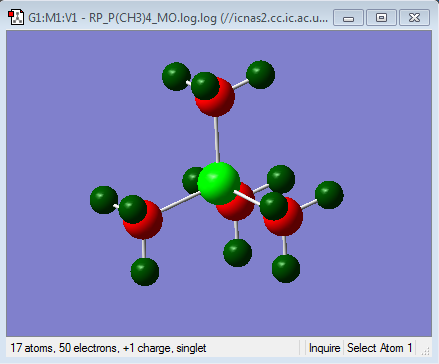
| Charge Distribution of [P(CH3)4]+ | NBO Charge |
|---|---|
|
|
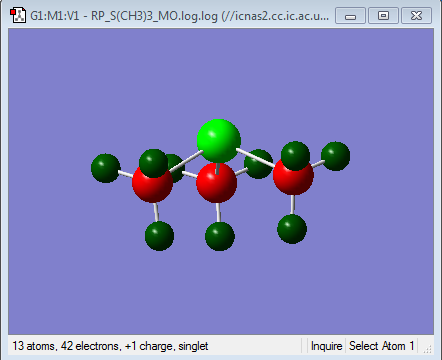
| Charge Distribution of [S(CH3)3]+ | NBO Charge |
|---|---|
|

|
Natural bonding Orbitals (NBO) are localised electron pair orbitals for bonding and lone pair of electrons[2][3]. It corresponds to the Lewis structure form of the molecule under study, as it partitions the electron density of the whole molecule from delocalised MOs into localised atomic like orbitals and so NBOs can be used to explain the familiar 2c-2e bonding[2]. NBO analysis also gives you the atomic charges of these localised orbitals. However, it is important to note that these charges do not represent the spatial arrangement of the electron densities in a molecule, as electron density rearrangement can occur in molecules when bonds are being formed to give non spherical electron densities[2]. This idea is seen in the ammonium compound studied above and is discussed later.
Firstly it can be seen from the NBO charges that in all of the cations studied, the heteroatom is more positive than the carbons. This is as expected because these cations are formed by alkylation of the corresponding methyl heteroatom. For example, the tetramethylammonium cation is formed by the reaction of an alkylhalide with trimethylamine. Using a Valence bond approach, in this reaction, the methyl cation, which is electron deficient forms a covalent bond with the Nitrogen by removing an electron from its valence shell leading to the transfer of the positive charge onto the Nitrogen. The resulting electron density on the carbon, together with the higher electronegativity of the Carbon compared to Hydrogen, results in the methyl hydrogens bearing a positive charge as the carbon centre pulls electron density away from the hydrogens. This increases the negative charge of the carbon even further, as seen. This idea is true in all of the cations studied and explains the NBO charge distributions seen.
It can also be seen that, in the ammonium ion there is the smallest difference in charge between the carbon and the heteroatom. This is clearer in the charge distribution by colour where it can be seen that in both the phosphonium and the sulphonium cations, the central heteroatom is much more positive than the carbon and the hydrogens. This is consistent with the electronegativities of the central heteroatoms where the nitrogen is the most electronegative atom, followed by sulphur and then phosphorous. This means that Nitrogen, although has lost a valence electron in forming the covalent bond, will still be pulling electron density towards itself from the bond. In addition to this carbon and Nitrogen are neighbouring same row elements which means that there is a better orbital overlap due to a better match in size and energy of the orbital the corresponding bonding orbitals. This is the reason for the larger charge distribution across the methyl group seen in the ammonium cation. The largest difference in NBO charge is seen in the Phosphonium cation, where the Phosphorous is much more positive than the Carbon suggesting that the overall net positive charge resides mainly on the Phosphorous as expected. This is because phosphorus is less electronegative than carbon and thus will not be pulling electron density from the bond towards itself from the new bond, thus resulting in a smaller distribution of charge. Also using the MO analysis as before, the Phosphorous Valence orbitals are more diffused and larger than the carbon as they are in different rows of the periodic table, leading to weaker overlap. Sulphonium cation shows similar charge distribution to the Phosphonium cation, however the Sulphur is slightly more electronegative than the carbon and hence the reason why the difference in NBO charge between the carbon and the sulphur are less than for the phosphonium cation, suggesting a slightly larger distribution of charge in the sulphonium cation.
The charge distribution studied here can be compared to the contribution of the C and the heteroatom to the C-X heteroatom. The contributions as shown above are consistent with the NBO charges observed for both the phosphonium and sulphonium cations. In the Phosphonium cation there is a larger contribution form the carbon atomic orbitals to the C-P bond, as the phosphorous is more elctropositve than the carbon. The approximately 50:50 contribution in the S-C bond is due to the similar electronegativities of the two atoms as explained earlier. In the case of the ammonium cation, the NBO charges are not consistent with the contributions computed. It can be seen from the relative contributions in the C-N bond that the nitrogen has a greater contribution to the bond than carbon. This means that most of the electron density in the ammonium C-N bond resides in nitrogen based atomic orbitals. However the NBO charges suggest that there is more electron density on the carbon. This is because the NBO charges do not take into account the charge distribution that occurs due to the net positive charge of the molecule resulting in a non-spherical charge distribution[3]. This charge distribution occurs along the highly polarised C-N bond due to the high electronegativity of the nitrogen as well as the net positive charge being on the nitrogen which attracts electron density from the carbon[3]. This build-up of electron density at the nitrogen also results in the polarisation of the C-H bond towards the central nitrogen, thus reducing the electron density on these hydrogens. So overall, the net positive charge is localised to the methyl groups, especially the hydrogens, with the Nitrogen (and carbon) in effect being neutral[3]. This delocalisation of the positive charge on the methyl groups is the reason why the traditional representation of the positive charge being on the N is incorrect.
Molecular Orbital Analysis of [N(CH3)4]+
| MOs of N(CH3)4 | |
|---|---|
| 1 | 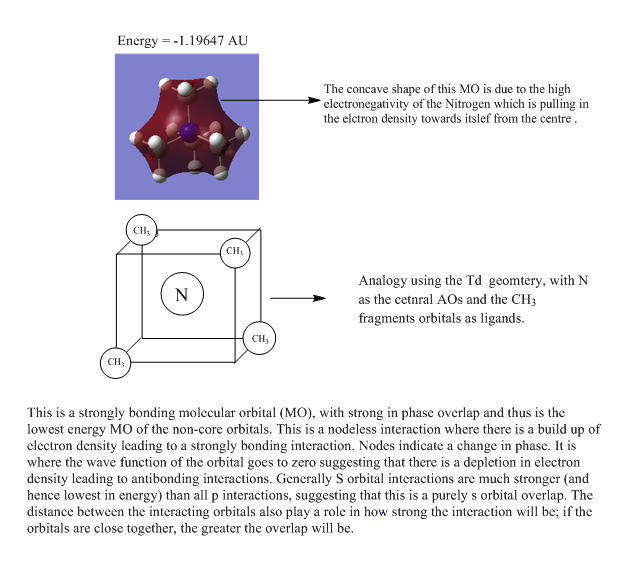
|
| 2 | 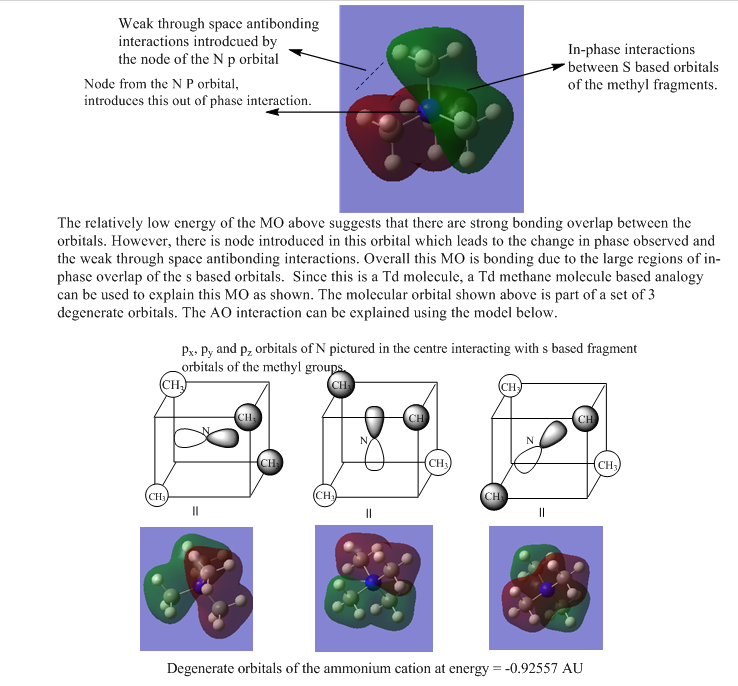
|
| 3 | 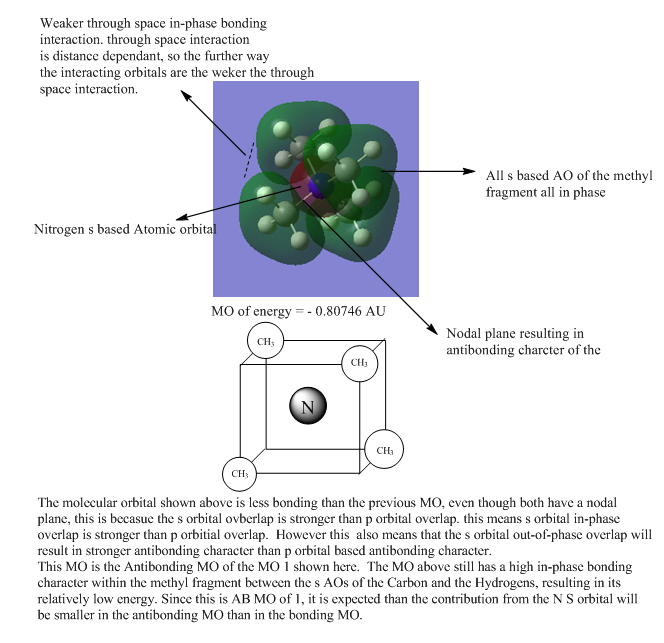
|
| 4 | 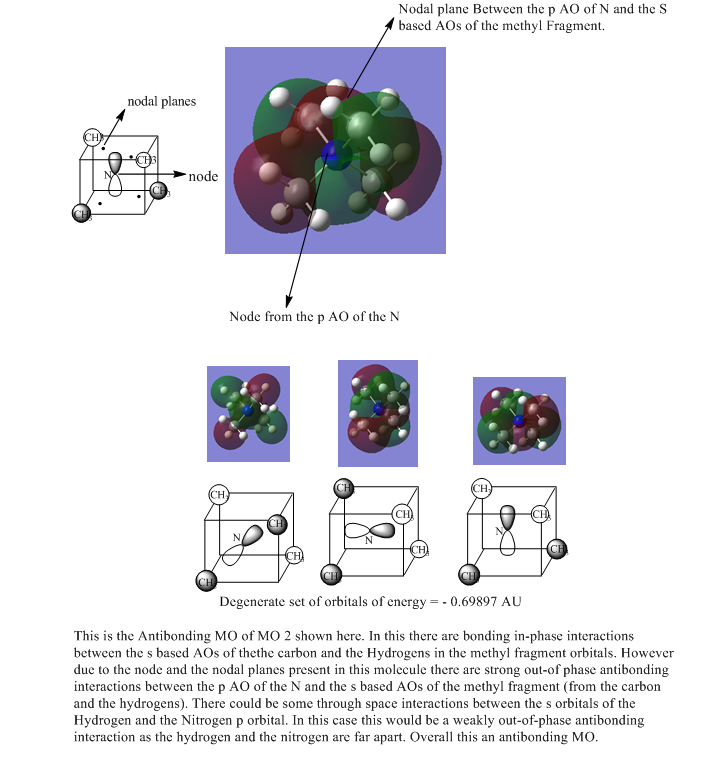
|
| 5 | 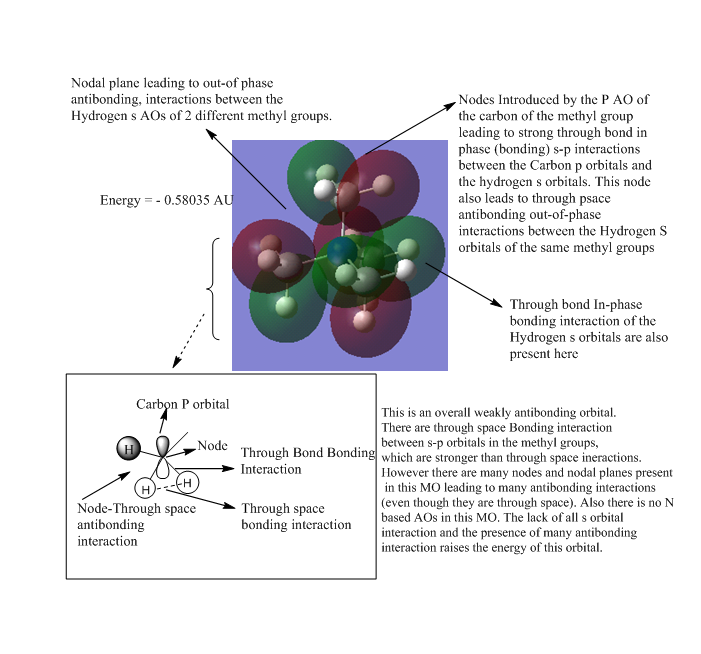
|
| 4 | 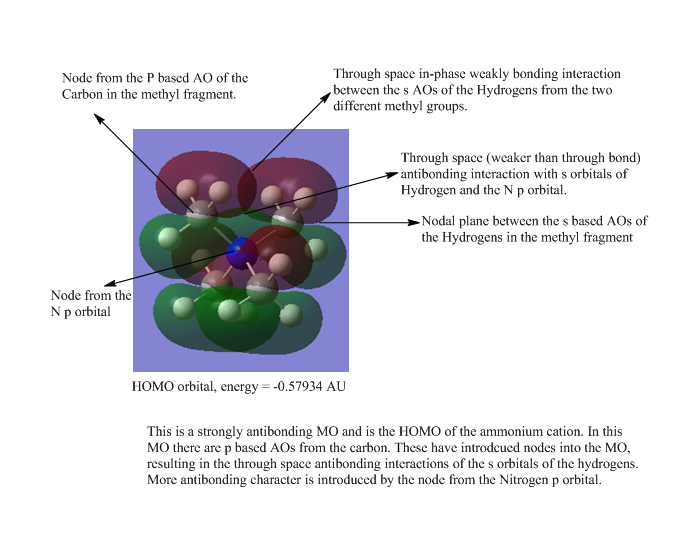
|
Effect of changing Ligands in 'onium' cations
CH2OH ligand
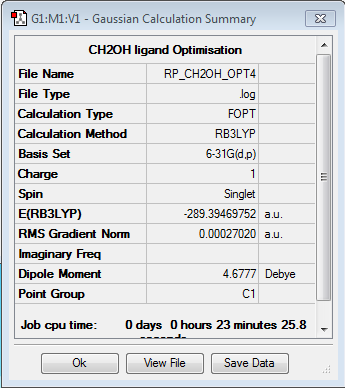
Optimisation of [N(CH3)3(CH2OH)]+
Optimisation log file here
| summary data | convergence | Jmol | |||
|---|---|---|---|---|---|
|
Item Value Threshold Converged? Maximum Force 0.000001 0.000015 YES RMS Force 0.000000 0.000010 YES Maximum Displacement 0.000016 0.000060 YES RMS Displacement 0.000004 0.000040 YES |
|
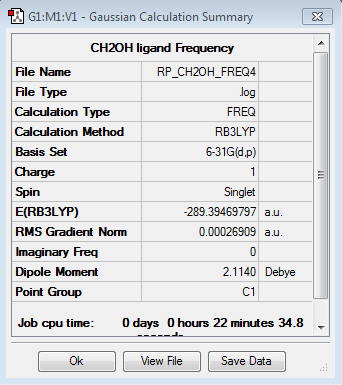
Frequency analysis for [N(CH3)3(CH2OH)]+
Frequency file: here
| summary data | low modes |
|---|---|
|
Low frequencies --- -11.2817 -3.5622 -0.0013 -0.0011 -0.0008 14.1683 Low frequencies --- 131.0406 213.6328 254.0153 |
CH2CN ligand
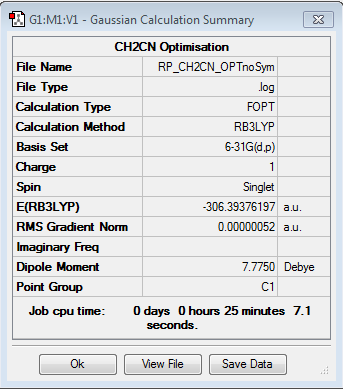
Optimisation of [N(CH3)3(CH2CN)]+
Optimisation log file here
| summary data | convergence | Jmol | |||
|---|---|---|---|---|---|
|
Item Value Threshold Converged? Maximum Force 0.000001 0.000015 YES RMS Force 0.000000 0.000010 YES Maximum Displacement 0.000055 0.000060 YES RMS Displacement 0.000019 0.000040 YES |
|
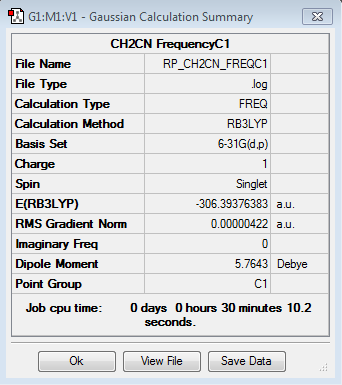
Frequency analysis for [N(CH3)3(CH2CN)]+
Frequency file: here
| summary data | low modes |
|---|---|
|
Low frequencies --- -2.5147 0.0007 0.0008 0.0013 7.1579 9.6840 Low frequencies --- 91.7901 154.0297 210.9263 |
NBO Charge Analysis
MO file of [N(CH3)3(CH2OH)]+: DOI:10042/110699
MO file of [N(CH3)3(CH2CN)]+: DOI:10042/110702
| [N(CH3)4]+ | [N(CH3)3(CH2OH)]+ | [N(CH3)3(CH2CN)+] | |
|---|---|---|---|
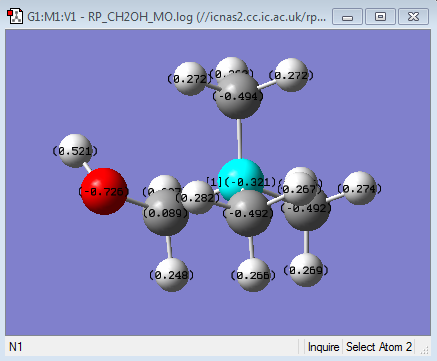
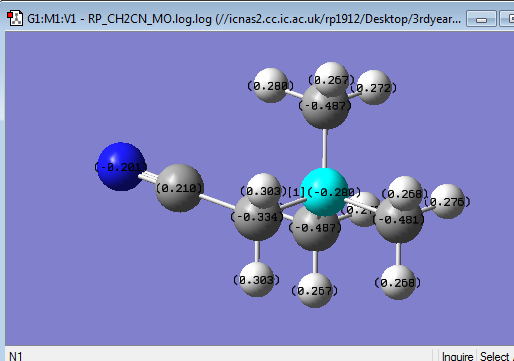
| Central N | -0.295 | -0.321 | -0.280 |
| Carbon (functional Group) | - | 0.089 | -0.334 |
| (C)-Hydrogen (functional group) | - | 0.248 | 0.303 |
| Carbon (methyl) | -0.483 | -0.492,-0.492,-0.494 | -0.487, -0.481, -0.487 |
| Hydrogen (methyl) | 0.269 | ~0.270 | ~0.270 |
| Functional group | - | O = -0.726, H = 0.521 | C = 0.210, N = -0.201 |
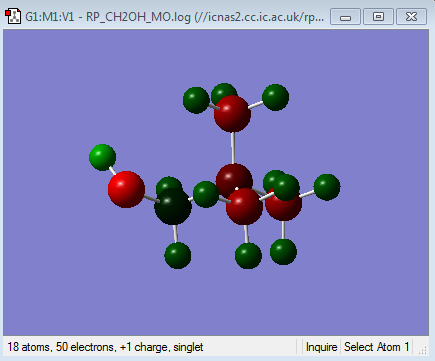
| Charge Distribution of [N(CH3)3(CH2OH)]+ | NBO charge |
|---|---|
|
|
| Charge Distribution of [N(CH3)3(CH2CN)]+ | NBO charge |
|---|---|
 
|
|
It can be seen that the Charge distribution upon the addition of the electron donating OH group (in the form of CH2OH) has made the central Nitrogen atom more negative. Therefore the difference in charge between the Nitrogen and the other methyl carbons have also decreased, suggesting a greater distribution of charge in this molecule than in the tetramethylammonium cation. This charge distribution is a result of the net positive charge of molecule being localised on the carbon of the CH2OH ligand (as shown in green in the charge distribution diagram) The positive charge is also localized onto the hydrogens as before. According to the electron donating effect of the OH group, the Nitrogen should have increased in negative charge as a result of more electron donation from the oxygen. This is in fact what we see in the NBO charges, where the central Nitrogen has become more negative than in the tetra methyl ammonium cation. This donation of electron density has resulted in the carbon in the CH2OH becoming much more positive as shown in the NBO charges. This is consistent with the idea that a carbon surrounded by two highly electronegative atoms (N = 3.04 and O = 3.44) will lose its electron density. This has led to the net positive charge from the Nitrogen being distributed on to the carbon and the hydrogens of the CH2OH much more than the methyl groups, where as in the tetra methyl ammonium cation, this charge was distributed evenly onto all of the methyl groups (as indicated in the colored charge distribution diagrams).
It can also be seen from above that the charge distribution upon the addition of the CN group (in the form of CH2CN) has changed from that in the tetra methyl ammonium cation. The electron withdrawing effect of the CN has made the carbon directly attached to the CN group more positive as expected. The effect of this is that the difference in charge between the central nitrogen and the carbon attached to the CN has decreased. This means that there is now a greater charge distribution between this carbon and the central nitrogen due to the increased polarisation of this bond compared to the other N-methyl bonds. Studies showed that this type of larger delocalisation of charge in ammonium cation lead to better interactions with anion in forming ionic liquids of higher polarity.[4]
HOMO/LUMO Analysis
| [N(CH3)4]+ | [N(CH3)3(CH2OH)]+ | [N(CH3)3(CH2CN)]+ | |
|---|---|---|---|
| HOMO | 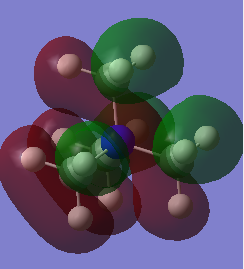 |
 |
|
| LUMO | 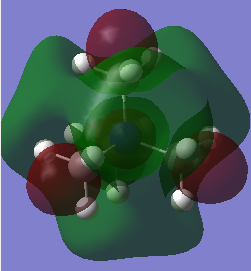 |
 |
|
| [N(CH3)4]+ | [N(CH3)3(CH2OH)]+ | [N(CH3)3(CH2CN)]+ | |
|---|---|---|---|
| HOMO energy in AU | -0.5793400 | -0.4876300 | -0.50048 |
| HOMO energy in kJ/mol | -1521.06 | -1280.27 | -1314.01 |
| LUMO energy in AU | -0.1330600 | -0.1245900 | -0.1818300 |
| LUMO energy in kJ/mol | -349.35 | -327.11 | -477.39 |
| HOMO-LUMO Gap in AU | -0.4462800 | -0.3630400 | -0.3186500 |
| HOMO-LUMO Gap in kJ/mol | -1171.71 | -953.16 | -836.62 |
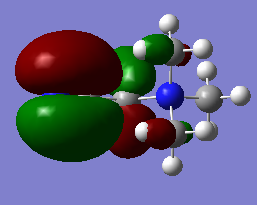
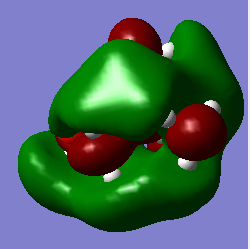
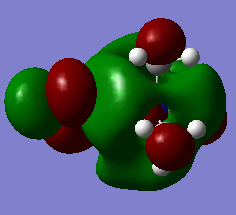
As expected from a highly symmetric Td molecule such as the tetra methyl ammonium cation, the HOMO and LUMO are both highly symmetric in their delocalisation of electron densities. The shape of the HOMO of the [N(CH3)3(CH2OH)]+ has changed significantly from the tetramethyl ammonium. It's electron density distribution is as expected for this complex as the majority of the electron density is located on the highly electronegative oxygen, suggesting that the HOMO is mainly based on the fragment orbitals of the OH. The HOMO shows more antibonding character than the tetramethyl ammonium HOMO, as indicated by the higher energy of this HOMO compared to the tetramethyl ammonium HOMO. It can be seen that the higher antibonding character comes from the greater through bond out-of phase interaction in the O-H fragment orbitals compared to the methyl fragment orbitals in the tetramethyl ammonium. A similar picture is seen for the HOMO of the [N(CH3)3(CH2CN)]+ , where the HOMO of this complex is almost purely localised on the CN fragment orbitals and is higher in energy than the tetramethyl ammonium HOMO. This could be due to the electron withdrawing nature of CN. The Low energy of the HOMO of the tetramethyl groups mean that these will act as good donors in chemical reactions (as lewis acids for example).
Again, as expected the LUMO of the [N(CH3)3(CH2OH)]+ and the [N(CH3)3(CH2CN)]+ are no longer symmetric as in the tetra methyl ammonium complex. All of the LUMOs studied here have similar energies. However the [N(CH3)3(CH2OH)]+ LUMO is the highest in energy by a small amount due to more antibonding character from an increased number of nodes and more though bond out-of phase interactions. The low energy LUMO of the [N(CH3)3(CH2CN)]+ means that, from a reactive point of view, it will be a better acceptor (as a lewis bases for example). The HOMO-LUMO gaps compared here shows that the [N(CH3)3(CH2CN)]+ has the lowest energy gap and the tetramethyl ammonium the highest. The smaller the homo lumo gap the less stable a molecule is. This means that the tertramethyl ammonium compound is the most stable molecule of those studied here. This kind of stability may be important in forming ionic liquids that can remain in the liquid state even at low temperatures. It is also important in the formation of ionic liquids to use cations of larger size and lower symmetry cations as they will have a reduced melting point, essential for ionic liquids. The lower symmetry and size leads to a disordered packing of the salt crystals formed with an anion, resulting in a lower lattice energy and thus a lower meting point.[4]
References
- ↑ 1.0 1.1 1.2 1.3 1.4 1.5 1.6 1.7 1.8 Small scale Chemistry, Chemical Bonding,http://www.smallscalechemistry.colostate.edu/PowerfulPictures/ChemicalBonding.pdf (accessed Novemeber 2014).
- ↑ 2.0 2.1 2.2 Hunt Research Group, http://www.huntresearchgroup.org.uk/teaching/teaching_comp_chem_year4/L7_bonding.pdf (accessed November 2014).
- ↑ 3.0 3.1 3.2 3.3 A.N Barret, G.C.K Roberts, A.S.V Burgen, G.M Clore, Ab Initio MOlecular Orbital Calculations of Electron Distribution in Tetramethylammonium Ion, 1983, 24, 443-448 .
- ↑ 4.0 4.1 P.J Carvalho, S.P.M Ventura, M.L.S Batista, B. Schroder, F. Goncalves, J. Esperanca, F. Mutelet, J.A.P Coutinho Understanding the impact of the central atom on the ionic Liquid Behaviour: Ammonium Vs Phosphonium Cations,J. Chem. Phys. 2014, 140, Available from: http://scitation.aip.org/content/aip/journal/jcp/140/6/10.1063/1.4864182.

