Rep:Title=Mod:mvs243
Conformational Analysis using Molecular Mechanics
The Hydrogenation of Cyclopentadiene Dimer
Cyclopentadiene exo and endo isomers
| Product | Energy (KJ/mol) (kcal/mol) | Optimised Structure | |||
|---|---|---|---|---|---|
| Exo | 231.84, 55.41 |
| |||
| Endo | 243.63, 58.23 |
|
The dimerisation of cyclopentadiene can, in theory, lead to either an exo or endo dimer and the formation of one over the other is dependent on whether the reaction is under thermodynamic or kinetic control. The exo dimer is formed if the reaction proceeds via thermodynamic control to give the lowest energy product. This was confirmed through the geometry optimisation of the molecules using the MMFF94s forcefield in Avogadro which gave a an energy difference of 2.82 kcal. This isomer is lower in energy as there is a reduced amount of steric congestion in comparison to the endo dimer. The endo dimer is formed if the reaction is kinetically controlled and proceeds via the lowest energy transition state. The transition state of the endo dimer is stabilised by in phase secondary orbital interactions between the secondary non bonding orbitals of the diene and dienophile. It therefore has a lower energy transition state which corresponds to a lower activation barrier. It has been experimentally determined that the actual product of the dimerisation is the higher energy endo isomer. Therefore it can be seen that the reaction is kinetically controlled and is affected more by favourable orbital interaction rather than sterics.
Dihydro dicyclopentadiene molecules
| 3 (9,10-dihydrodicyclopentadiene) | 4 (1, 2-dihydrodicyclopentadiene) | |||||||
|---|---|---|---|---|---|---|---|---|
| Optimised Molecule |
|
| ||||||
| Total energy (KJ/mol), (kcal/mol) | 211.21, 50.45 | 172.74, 41.26 | ||||||
| Total stretching contribution (kcal/mol) | 3.31 | 2.82 | ||||||
| Total bending contribution (kcal/mol) | 31.94 | 24.69 | ||||||
| Total torsional energy (kcal/mol) | -1.47 | -0.39 | ||||||
| Total van der waals energy (kcal/mol) | 13.64 | 10.64 |
Dicyclopentadiene can be convered into endo-tetrahydrodicyclopentadiene through prolonged hydrogenation. However the intermediate dihydrocyclopentadiene product in this reaction is formed much faster and can be formed as one of two isomers.
The dihydrocyclopentadiene isomer in which the double bond in the norborene part of the dimer has been hydrogenated ( product = 9,10-dihydrodicyclopentadiene) has the lowest overall energy. This means that it is the thermodynamically more stable product by 9.19 kcal/mol. It can be seen experimentally that this is also the first double bond to be hydrogenated with the reaction rate being much faster than the hydrogen bond in the C5 ring (1, 2-dihydrodicyclopentadiene)[1]. This can be attributed to the steric hinderance effect which is confirmed by the negligible amount of the 1, 2-dihydrodicyclopentadiene that was made when dicyclopentadiene was hydrogenated. [2] There is a large amount of ring strain relief when the double bond is hydrogentated in the norborene part of the molecule. This ring strain is the result of the bridging structure that is present in this part of the molecule which increases the reactivity of the double bond. This shows that it is in fact the thermodynamic product of the hydrogenation reaction that is formed experimentally.
The two greatest contributions to the total energy of each isomer are the angle bending energies and the Van der Waals energy. These are also the two energies that have the greatest difference in the two structures. The angle bending energy is lower in 9,10-dihydrodicyclopentadiene by 7.25 kcal/mol and the Van der Waals energy is lower by 3 kcal/mol. This can be explained by the possible greater amount of ring strain present in 1,2-dihydrodicyclopentadiene which means there is a greater deviation from the normal bond angle of 120o for an sp2 carbon. The greater Van der Waals energy contribution in 1,2-dihydrodicyclopentadiene also shows that there is a greater amount of repulsion within its structure in comparison with the other isomer. This could be due to a greater excess of repulsion vs favourable interactions in the 1,2-dihydrodicyclopentadiene product between non-bonded hydrogen atoms. This repulsion occurs when the distance between them is less than 2.1Ă and therefore indicates that the relief of ring strain moves some of the hydrogen atoms so that they are placed at greater distances than this relative to one another. [3]
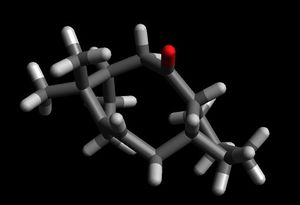
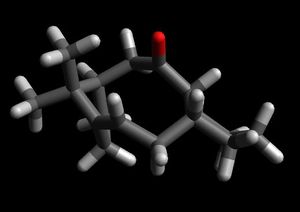
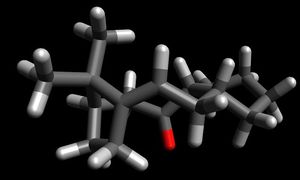
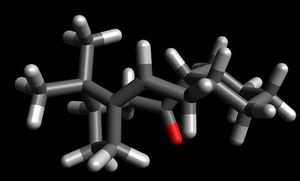
The structures of both atropisomers were computed and optimised in the same way as described above. After this initial optimisation, the structures of the molecules were changed by changing the positions of the atoms in the cyclohexane ring part of the molecule. 3 different energy conformers were computed in total- ranging from half chair to chair and it was found what the lowest energy was obtained when the cyclohexane ring was in a chair formation.
Atropisomer 1
Atropisomer 2
| Conformation 1 | Conformation 2 | Conformation 3 | ||||||||||
|---|---|---|---|---|---|---|---|---|---|---|---|---|
| Atropisomer 2 |
|
|
| |||||||||
| Screenshot of conformations | 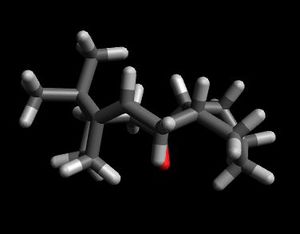 |
 |
| |||||||||
| Total energy (KJ/mol) | 288.41 | 278.292 | 253.56 | |||||||||
| Conformation of cyclohexyl ring | half chair | twist boat | chair |
It can be seen that molecule atropisomer 2 is the more stable isomer of the taxol intermediate. This is because all of the different computed conformations of this molecule are lower than the lowest energy computed conformer of atropisomer 1. This can be rationalised by looking at the orbital overlap in atropisomer 2. In this molecule the carbonyl compound is pointing down which allows a stabilising anti peri-planar between the stabilising interaction between the σ*C-O orbital and the σC-H orbital on the neighboring carbon atom. The σC-H orbital is a high energy donor and the σ*C-O is a low energy acceptor. This means that there is a strong interaction between the orbitals which means a greater overall stabilisation of the molecule. This cannot happen in the other atropisomer when the carbon is pointing up as the orbitals are not in the right orientation to align properly and so the energy is much higher in this molecule. Along with the absence of the stabilising interaction, there is steric repulsion between the carbonyl group and the bridge in atropisomer 1 which increases the energy of the molecule. [3]
Despite the energy difference, both of the molecules are not very reactive at the alkene part of the molecule and have very slow reaction rates. This can be explained by the concept of hyperstable alkenes. These alkenes are more stable than their corresponded saturated counterparts. This greater stablilty is attributed to the cage structure of the ring and the greater strain that occurs in the saturated polycycloalkane. This means that there is a lack of driving force for a hydrogenation reaction to occur.
This can be illustrated when the energies of atropisomer 1 and its hydrogenated counterpart are compared:
| Molecule 9 | Molecule 9 hydrogenated | |||||||
|---|---|---|---|---|---|---|---|---|
| Molecule |
|
| ||||||
| Molecule | 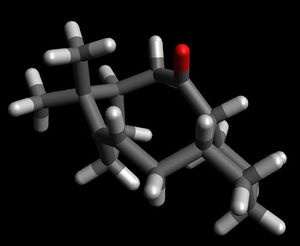
|

| ||||||
| Energy (KJ/mol), (Kcal/mol) | 295.33, 70.54 | 342.30, 81.76 | ||||||
| Angle (deg) | 123.5 | 117.3 |
There is a large difference in energy of 11.22 kcal between the two structures which confirms the theory of hyperstability. This energy difference can further be explained when looking at the angle at the bridgehead carbon. In atropisomer 1 this angle is 123.5o which is 3.5o away from the preferred angle for an sp2 carbon. In contrast the angle at the brigehead carbon in the saturated structure is 117.3o which is 7.8o more than the preferred angle for the newly formed sp3 centre. There is a larger deviation from ideality in the hydrogenated structure which would correspond to a higher energy. The lower energy bridgehead olefin reacts slowly as reaction leads to loss of stability. However this hyperstability does not exist is smaller bridgehead olefin systems as in these cases the double bond introduced ring strain into the system rather than reducing it. [4]
Spectroscopic Simulation using Quantum Mechanics
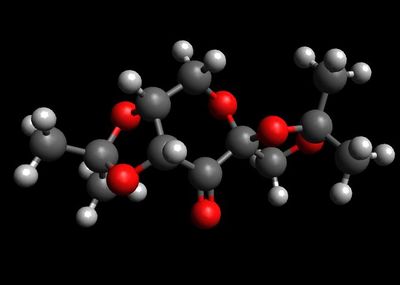
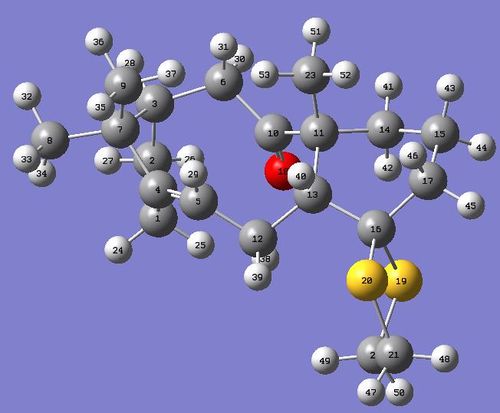
Molecule 18- A derivative of the atropisomer 2 that is seen above was drawn and optimised as before. A further optimisation was then carried out using the HPC scan server to give the molecule shown below:
Optimisation: DOI:10042/132215
| Energy (KJ/mol) | Optimised Structure | Atom numbers | |||
|---|---|---|---|---|---|
| 231.84 |
|
|
Further optimisation of the molecule was attempted by moving the positions of the atoms in the cyclohexane ring structure. However a chair conformation was not obtained and consequently this is the lowest energy conformer that I was able to analyse.
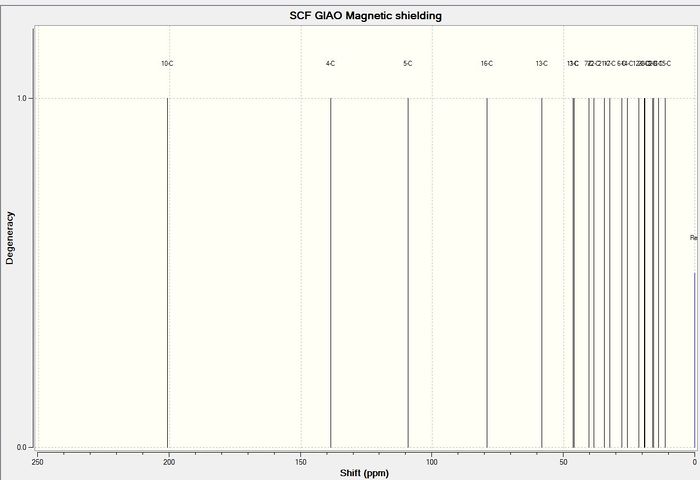
The carbon NMR of the molecule was computed to give the following result:
13 C NMR
| Shift (ppm) | Atom Number | Literature [5] | Difference |
|---|---|---|---|
| 200.9772985 | 10 | 211.49 | 10.5127015 |
| 138.7473579 | 4 | 148.72 | 9.9726421 |
| 109.307244 | 5 | 120.9 | 11.592756 |
| 79.10930151 | 16 | 74.61 | -4.49930151 |
| 58.25103886 | 13 | 60.53 | 2.27896114 |
| 46.27419092 | 11 | 51.3 | 5.02580908 |
| 45.85859871 | 3 | 50.94 | 5.08140129 |
| 40.3448937 | 7 | 45.53 | 5.1851063 |
| 38.39896852 | 22 | 43.28 | 4.88103148 |
| 34.43906684 | 21 | 40.82 | 6.38093316 |
| 32.36735398 | 17 | 38.73 | 6.36264602 |
| 27.75652177 | 6 | 36.78 | 9.02347823 |
| 25.59161815 | 14 | 35.47 | 9.87838185 |
| 21.32173732 | 12 | 30.84 | 9.51826268 |
| 19.26551492 | 23 | 30 | 10.73448508 |
| 18.99472752 | 1 | 25.56 | 6.56527248 |
| 16.12723548 | 8 | 25.35 | 9.22276452 |
| 15.56536269 | 2 | 22.21 | 6.64463731 |
| 13.79071215 | 9 | 21.39 | 7.59928785 |
| 11.3807087 | 15 | 19.83 | 8.4492913 |
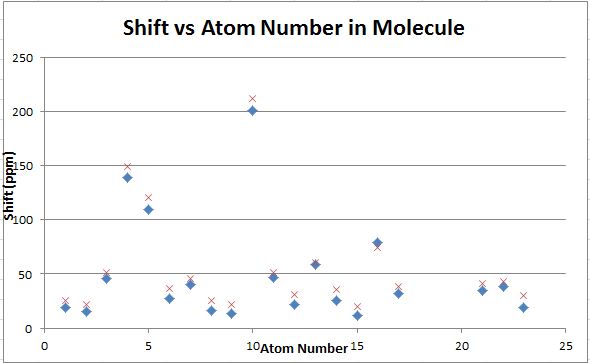
The computed carbon NMR shifts compare well with the literature values as there are not huge differences in the shifts given. The differences between the computed and literature values are shown in the graph above with the computed values being represented by the blue diamonds and the literature values being represented by the red crosses. The largest difference was around 10ppm and the smallest was around 5ppm. From this experiment it can be concluded that while computed carbon NMR are not completely accurate, they provide shift values in the correct region and so can be used as a guide.
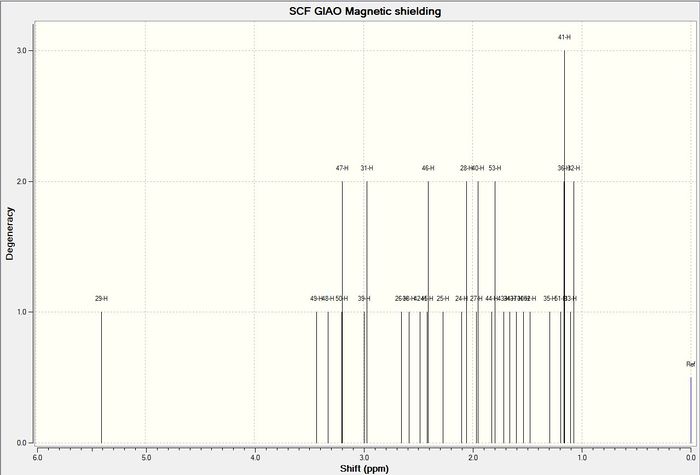
1 H NMR
| Atom Number | Shift (ppm) | Literature [5] |
|---|---|---|
| 29 | 5.4 | 5.21 |
| 39, 38, 31, 30, 26, 25 | 2.98-1.53 | 3-2.7 |
| 50, 49, 48, 47 | 3.43-3.19 | 2.7-2.35 |
| 46, 45, 44, 43, 42, 41 | 2.48- 1.17 | 2.2-1.7 |
| 40 | 1.96 | 1.58 |
| 28, 24, 27 | 2.08-1.96 | 1.5-1.2 |
| 53, 52, 51 | 1.48 | 1.1 |
| 37, 36, 35 | 1.35 | 1.07 |
| 34, 33,32 | 1.28 | 1.03 |
In the case of hydrogen it was easier to group the hydrogen atoms according to the groups that they were written about in the literature and therefore average values or ranges were given according to how they appeared in the literature. This was instead of the absolute computed value so that a better comparison could be made. The computed hydrogen NMR shifts do not compare as well with the literature as there are large deviations from the experimentally determined values (the computed values are much higher on average) and so it can be concluded that computed hydrogen NMR cannot be used to predict the NMR of a reaction product. Some of the shifts even appear in a completely different region (the cyclohexyl hydrogen atoms)to that expected from literature.
The reasons for the deviations from experimental values in both the carbon and hydrogen NMR cases can be attributed to the fact that only a single conformer was computed. The experimentally determined shifts are the result of time averaged shifts of all of the possible conformations that the molecule can exist in. This is because the molecule is interconverting between all of these molecules at a fast rate whilst the NMR shifts are being recorded and so the time weighted average of all of the different conformations is given. The shifts that were computed also did not give any information about coupling within the molecule and consequently a different shift was obtained for each hydrogen atom. For example 3 different shifts were given for the hydrogens in a single methyl environment whereas these would appear as a singlet experimentally. This also explains the deviations from the experimental values as multiplicities were not taken into account.
As it is possible to compute coupled NMR spectrums, a further extension of this experiment could be to do the analysis in this way once it becomes cheaper in computational terms.
Analysis of the properties of the synthesised alkene epoxides
The Crystal Structures of the Two Catalysts
The two adjacent tert-butyl groups on the catalyst help to conformationally lock the molecule and also shield the aryl rings. This bulkiness prevents the approach of an alkene on this side of the molecule due to unfavourable steric interactions and so it has to interact from the other side of the di-imine bridge. This helps to introduce selectivity into the epoxidation process. [6]
There are two anomeric centres present in this catalyst, both of which are close to the reacting centre of the molecule which helps to control the stereochemistry of the resulting epoxide. The anomeric centres provide protection of certain parts of the structure and therefore limits the path of the incoming alkene. The anomeric centres interact with neighbouring orbitals in the structure e.g. the interaction of a lone pair on an oxygen atom overalps with the σ*C-O of another carbon oxygen bond which results in the lengthening of the C-O bonds. This can happen to all of the C-O bonds in the structure and so they are all around 1.44Ă which is longer than the expected length of 1.34Ă. [7]
NMR Analysis of the Epoxides
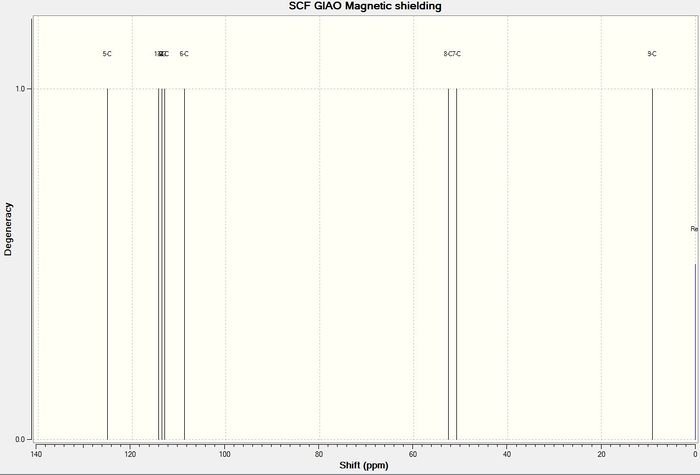
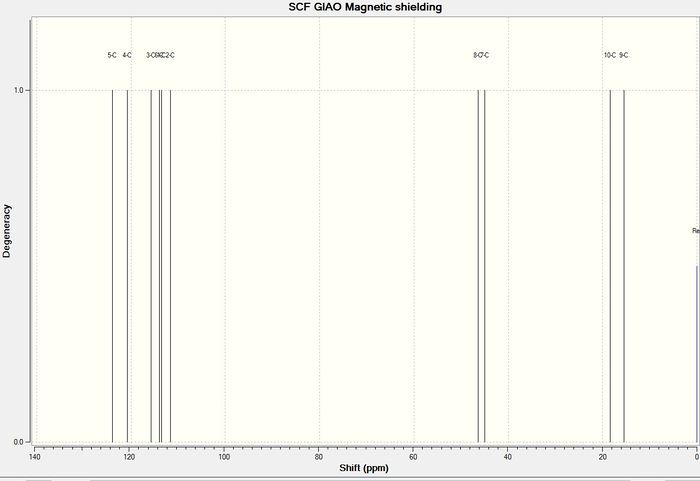
13C NMR
Trans-β-Methylstyrene Oxide
| 13C NMR for Trans-β-Methylstyrene Oxide R,R | |||
|---|---|---|---|
| Atom Number | Chemical Shift (δ ppm) | Literature Value [8] | 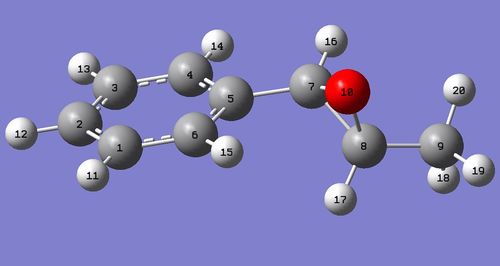
|
| 5 | 125.27 | 137.80 | |
| 1 | 114.37 | 128.40 | |
| 3 | 113.62 | 128.00 | |
| 4 | 113.09 | ||
| 2 | 113.02 | ||
| 6 | 108.78 | 125.60 | |
| 8 | 52.62 | 59.50 | |
| 7 | 50.87 | 59.0 | |
| 9 | 9.13 | 17.90 | |
Dihydronaphthalene Oxide
| 13C NMR for Dihydronaphthalene Oxide S,R | |||
|---|---|---|---|
| Atom Number | Chemical Shift (δ ppm) | Literature Value [9] | 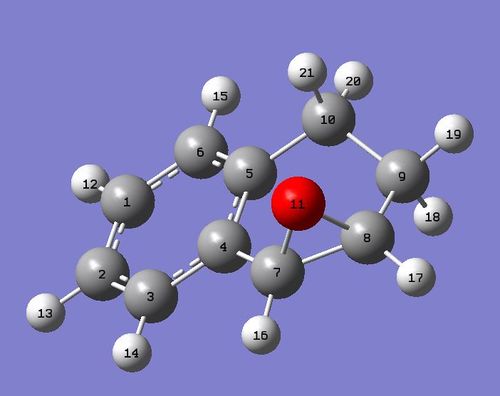
|
| 5 | 123.95 | 137.10 | |
| 4 | 120.73 | 132.90 | |
| 3 | 115.72 | 129.90 | |
| 6 | 114.02 | 128.83 | |
| 1 | 113.57 | 128.80 | |
| 2 | 111.66 | 126.50 | |
| 8 | 46.43 | 55.50 | |
| 7 | 45.04 | 55.20 | |
| 10 | 18.40 | 24.80 | |
| 9 | 15.44 | 22.20 | |
1H NMR
Trans-β-Methylstyrene Oxide
| 1H NMR for Trans-β-Methylstyrene Oxide R,R | |||
|---|---|---|---|
| Atom Number | Chemical Shift (δ ppm) | Literature Value [8] | 
|
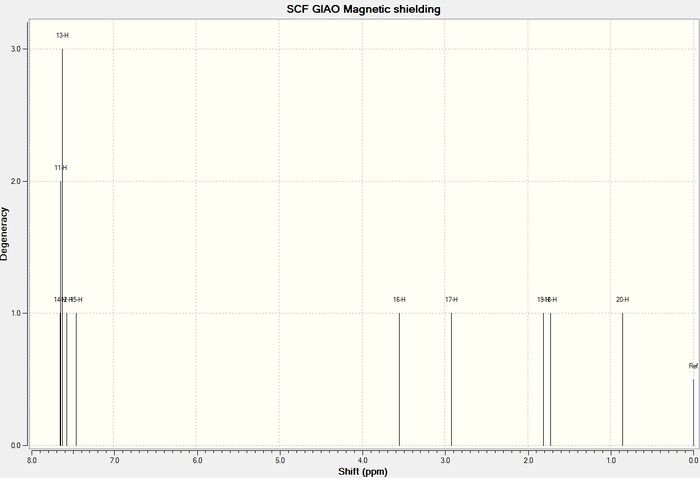
| 11 | 7.63 | 7.36−7.24 | |
| 14 | 7.63 | ||
| 13 | 7.63 | ||
| 12 | 7.56 | ||
| 15 | 7.44 | ||
| 16 | 3.55 | 3.57 | |
| 17 | 2.92 | 3.03 | |
| 18 | 1.81 | 1.45 | |
| 19 | 1.72 | ||
| 20 | 0.85 | ||
Dihydronaphthalene Oxide
| 1H NMR for Dihydronaphthalene Oxide S,R | |||
|---|---|---|---|
| Atom Number | Chemical Shift (δ ppm) | Literature Value [9] | 
|
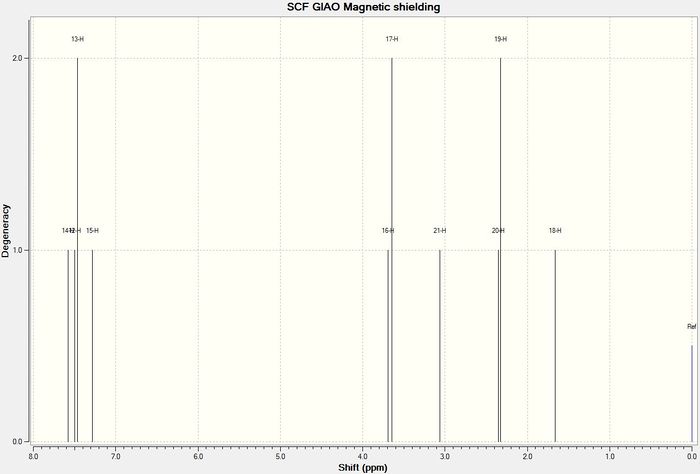
| 14 | 7.58 | 7.34 | |
| 12 | 7.48 | 7.09-7.25 | |
| 13 | 7.48 | ||
| 15 | 7.28 | 7.02 | |
| 16 | 3.67 | 3.79 | |
| 17 | 3.67 | 3.66 | |
| 21 | 3.06 | 2.64-2.70 | |
| 19 | 2.34 | 2.47 | |
| 20 | 2.34 | 2.29-2.37 | |
| 18 | 1.66 | 1.62 - 1.72 | |
Overall the computed NMR agrees to a reasonable extent with the experimentally determined values. There is a general over approximation of all the shifts which occurs for the same reasons as described previously. There is a closer resemblance to literature with the hydrogen NMR values for these epoxides than was seen in the previous molecule which could be the result of the decreased size of the molecule and consequently the greater likelihood of attaining a global energy minimum. There is also a slightly better match between the computed and experimental values for the dihydronaphthalene oxide.
Optical Rotation Analysis of Epoxides
Trans-β-Methylstyrene Oxide
| Optical Rotation Values for Trans-β-Methylstyrene Oxide | |
|---|---|
| R,R | S,S |
| 46.77 | -46.77 |
| Literature Values | -46.9 [10] |
| 46 [11] | |
| 45.3 [12] | |
Dihydronaphthalene Oxide
| Optical Rotation Values for Dihydronaphthalene Oxide | |
|---|---|
| S,R | -155.09 |
| Literature Values | -144.9 [13] |
| -138 [14] | |
There is a very good comparison with literature values for the trans-β-methylstyrene oxide which showcases the validity of both the computational and experimental results. The comparison is not as strong for the dihydronaphthalene oxide. There is a large difference between the two experimentally determined values and so it is not surprising that the computed value is also different. This could be due to a difference in conditions when both of the experimental optical rotation values were calculated and also a difference in the input conditions in the computational experiment. Optical rotation is affected by temperature and concentration among other things and so if these were not kept constant then the results would not be comparable.
Chiral Optical Properties of Epoxides
Trans-β-Methylstyrene Oxide
| Trans-β-Methylstyrene Oxide | VCD |
|---|---|
| RR | 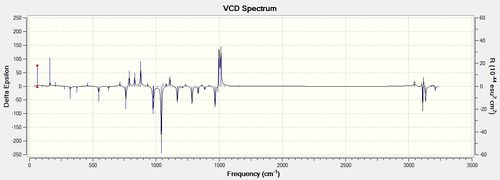
|
| SS | 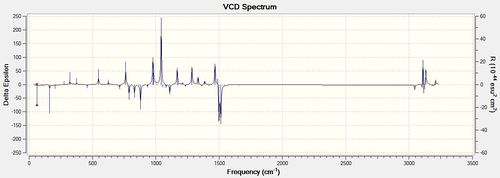
|
Dihydronaphthalene Oxide
| Dihydronaphthalene Oxide | VCD |
|---|---|
| S,R | 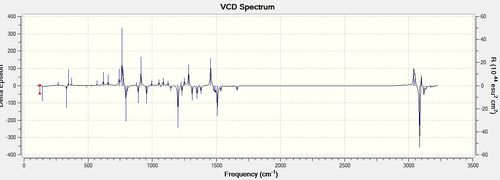
|
VCD analysis is an important tool in determining the absolute configuration of a molecule. It is a way of computing an IR spectrum for an opticallt active molecule. A normal IR spectrum would not be able to show the difference between enantiomers however a VCD spectrum would have different intensities and directions of the peaks. For example, in the diagrams that are shown above for the R,R and S,S enantiomers of the trans-β-methylstyrene oxide it can be seen the spectra are mirror images of each other. The peaks occur at the same frequencies and have the same absolute intensities but are opposite in their directions on the delta epsilon axis. Knowing this, I did not compute the R,S spectrum for the Dihydronaphthalene oxide as it is a mirror image of the above spectrum. VCD is a powerful technique as it does not require the separation of enantiomers and also gives weighted spectra according to the amount of each conformation present (represented by the intensities of the peaks). Further to this, it can also be used to determine solution-state stereochemical information. However, literature spectra for the compounds were not able to be found and so the validity of the computationally determined spectra cannot be determined. [15]
Using the (calculated) properties of transition state for the reaction
Shi Catalyst
| Shi Catalyst Transition State Energies for Trans-β-Methyl Styrene Oxide | ||
|---|---|---|
| R,R (AU) | S,S (AU) | |
| TS1 | -1343.022970 | -1343.017942 |
| TS2 | -1343.019233 | -1343.015603 |
| TS3 | -1343.029272 | -1343.023766 |
| TS4 | -1343.032443 | -1343.024742 |
With these values, the enantiomeric excess of the epoxidation can be calculated. This can be done by using the lowest energy transition state from both the R,R and S,S configurations and calculating the energy difference. This simplifies the calculation by assuming that the reaction only proceeds via the lowest energy transition so that contributions from the other transitions can be neglected. The values for the enantiomeric excess can then be calculated by using the Arrhenius equation [16]:
k= A(T)exp(-ΔG‡/RT)
Where k is the rate constant, A is the pre-exponential factor that is assumed to be the same for both of the transition states, ΔG‡ is the energy difference between the transition states (favoured-disfavoured), R is the gas constant and T is the temperature which was assumed to be 298.15K in the computer simulation.
By using the value for k that is found for both of the transition states, the followed equation can be applied:
ee= (kfavoured - kdisfavoured) / (kfavoured + kdisfavoured)
The kfavoured value is the k value which is calculated from the lowest energy transition state and the kdisfavoured is the k value which is calculated from the higher energy transition state . When this is substituted into the initial equation, the following equation can be applied without the need to find the intermediary k value:
ee= [(exp(-ΔG‡/RT)- 1) / (exp(-ΔG‡/RT)+ 1)] x 100% [16]
The enantiomeric excess values for both the trans-β-methylstyrene and dihydronaphthalene reactions with the Shi catalyst were calculated using this method and are shown in the tables below:
| Shi Catalysed Epoxidation of Trans-β-Methylstyrene | ||
|---|---|---|
| Enantiomer formed | ||
| R,R | S,S | |
| Transition State Energy G‡ (AU) | -1343.032443 | -1343.024742 |
| Transition State Energy G‡(KJ/mol) | -3526131.68 | -3526111.46 |
| Energy Difference ΔG‡ KJ/mol) | -20.22 | |
| Enantiomeric Excess | 99.94% | |
| Shi Catalyst Transition State Energies for Dihydronaphthalene Oxide | ||
|---|---|---|
| R,S (AU) | S,R (AU) | |
| TS1 | -1381.120782 | -1381.131343 |
| TS2 | -1381.125886 | -1381.116109 |
| TS3 | -1381.134059 | -1381.126039 |
| TS4 | -1381.126722 | -1381.136239 |
| Shi Catalysed Epoxidation of Dihydronaphthalene | ||
|---|---|---|
| Enantiomer formed | ||
| R,S | S,R | |
| Transition State Energy G‡(AU) | -1381.134059 | -1381.136239 |
| Transition State Energy G‡(KJ/mol) | -3626167.472 | -3626173.195 |
| Energy Difference ΔG‡ (KJ/mol) | -5.72 | |
| Enantiomeric Excess | 81.92% | |
The results of the calculations show that the R,R enantiomer for the trans-β-methylstyrene oxide is predicted to be the favoured enantiomer and can be modeled to form with an excess of 99.94%. This compares well with literature in which the R,R epoxide was predicted to form with 88% ee. [17] The value found in another paper is close to this with a value of 94% ee for the R,R enantiomer [7]. The deviations from literature in our computed result can be attributed to a difference in conditions when the epoxide was synthesised. For example the solvent used in the calculation was water whereas this could not have been used in the reaction as it would have led to decomposition of the catalyst. Also, the temperature of the experimental reactions was 273.15K which was 25K lower than the value that was used in the computational simulation.
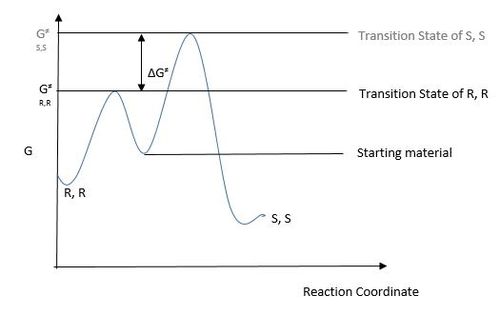
The reason for the prevalent formation of the R,R epoxide is due to the fact that it has a lower transition state energy value (G‡) than the S,S enantiomer. The R,R epoxide proceeds via a spiro transition state in which there is a stabilising interaction between the lone pair on an oxygen atom and the π* of the alkene which does not exist in a planar transition state which is the likely transition state for the S,S epoxide. [7] This means that it is the transition state that is closer in energy to the starting material and consequently is more likely to be crossed in a kinetically controlled reaction as shown in the diagram below:
In order to obtain a high enantiomeric excess value, the value for ΔG‡ needs to be large so that one particular transition state is much lower in energy than the other. This allows the product to almost be enantiomerically pure instead of being a mixture which shows a high selectivity of the catalyst involved in the reaction. This is clearly shown when comparing the values obtained for the epoxidation of dihydronaphthalene in comparison with the trans-β-methylstyrene. There is a smaller energy difference between the R,S and S,R transition states for the reaction of the Shi catalyst with dihydronaphthalene than there is between the two enantiomers in the previous epoxide (-5.72 KJ/mol in comparison with -20.22 KJ/mol). This means that the excess of the S,R enantiomer over the R,S enantiomer is less pronouced with an ee value of 81.92%. This corresponds well with theory as the Shi catalyst has been determined to be selective for trans olefins rather than cis olefins.
The ee value shows that the S,R enantiomer is formed preferentially, again due to the fact that it has a lower computed transition state. This matches well with the literature observations in which the S,R enantiomer was in fact formed in excess. However the actual value that was obtained for this was much lower than the computed value- 32%.[7]
However the absolute values are different to the experimentally determined ones and this can be explained by the limitations of the computational experiment. It was found in another computational experiment that the ΔG‡ was constantly over approximated when the quantum mechanical approximation was used and therefore they decided to reduce all of the values by one third. This would lower all of the enantiomeric excess values by a significant amount as there is an exponential relationship and therefore give more realistic results than were obtained in this experiment.
Jacobsen Catalyst
| Jacobsen Catalyst Transition State Energies for Trans-β-Methylstyrene Oxide | ||
|---|---|---|
| R,R | S,S | |
| TS1 | -3383.253816 | -3383.262481 |
| TS2 | -3383.254344 | -3383.257847 |
| Jacobsen Catalysed Epoxidation of Trans-β-Methylstyrene | ||
|---|---|---|
| Enantiomer formed | ||
| R,R | S,S | |
| Transition State Energy (AU) | -3383.254344 | -3383.262481 |
| Transition State Energy G‡(KJ/mol) | -8882734.28 | -8882755.64 |
| Energy Difference ΔG‡ (KJ/mol) | -21.36 | |
| Enantiomeric Excess | 99.96% | |
| Jacobsen Catalyst Transition State Energies for Dihydronaphthalene Oxide | ||
|---|---|---|
| R,S | S,R | |
| TS1 | -3421.359354 | -3421.369033 |
| TS2 | -3421.359499 | -3421.361580 |
| Jacobsen Catalysed Epoxidation of Dihydronaphthalene | ||
|---|---|---|
| Enantiomer formed | ||
| R,S | S,R | |
| Transition State Energy (AU) | -3421.359499 | -3421.369033 |
| Transition State Energy G‡ (KJ/mol) | -8982779.365 | -8982804.396 |
| Energy Difference ΔG‡ (KJ/mol) | -25.03 | |
| Enantiomeric Excess | 99.99% | |
The reactions of the alkenes with the Jacobsen catalyst have also been computed. The enantiomeric excess values obtained show that the S,S enantiomer is formed preferentially for the trans-β-methylstyrene oxide with a 99.96% ee value and that the S,R enantiomer is formed preferentially for the dihydronaphthalene oxide with a 99.99% ee value. This is again due to the stability of the transition states of these enantiomers in comparison with the transition states of their other respective enantiomeric forms. There is an agreement with literature with the dihydronapthalene oxide having an ee value of around 85% in favour of the S,R enantiomer. Unfortunately literature values could not be obtained for the trans-β-methylstyrene oxide. [18]. The deviations from literature could be attributed to the reasons described above.
However it was found experimentally that Jacobsen's catalyst is more selective for cis rather than trans alkenes. This is not obvious when looking at the computation results as the ΔG‡ values for both alkenes is very similar and also very high. Due to the exponential relationship it is obvious that a high e.e value would be calculated for both which does not imply that the Jacobsen catalyst has selectivity for cis olefins. These results show that the the quantum mechanical approximation did not work as well for Jacobsen as it did for the Shi catalyst. This could be a consequence of the fact that the mechanism for the epoxidation is well known for the Shi catalyst but it is not as well understood for the Jacobsen and so cannot be computed to a good degree of accuracy.
It can be concluded that whilst the computational models are of value, they cannot accurately predict the enantiomeric excess values for particular reactions. This means that the quantum mechanical approximation needs to be refined to make it a powerful tool in the future. However, the values that are predicted are also useful in that they correctly calculate the enantiomer that will form in excess.
NCI and QTAIM Analysis
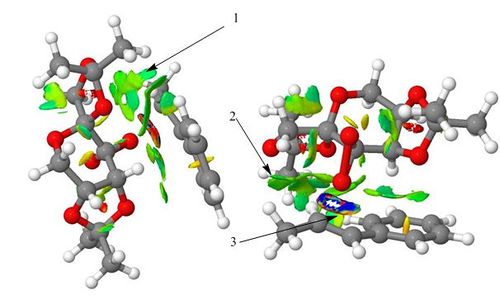
This is the non covalent interactions analysis diagram for the lowest energy transition state in the formation of the R,R enantiomer of trans-β-methylstyrene oxide using the Shi Catalyst. As it is the lowest energy transition state it should have the most amount of favourable interactions within the active site. This is clearly shown by the different colours used in different parts of the diagram.
1) This part of the active site has a light blue colour which indicates a fairly strong attractive interaction between the trans-β-methylstyrene and the catalyst. This attraction could be the result of an interaction between the hydrogen atoms of the trans-β-methylstyrene and the lone pairs on the oxygen atoms of the catalyst. This hydrogen bond interaction is stabilising and consequently lowers the energy of the structure. This is a good indicator of the spiro transition state.
2) This part of the active site has a light green colour which indicates a weakly attractive interaction. This could be the result of van der Waals (dispersion) forces which occur when non bonded atoms interact at a distance. This can be the interaction between hydrogen atoms and other hydrogen, carbon or oxygen atoms or between two carbon atoms in the structure that we are considering. The optimum distance for these interactions is above 2.1Ă and below 3.2Ă and can become repulsive at distances that are shorter than this.
3) This part of the active site indicates a bond forming in the transition state and is also known as a half covalent interaction. As it is the transition state it has a variety of different attractive and repulsive interactions and so shows all of the different colours.
Overall the largest amount of attractive interactions in the active site occur between the methyl part of the trans-β-methylstyrene and oxygen atoms of the catalyst which shows that this is an optimal orientation for the pair of molecules. This interaction could not happen if the catalyst was orientated in a different way to the alkene.
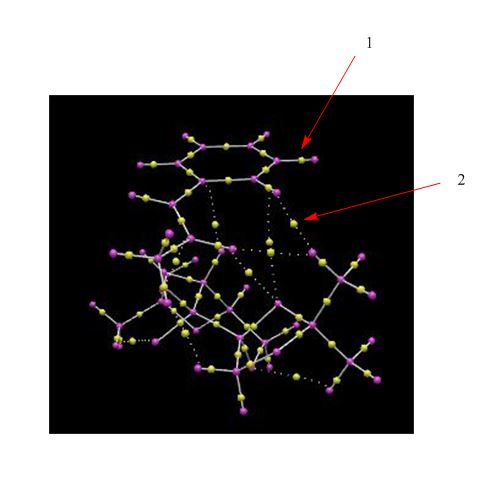
This diagram represents the electron density distribution in the covalent regions of the molecule. The yellow spheres represent the bond critical point which represents a region where the derivative of the electron density is zero and show the interactions between the catalyst more clearly than in the NCI analysis.
1) This region of the diagram shows a BCP within a covalent bond between a carbon and a hydrogen atom. The BCP lies closer to the hydrogen atom than the carbon atom which reflects the different electronegativities between the two atoms and how more of the electron density would lie close to the nucleus of the carbon atom. Elsewhere in the structure when the BCP lies in a homonuclear covalent bond it lies in the middle of the bond as there is an equal distribution of electron density.
2) This part of the structure corresponds to a weak non covalent BCP which in this case is a dispersion interaction between two non-bonded hydrogen atoms. As expected, the BCP lies in the middle of the two atoms.
New Molecule
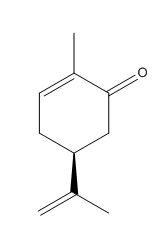
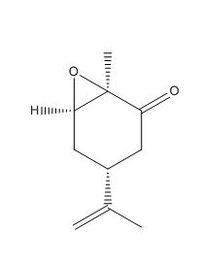
The new molecule that I have chosen to discuss is commonly known as (S)-carvone oxide. It is the epoxide of the alkene S-(+)-carvone which is commonly known to be a naturally occuring enantiomer. The epodiation of carvone is a very well known reaction that is also very enantioselective. It would be interesting to see the computed result of the transition states and overall stereochemistry of the molecule. This is because it would clearly be able to show exactly where the benefits and limitations of computational chemistry lie as the literature outcome is very well established. This would help in refining the quantum mechanical approximations that are used.
References
<references> [1]
- ↑ 1.0 1.1 D. Skala, J. Hanika, Petroleum and coal, 2003, 45, 3-4, 105-108, http://www.vurup.sk/sites/vurup.sk/archivedsite/www.vurup.sk/pc/vol45_2003/issue3-4/pdf/05.pdf (Accessed 1/12/14)
- ↑ 2.0 2.1 G.Liu, Z. Mi, L. Wang, X. Zhang, Ind. Eng. Chem. Res. 2005, 44, 3846-3851, DOI:10.1021/ie0487437
- ↑ 3.0 3.1 3.2 H. S. Rzepa , Conformational Analysis, 2010-2014, online: http://www.ch.ic.ac.uk/local/organic/conf/ (Accessed 3/12/14)
- ↑ 4.0 4.1 W. F. Maier, P. Von Rague Schleyer, J. Am. Chem. Soc., 1981, 103, 1891. DOI:10.1021/ja00398a003
- ↑ 5.0 5.1 5.2 L. Paquette, N. A. Pegg, D. Toops, G. D. Maynard, R. D. Rogers, J. Am. Chem. Soc., 1990, 112, 277-283, DOI: 10.1021/ja00157a043
- ↑ 6.0 6.1 T. Linker Angew. Chem. Ini. Ed. Engl. 1997, 36, No. 19 Available from: http://onlinelibrary.wiley.com/doi/10.1002/anie.199720601/pdf (Accessed 5/12/14)
- ↑ 7.0 7.1 7.2 7.3 7.4 M. Frohn, Y. Shi, Chiral Ketone-Catalyzed Asymmetric Epoxidation of Olefins, Synthesis, No. 14, 1979–2000, Thieme Stuttgart, New York, 2000, http://isites.harvard.edu/fs/docs/icb.topic93502.files/Lectures_and_Handouts/02-Handouts/Shi_epoxidation_SynLet.pdf (Accessed 5/12/14)
- ↑ 8.0 8.1 8.2 W. Dai, S. Shang, B, Chen, G. Li, L. Wang, L. Ren, S. Gao, J. Org. Chem. 2014, 79, 6688−6694, DOI:10.1021/jo501178k
- ↑ 9.0 9.1 9.2 P.C.B. Page, P. Parker, B.R. Buckley, G.A Rassias, D. Bethell, Tetrahedron, 2009, 65, 2910-2915, DOI:10.1016/j.tet.2009.02.007
- ↑ 10.0 10.1 Shi, Yian US Patent: US6348608 B1, 2002
- ↑ 11.0 11.1 P. Besse, M.F. Renard, H. Veschambre, Tetrahedron: Asymmetry, 1994, 5 Issue 7, 1249–1268 DOI:10.1016/0957-4166(94)80167-3
- ↑ 12.0 12.1 Z.X. Wang, L. Shu, M. Frohn, Y. Tu, Y. Shi, Org. Synth. 2003, 80 9, DOI: 10.15227/orgsyn.080.0009
- ↑ 13.0 13.1 H. Sasaki1, R. Irie, T. Hamada, K. Suzukia, T. Katsuki, Tetrahedron , 1994, 50, 11827–11838 DOI:10.1016/S0040-4020(01)89298-X
- ↑ 14.0 14.1 D. R. Boyd, N. D. Sharma, R. Agarwal, N. A. Kerley, R. A. S. McMordie, A. Smith, H. Dalton, A. J. Blacker, G. N. Sheldrake. Chem. Commun., 1994, 14, 1693-1694 DOI: 10.1039/C39940001693
- ↑ 15.0 15.1 Studying Chirality with Vibrational Circular Dichroism, http://www.gaussian.com/g_whitepap/vcd.htm, (Accessed 5/12/14)
- ↑ 16.0 16.1 16.2 S.T. Schneebeli, M.L. Hall, R. Breslow, R. Friesner, J Am Chem Soc. 2009 131 11, 3965–3973 DOI:10.1021/ja806951r
- ↑ 17.0 17.1 Y. Tu , Z. Wang , and Y. Shi, J. Am. Chem. Soc. , 1996, 118, 9806–9807, DOI: 10.1021/ja962345g
- ↑ 18.0 18.1 J. Hanson, Journal of Chemical Education, 2001, 789, 1267, http://www.csun.edu/~mogawa/files/411/j_chem_ed_2001_9_1266.pdf, (Accessed 6/12/14)

