Rep:Title=Mod:ms3412
EX3 Analysis
BH:B3LYP/3-21G
Optimisation log file here
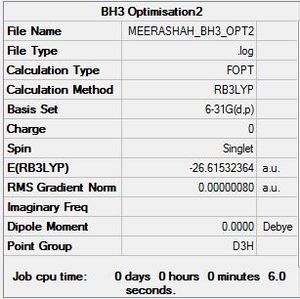
BH3:B3LYP/6-31G
Optimisation log file here
| summary data | convergence | Jmol | |||
|---|---|---|---|---|---|
|
Item Value Threshold Converged? Maximum Force 0.000002 0.000015 YES RMS Force 0.000001 0.000010 YES Maximum Displacement 0.000006 0.000060 YES RMS Displacement 0.000004 0.000040 YES Predicted change in Energy=-1.494969D-11 |
|
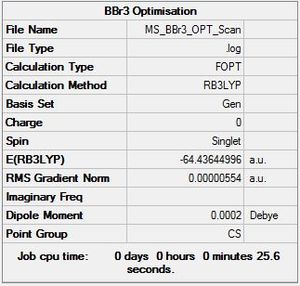
BBr3:B3LYP/GEN
Optimisation log file DOI:10042/90194
| summary data | convergence | Jmol | |||
|---|---|---|---|---|---|
|
Item Value Threshold Converged? Maximum Force 0.000011 0.000450 YES RMS Force 0.000007 0.000300 YES Maximum Displacement 0.000047 0.001800 YES RMS Displacement 0.000031 0.001200 YES |
|
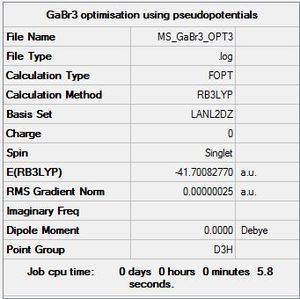
GaBr3:B3LYP/LANL2DZ
Optimisation log file DOI:10042/110734
| summary data | convergence | Jmol | |||
|---|---|---|---|---|---|
|
Item Value Threshold Converged? Maximum Force 0.000000 0.000015 YES RMS Force 0.000000 0.000010 YES Maximum Displacement 0.000003 0.000060 YES RMS Displacement 0.000002 0.000040 YES |
|
Geometry Comparison
| BH3 | BBr3 | GaBr3 | |
|---|---|---|---|
| r(E-X) | 1.19 Å | 1.93 Å | 2.35 Å |
| θ(X-E-X) | 120.0 Å | 120.0 Å | 120.0 Å |
When comparing the geometries of these molecules, it can be seen that they all have the same bond angles regardless of the atom or ligand. This is expected for the molecules of group 3 elements which are all electron deficient and all form trigonal planar structures in their monomeric form. The ligands that are being analysed are similar in the fact that both hydrogen and bromine have one unpaired electron in their valence orbitals and they both require one electron to fill their valence orbitals. Therefore they both bond to boron in a similar way- by forming covalent bonds with the boron. However the difference that a change of ligand makes is apparent when comparing the bond lengths. For example when the ligand is changed from hydrogen to bromine, the bond length increases. This can be explained in many ways. Firstly if a purely covalent argument is invoked, then the length of the covalent bond would be the sum of both of the atomic radii. This argument works well for the B-H bond in which the computed and predicted are the same. However the the value computed for the B-Br bond is smaller than the expected value of 2.04 Å. This means that there are other factors involved in determining bond length. Bond length is largely determined by the orbital overlap of the constituent atoms of the bond. As the bond length of the B-H bond is shorter it can be seen that the overlap between the hydrogen and boron orbitals is better due to a better match in orbital energies and size. This is because they are closer together in the periodic table and have fairly similar electronegativity values (2.1 vs 2.04). In comparison, bromine has larger and more diffuse orbitals and so has a weaker overlap. The shorter than expected length of bromine can be explained by the pi donating ability of the bromine atoms into the electron deficient boron centre. This increases the bond order of the bond and consequently shortens it. This cannot happen in the B-H bond. [1]
Changing the central element also changes the bond length. For example changing the central element from boron to gallium also increased the bond length. Boron and gallium are both in the same group however they are different in their size. Boron is a second period element whereas gallium is a fourth period element. Therefore the atomic radius of gallium is bigger and it has larger and more diffuse valence orbitals, weakening the overlap. Both of these factors increase the bond length, as previously discussed. The Lewis acidity of the gallium centre has also decreased and so the effect of electron donation from the bromine atoms becomes less significant and does not shorten the bond length to a great extent.
A bond is a favourable interaction which leads to the formation of a chemical species that has a combined lower energy overall than when the constituent elements are separate. The bond is the result of electrostatic interactions either between oppositely charged species or the result of an instantaneous or permanent dipole. In terms of orbital interactions, a bond can further be described as an area of high electron density between the bonding orbitals. An example of a strong bond is a covalent bond and typically has energies in the hundreds (KJ/mol). This means that is a large amount of electron density within the internuclear region which would take a large energy input to break. An example of a bond of medium strength is a hydrogen bond. It is not as strong as it is a type of intermolecular bond whereas a covalent bond is an intramolecular bond. Hydrogen bonds have energies ranging up to 20 (KJ/mol). A type of weak bond is an induced dipole-induced dipole bond which typically have energies that are less than 1 (KJ/mol). A hydrogen bond is stronger than a dipole-dipole bond due to the directional nature of the bond. There is also the involvement of valence electrons which gives the bond some covalent character.[2]
In some structures gaussview does not draw in the bonds where we expect as gaussview will only formally draw a bond when the distance is less than or equal to a pre-determined value. If the interaction between two atoms is a larger distance than this value due to a weaker interaction for example, then a bond will not be drawn even if it does exist.
BH3:B3LYP/6-31G(d,p)
Frequency file: here
| summary data | low modes |
|---|---|

|
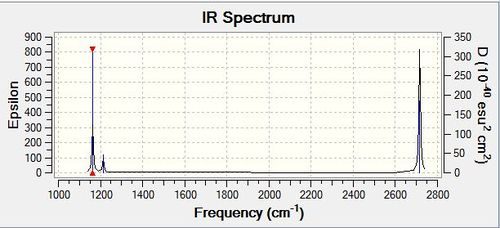
Low frequencies --- -10.1940 -10.1821 -3.1776 0.0004 0.0579 0.4920 Low frequencies --- 1162.9850 1213.1461 1213.1463 |
Vibrational spectrum for BH3
| wavenumber | Intensity | IR active? | type |
| 1163 | 93 | yes | bend |
| 1213 | 14 | very slight | bend |
| 1213 | 14 | very slight | bend |
| 2583 | 0 | no | stretch |
| 2716 | 126 | yes | stretch |
| 2716 | 126 | yes | stretch |
In the BH3 molecule, according to the 3N-6 rule, there is the possibility of having six different vibrational modes. There are fewer vibrational peaks than there are vibrations as one of the stretches (2583) is not IR active as there is not overall change in dipole moment as the emitted photon has the same energy. In order for the stretch to be seen Raman spectroscopy would have to be used. Two of the sets of vibrations are also degenerate and so would only be seen as one peak per set.
GaBr3:B3LYP/6-31G(d,p)
Frequency file: DOI:10042/90588
| summary data | low modes |
|---|---|

|
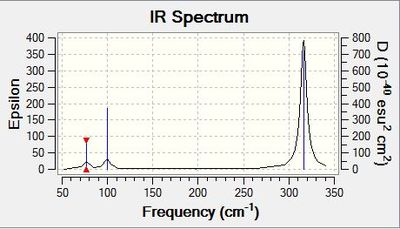
Low frequencies --- -1.4877 -0.0015 -0.0002 0.0096 0.6540 0.6540 Low frequencies --- 76.3920 76.3924 99.6767 |
Vibrational spectrum for GaBr3
| wavenumber | Intensity | IR active? | type |
| 76 | 3 | very slight | bend |
| 76 | 3 | very slight | bend |
| 100 | 9 | very slight | bend |
| 197 | 0 | no | stretch |
| 316 | 57 | yes | stretch |
| 316 | 57 | yes | stretch |
The values of the frequencies are over 1000 wavenumbers larger for BH3 than for GaBr3. This indicates that the B-H bends and stretches have a larger energy. This means that the B-H bonds are stronger than the Ga-Br bonds. This is consistent with the bond length data with B-H having a shorter bond than Ga-Br. Bond length is related to bond strength and so a shorter bond means a higher bond strength.
The relative frequency of the BH3 umbrella motion is different to that of the GaBr3. In the BH3 molecule the umbrella motion occurs at the lowest frequency whereas in the GaBr3 molecule the umbrella motion occurs at the third lowest frequency. The displacements of both of the central atoms and the ligands are also very different in both molecules. In the BH3 molecule the ligands are displaced more than the central boron atom with the displacements being -0.57 in comparison to 0.16 in the z direction respectively. However, in GaBr3 the displacements of the bromine ligands compared to the central gallium atom are -0.26 and 0.89 respectively. The difference has arisen due to the difference in size between the ligands and the central atom. In BH3 the ligands are much lighter than the central atom and so have a greater displacement. In GaBr3 the ligands are heavier than the central atom and so have a smaller displacement. The GaBr3 frequencies are lower overall due to the frequency being inversely proportional to the reduced mass of the system. Gallium and bromine are much larger than boron and hydrogen which means that the frequencies will be lower for the GaBr3 molecule. The intensity of the BH3 vibrations is higher than the GaBr3 vibrations due the relationship between intensity and dipole moment. There is a greater change in dipole in BH3 and so the intensity of the vibrations is higher.
The same method and basis set must be used for both the optimisation and frequency analysis calculations otherwise a direct conclusion of the energy minimum of a molecule cannot be made. This is because vibrational frequencies are calculated by finding whether the stationary point is a minimum or a maximum by determining the second derivatives of the energy. This calculation uses the nuclear co-ordinates of the molecule and takes into consideration the mass of the atoms.This calculation is only valid when using the co-ordinates gained from a particular basis set and so it cannot be calculated from a molecule optimised from another basis set. [3]
By carrying out a frequency analysis, the structure of the optimised molecule can be classified as a minimum, a transition or just a particular conformation. If all of the frequencies computed from the frequency analysis are positive then the second derivative of the curve is positive and an energy minimum has been reached. If one of the frequencies is negative than a point of inflection is found and a transition structure is observed. The frequency analysis helps to show whether the optimisation has worked or not. It also helps to provide data which can be compared to experimentally observed values.
The low frequencies are the motions of the centre of mass and they should be as close to zero as possible. This is due to the Born Oppenheimer approximation in which it is assumed that the heavy nuclei do not move in comparison to the fast motion of the electrons.
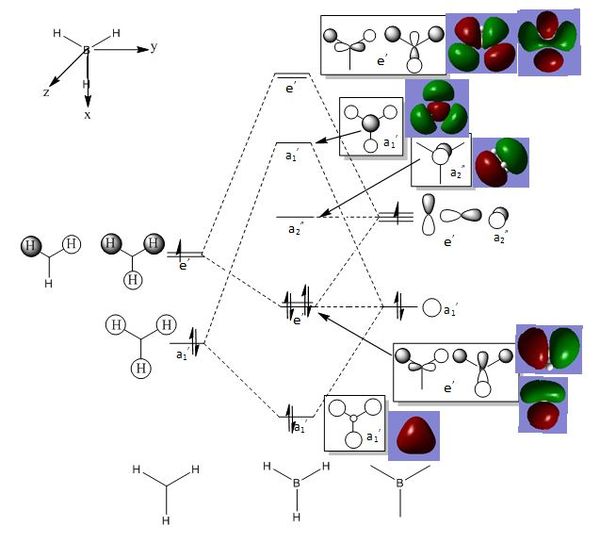
BH3 Molecular Orbital Analysis
Energy File: DOI:10042/90775
There are no significant differences between the real and LCAO MOs which means that qualitative MO theory is a useful tool to predict experimentally observed energies.Ir can be seen as fairly accurate and so is a valid method to use.
NH3 Analysis
Optimisation
Optimisation log file here
| summary data | convergence | Jmol | |||
|---|---|---|---|---|---|

|
Item Value Threshold Converged? Maximum Force 0.000006 0.000015 YES RMS Force 0.000004 0.000010 YES Maximum Displacement 0.000012 0.000060 YES RMS Displacement 0.000008 0.000040 YES |
|
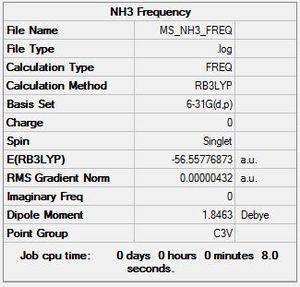
Frequency
Frequency file: here
| summary data | low modes |
|---|---|
|
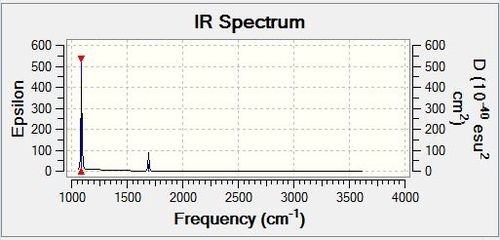
Low frequencies --- -0.0095 -0.0016 0.0008 8.3493 8.3496 9.5238 Low frequencies --- 1089.2453 1693.9270 1693.9270 |
Vibrational spectrum for NH3
| wavenumber | Intensity | IR active? | type |
| 1089 | 145 | yes | bend |
| 1694 | 14 | very slight | bend |
| 1694 | 14 | very slight | bend |
| 3461 | 1 | no | stretch |
| 3590 | 0 | no | stretch |
| 3590 | 0 | no | stretch |
NBO Analysis
Energy File: DOI:10042/93427
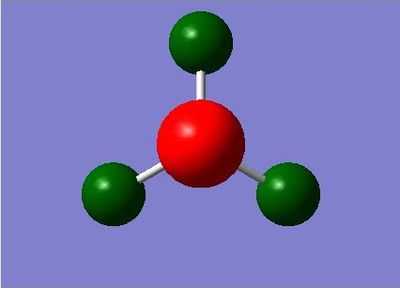
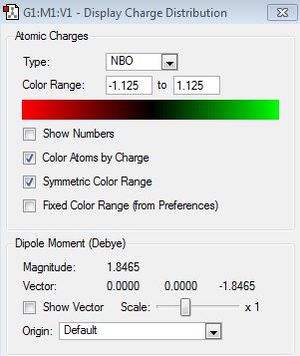
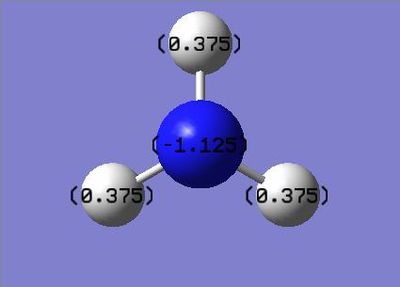
| Charge Distribution of NH3 | Charge | NBO Charge of NH3 |
|---|---|---|
|
|
|
NH3BH3 Analysis
Optimisation
Optimisation log file here
| summary data | convergence | Jmol | |||
|---|---|---|---|---|---|

|
Item Value Threshold Converged? Maximum Force 0.000002 0.000015 YES RMS Force 0.000001 0.000010 YES Maximum Displacement 0.000026 0.000060 YES RMS Displacement 0.000009 0.000040 YES |
|
Frequency
Frequency file: here
| summary data | low modes |
|---|---|

|
Low frequencies --- -5.3555 -0.0010 -0.0007 0.0004 1.2444 2.3257 Low frequencies --- 263.3883 632.9590 638.4161 |
Vibrational spectrum for NH3BH3
Energy Calculations
E(NH3)= -56.55776873
E(BH3)= -26.61532364
E(NH3BH3)= -83.22468906
ΔE=E(NH3BH3)-[E(NH3)+E(BH3)] = -0.05158823
= -135.44 KJ/mol
This energy is in the hundreds and so corresponds to a strong bond which is likely to be covalent.
Comparison of selected 'onium' cations
N(CH3)4 Analysis
Optimisation
Optimisation (no symmetry) log file DOI:10042/101910
| summary data | convergence | Jmol | |||
|---|---|---|---|---|---|

|
Item Value Threshold Converged? Maximum Force 0.000001 0.000015 YES RMS Force 0.000000 0.000010 YES Maximum Displacement 0.000059 0.000060 YES RMS Displacement 0.000017 0.000040 YES |
|
Optimisation (symmetry) log file DOI:10042/101956
| summary data | convergence | Jmol | |||
|---|---|---|---|---|---|

|
Item Value Threshold Converged? Maximum Force 0.000012 0.000015 YES RMS Force 0.000003 0.000010 YES Maximum Displacement 0.000036 0.000060 YES RMS Displacement 0.000014 0.000040 YES |
|
Frequency
Frequency file: DOI:10042/101982
| summary data | low modes |
|---|---|

|
Low frequencies --- -0.0005 0.0007 0.0007 21.3472 21.3472 21.3472 Low frequencies --- 188.5599 292.6745 292.6745 |
P(CH3)4 Analysis
Optimisation
Optimisation (no symmetry) log file DOI:10042/104112
| summary data | convergence | Jmol | |||
|---|---|---|---|---|---|

|
Item Value Threshold Converged? Maximum Force 0.000000 0.000015 YES RMS Force 0.000000 0.000010 YES Maximum Displacement 0.000031 0.000060 YES RMS Displacement 0.000012 0.000040 YES |
|
Optimisation (symmetry) log file DOI:10042/104161
| summary data | convergence | Jmol | |||
|---|---|---|---|---|---|

|
Item Value Threshold Converged? Maximum Force 0.000007 0.000015 YES RMS Force 0.000002 0.000010 YES Maximum Displacement 0.000030 0.000060 YES RMS Displacement 0.000007 0.000040 YES |
|
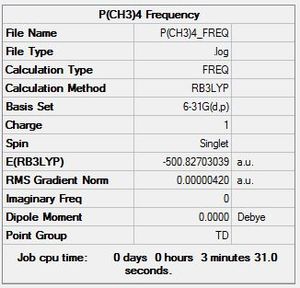
Frequency
Frequency file: DOI:10042/104197
| summary data | low modes |
|---|---|
|
Low frequencies --- -0.0027 -0.0017 0.0027 24.7543 24.7543 24.7543 Low frequencies --- 160.0212 194.7625 194.7625 |
S(CH3)3 Analysis
Optimisation
Optimisation (no symmetry) log file DOI:10042/104120
| summary data | convergence | Jmol | |||
|---|---|---|---|---|---|

|
Item Value Threshold Converged? Maximum Force 0.000000 0.000015 YES RMS Force 0.000000 0.000010 YES Maximum Displacement 0.000050 0.000060 YES RMS Displacement 0.000016 0.000040 YES |
|
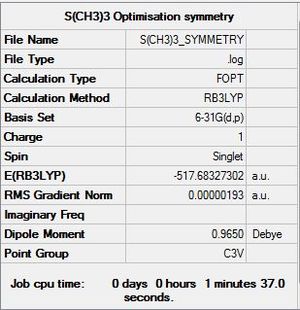
Optimisation (symmetry) log file DOI:10042/104175
| summary data | convergence | Jmol | |||
|---|---|---|---|---|---|
|
Item Value Threshold Converged? Maximum Force 0.000003 0.000015 YES RMS Force 0.000001 0.000010 YES Maximum Displacement 0.000029 0.000060 YES RMS Displacement 0.000013 0.000040 YES |
|
Frequency
Frequency file: DOI:10042/104211
| summary data | low modes |
|---|---|

|
Low frequencies --- -8.2006 -7.8399 -7.8367 0.0025 0.0036 0.0088 Low frequencies --- 161.9396 199.6261 199.6261 |
Geometry Comparison
| N(CH3)4 | P(CH3)4 | S(CH3)3 | |
|---|---|---|---|
| r(C-X) | 1.51 Å | 1.82 Å | 1.82 Å |
| θ(X-E-X) | 109.5 Å | 109.5 Å | 102.7 Å |
The structures of the nitrogen and phosphorus based cations are similar as they both have a tetrahedral point group and consequently have the same bond angle between the carbon-hetero atom-carbon bond. This is explained by the fact that they are both group 15 elements and consequently have similar reactivity. The sulphur based cation has also undergone a similar alkylation reaction but it has a different point group as it is in a different group giving it a different kind of structure. The bond angle in the sulphonium cation is 102.7 which is less than expected for the trigonal pyramidal structure. This angle would normally be 107 which shows that there is an increased amount of electron repulsion from the lone pair electron density which forces the bonds to be closer together.
Each of the C-X bonds in their respective structures are the same length. This means that they are all equivalent covalent bonds even though one of the bonds in each would mechanistically be described as a dative bond. Even though the bond lengths are uniform in each structure, they vary between structures. The shortest bond is the C-N bond which can be explained by the better overlap between the orbitals of carbon and nitrogen. They are neighbouring second row elements and so are closely matched in energy and size. The 2s orbitals of both elements are able to mix in this molecule and so there is a greater extent of mixing overall. This results in extra stability and consequently a shorter bond. The C-P and C-S bond lengths are very similar with the C-P bond being slightly shorter. This shows that the overlap is not as strong as in the ammonium cation. This can be rationalised by the fact that the orbitals of sulphur and phosphorus are also larger and more diffuse which results in a weaker overlap. There could also be an increased distance between the orbitals which results in less covalent mixing. This is despite the fact that the electronegativies of sulphur and phosphorus are more closely matched to carbon.
MO and NBO Analysis
Energy File N(CH3)4: DOI:10042/110602
Energy File P(CH3)4: DOI:10042/110606
Energy File S(CH3)3: DOI:10042/110608
MO Analysis
| MO of N(CH3)4 | |
|---|---|
| 1 | 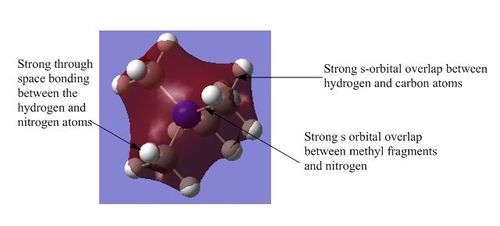
|
| 2 | 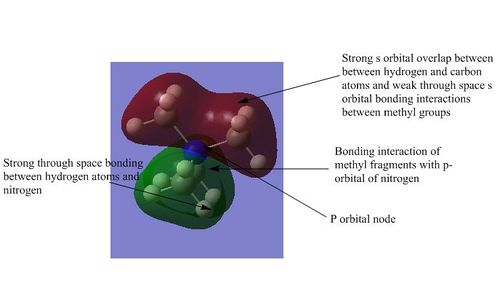
|
| 3 | 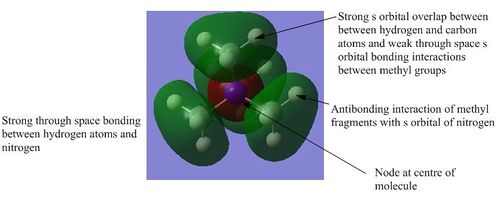
|
| 4 | 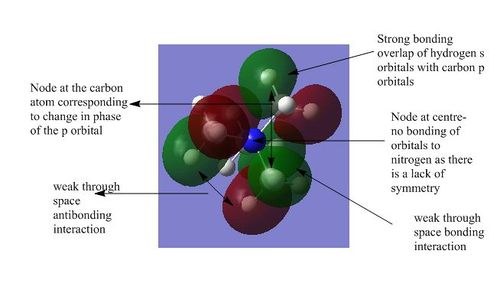
|
| 5 | 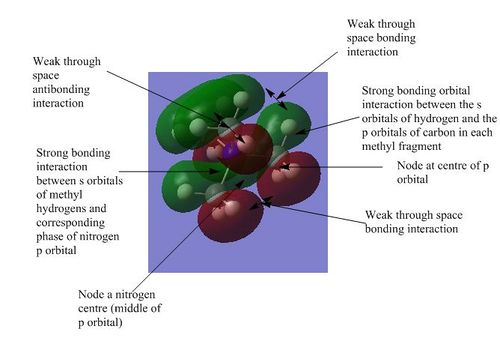
|
1) This the lowest energy non-core orbital as there are strong bonding interactions. There is strong s orbital overlap within the methyl groups and also between the s orbitals of the methyl groups and the s orbital of the nitrogen atom. There is also a large amount of strong through space bonding between the hydrogen atoms and the electronegative nitrogen atom. This is a favourable hydrogen bonding interaction which stabilises the molecule by lowering the energy. The molecular orbital has a slight concave shape due to the electron density being drawn to the central nitrogen atom which increases the strength of the through space interactions. There are no nodes in this molecular orbital and so there is no anti-bonding character and so the overall structure is strongly bonding.
2) This is the second lowest energy non-core orbital and is part of a set of three degenerate orbitals. These degenerate orbitals arise from the interaction of the s orbitals of the methyl fragments with the three different p orbitals of the nitrogen atom. There is a lot of strongly bonding overlap between the orbitals and also strong through space interactions between the hydrogen and nitrogen atom. There are weak through space interactions between the s orbitals of the hydrogen atoms in different methyl fragments. However the p-orbital contains a node and while this has a small effect as it is within an atom, it still introduces some anti-bonding character to the molecular orbital and therefore raises its energy in comparison to the previous orbital. The overall structure is strongly bonding.
3) This is the anti-bonding equivalent to the first orbital. There are strong bonding interactions between the carbon and hydrogen atoms of the individual methyl fragments. However there are strong anti-bonding interactions between the s orbitals of these fragments and the anti-bonding s orbital of the nitrogen atom. The through space interactions are the same as those described in the previous structures and there are also weak through space anti-bonding interactions between the s orbitals of the hydrogen and the s orbital of the nitrogen.
4) This molecular orbital is also part of a set of three degenerate orbitals. It shows the strong bonding interactions between one of the p orbitals of the carbon atom and the s orbital of the attached hydrogen atom. The phase of the s orbital matches the phase of the part of the p orbital that it is bonded to. There are also strong through space anti-bonding interactions between the methyl fragments due to the difference in phase. Anti-bonding character has been introduced through the nodes in the p orbitals and also the nodes between the methyl fragments. However the through space anti-bonding interaction is counterbalanced to an extent by the through space bonding interaction due to the highly symmetric nature of the molecule. Overall the molecule is weakly bonding.
5) This molecular orbital is also part of a set of three degenerate orbitals and forms the HOMO of the molecule. It shows the strong bonding interactions between one of the p orbitals of the carbon atom and the s orbital of the attached hydrogen atom. There are a lot of through space bonding and anti-bonding interactions but they can be considered to cancel due to the highly symmetric nature of the molecule. Anti-bonding character has also been introduced by the large number of intranuclear nodes which means that the molecule is weakly bonding overall.
NBO Analysis
| Charge Distribution of N(CH3)4 | Charge | NBO Charge of N(CH3)4 |
|---|---|---|
|

|
|
| Charge Distribution of P(CH3)4 | Charge | NBO Charge of P(CH3)4 |
|---|---|---|
|
|
|
| Charge Distribution of S(CH3)3 | Charge | NBO Charge of S(CH3)3 |
|---|---|---|

|

|

|
| N(CH3)4 | P(CH3)4 | S(CH3)3 | |
|---|---|---|---|
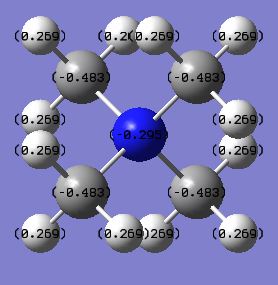
| X Charge | -0.295 | 1.6667 | 0.917 |
| C Charge | -0.483 | -1.060 | -0.845 |
| H Charge | 0.269 | 0.298 | 0.297 |
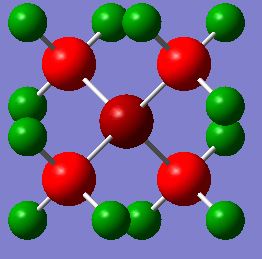
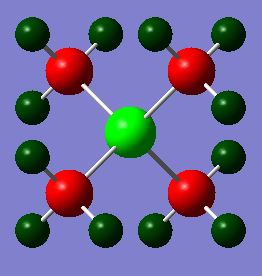
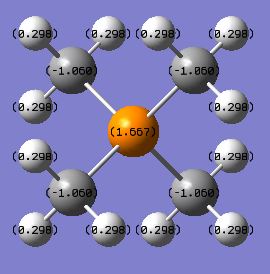
The charge distribution varies greatly across this trio of cations even though they all have formal charges of +1. This is due to the nature of the different heteroatoms. Nitrogen has the most negative charge in comparison to the other heteroatoms which can be justified by the fact that it is the most electronegative atom. Phosphorus is the most electropositive atom and consequently has the most positive charge in the distribution. The heteroatom in all of the cases is more positive than the carbon atom that it is bonded to. This can be explained by the fact in the formation of the cation, the heteroatom has essentially given electrons to a carbon atom from its lone pair so that a covalent bond can be formed. Therefore the heteroatom has transferred negative charge to the carbon which in turn leaves it as more electron deficient than it would be in a trimethylamine molecule as the electron density is located further away from the nucleus. The hydrogen atom has a positive charge in all of the cations as the C-H bond is polarised to an extent. This means that the carbon is drawing electrons closer to its own nucleus and leaving the hydrogen with a more positive charge. This means that the carbon is contributing more to the bonding orbitals than hydrogen is.
| N(CH3)4 | P(CH3)4 | S(CH3)3 | |
|---|---|---|---|
| C contribution | 0.3365 | 0.5957 | 0.4867 |
| X contribution | 0.6635 | 0.4043 | 0.5133 |
The carbon contribution to the C-X bond is the smallest in the C-N bond and is largest in the C-P bond. The way that this can be explained is by the electronegativities of the atoms involved. Nitrogen and carbon have the greatest electronegativity difference and hence have the biggest difference in the contribution of each atom respectively. Nitrogen is the more electronegative and therefore its orbitals contribute more to the bonding orbitals and these are where more of the electron density can be found. This differs to the charge distribution in which carbon has a more negative charge due to the reasons described previously. Even though carbon has a more negative charge in the distribution, more of the electron density that is responsible for this negative charge has come from the nitrogen atom.
The carbon contribution is increased in the other cations as the electronegativities become more closely matched between the heteroatom and the carbon. It is largest in the C-P bond as carbon is more electronegative than phosphorus. This is in agreement with the charge distribution of this cation where the carbon is more negative than the central phosphorus atom. This is explained by the ability of the carbon atom to pull electrons towards its nucleus which polarises the bond. The carbon contribution is almost 50:50 with the sulphur in the sulphonium cation as the electronegativities of both elements are very similar. The reason for the sulphur atom having a more positive charge than the carbon is due to the transfer of electrons by the lone pair of the sulphur as described previously. The largest distribution of charge occurs in the ammonium cation as the charge is able to be delocalised. This is not possible in the phosphonium cation where the positive charge is localised on the phosphorus atom due to poor orbital overlap.
The traditional description in which the positive charge is drawn on the nitrogen cannot be described as valid. The positive charge represents the fact that the molecule has a net positive charge due to the addition of a positive fragment to the neutral trimethylamine and it is only useful for describing the charge of the molecule overall and not the charge of the individual atoms. This is because electronegativity has not been taken into account when drawing the formal charge. Once electronegativity is considered, then the polarisation of the bond is important in determining the distribution of charge. The nitrogen experiences a build-up of electron density around its nucleus in order to compensate for the positive charge. This in turn leads to a decrease in electron density around the carbon atoms in the methyl fragments which is counteracted by polarisation of the C-H bond. Therefore there is an overall shift in electron density towards the nitrogen atom with the positive charge residing on the methyl fragments. This results in a neutral nitrogen atom with the positive charge being shared equally among the methyl fragments in a highly symmetrical fashion. [4]
Influence of ligands on selected onium cations
N(CH3)3(CH2OH) Analysis
Optimisation
Optimisation file DOI:10042/104787
| summary data | convergence | Jmol | |||
|---|---|---|---|---|---|
|
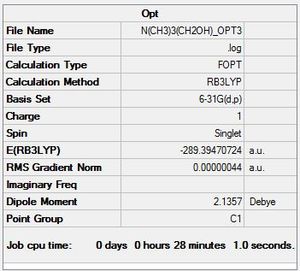
Item Value Threshold Converged? Maximum Force 0.000001 0.000015 YES RMS Force 0.000000 0.000010 YES Maximum Displacement 0.000013 0.000060 YES RMS Displacement 0.000004 0.000040 YES |
|
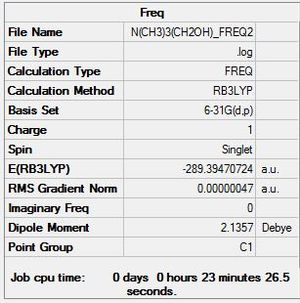
Frequency
Frequency file: DOI:10042/104789
| summary data | low modes |
|---|---|
|
Low frequencies --- -8.4538 -5.0228 -1.0901 -0.0012 -0.0011 -0.0009 Low frequencies --- 131.1055 213.4680 255.7128 |
N(CH3)3(CH2CN) Analysis
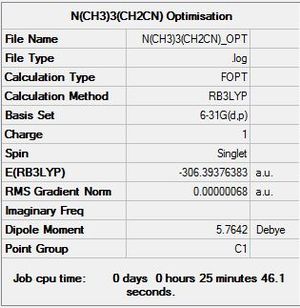
Optimisation
Optimisation log file DOI:10042/104492
| summary data | convergence | Jmol | |||
|---|---|---|---|---|---|
|
Item Value Threshold Converged? Maximum Force 0.000001 0.000015 YES RMS Force 0.000000 0.000010 YES Maximum Displacement 0.000044 0.000060 YES RMS Displacement 0.000015 0.000040 YES |
|
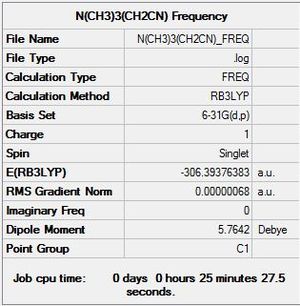
Frequency
Frequency file: DOI:10042/104542
| summary data | low modes |
|---|---|
|
Low frequencies --- -2.6229 -0.0010 -0.0008 -0.0002 7.1539 9.6647 Low frequencies --- 91.7753 154.0285 210.9392 |
MO and NBO Analysis
Energy File N(CH3)3(CH2OH) : DOI:10042/110614
Energy File N(CH3)3(CH2CN) : DOI:10042/110616
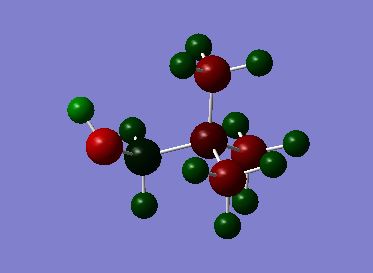
NBO Analysis
| Charge Distribution of N(CH3)3(CH2OH) | Charge | Charge Distribution of N(CH3)3(CH2OH) |
|---|---|---|
|
|
|
| Charge Distribution of N(CH3)3(CH2CN) | Charge | NBO Charge of N(CH3)3(CH2CN) |
|---|---|---|
|
|
|
| N(CH3)4 | N(CH3)3(CH2OH | N(CH3)3(CH2CN) | |
|---|---|---|---|
| Central N Charge | -0.295 | -0.322 | -0.289 |
| C- Functional Group Charge | - | 0.088 | -0.358 |
| (C)-H Functional Group Charge | - | 0.237, 0.249 | 0.309, 0.309 |
| Methyl C Charge | -0.483 | -0.494, -0.492, -0.491 | -0.489, -0.485, -0.489 |
| Methyl H Charge | 0.269 | 0.271, 0.262, 0.272, 0.282, 0.266, 0.266, 0.266, 0.269, 0.274 | 0.269, 0.282, 0.274, 0.269, 0.282, 0.274, 0.271, 0.271, 0.277 |
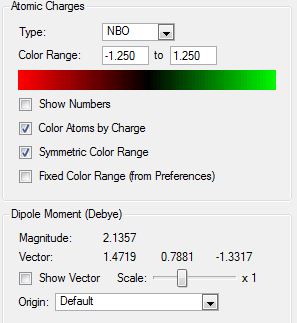
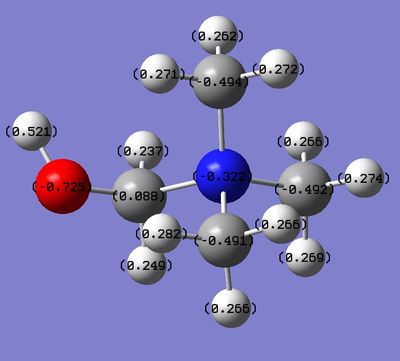
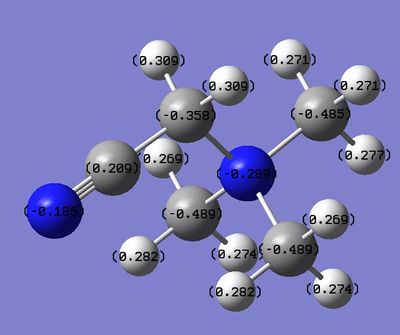
The functional groups have both affected the charge distribution around the cation as they introduce new electronegative elements into the molecule. The initial predictions of the effect of the OH functional group is that it would donate electron density into the cation as it is an electron donating group. This effect is in competition with the fact that it is an electronegative element (pauling electronegativity of 3.44) and therefore also pulls electron density towards its nucleus. The overall effect of the OH functional group on the carbon that it is bonded to is to make it have a more positive charge than in the tetramethylammmonium cation (0.088 vs -0.483). The charge of the hydrogen atoms on the carbon have also become more positive than in the TMA cation due to deshielding of their nuclei. This shows that the electronegativity of the oxygen is more important than its electron donating character. If the electron donating ability was more prevalent then the same carbon would have had a more negative charge than in the tetramethylammonium ion. The other major effect of the OH functional group is the increased negative charge of the central nitrogen atom. This can be explained by the fact that the nitrogen atom may have pulled the oxygen donated electron density towards its own nucleus from the carbon, thereby further polarising the C-N bond. This would also further explain the positive charge that is shown at the carbon atom. The effect of the functional group on the other methyl fragments is much smaller as it does not have the power to affect the electron density around these groups to a great extent. The carbon atoms of the methyl fragments have become slightly more negative and the hydrogen atoms have become slightly more positive which shows a very small increase in polarisation of that C-H bond. The formal positive charge that is associated with the cation can now be seen to reside predominantly on the functionalised methyl fragment whereas it was previously found to be shared between the methyl fragments of TMA. This charge is not as delocalised and this is represented further by the very dark green colour of the carbon atom in the colour distribution.
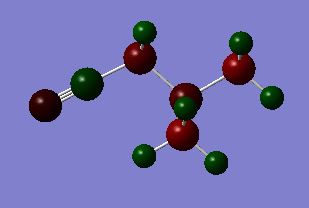
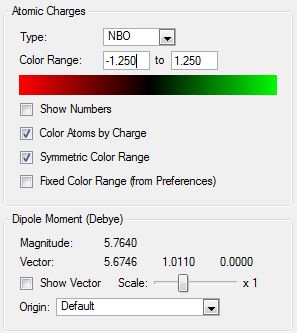
The CN group, on the other hand, is a purely electron withdrawing group and the effect that this has can be seen on the functionalised carbon atom. The charge around this atom has become less negative than in the TMA molecule which shows that it has become deshielded but to less of an extent than in the OH cation. The carbon has a charge of -0.358 in this cation whereas it had a value of 0.088 in the previous cation. This shows that the electron withdrawing ability of the oxygen is stronger than the cyano group. However it can be seen that the C-H bonds of the functionalised carbon atom are more polarised with the hydrogen atoms bearing a more positive charge in this cation. This explains why the electron density around the carbon atom is higher and also why the nitrogen atom in this cation is less negative. It has not pulled any extra electron density towards its nucleus as none has been donated into the system. The charge of the other methyl fragments is more similar to that of the TMA than in the other cation which further shows that the polarising ability of this functional group is not as strong. Therefore the formal positive charge is more delocalised in this structure.
Overall the effect of changing ligands is that the distribution of the formal positve charge in the cation has been changed due to the loss of symmetry.
| N(CH3)4 | N(CH3)3(CH2OH) | N(CH3)3(CH2CN) | |
|---|---|---|---|
| HOMO | 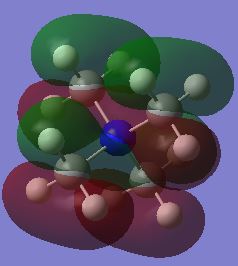 |
 |
|
| LUMO | 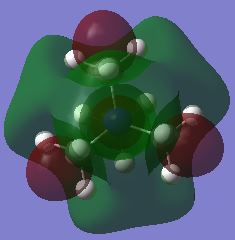 |
 |
|
| N(CH3)4 (AU/KJmol-1) | N(CH3)3(CH2OH)(AU/KJmol-1) | N(CH3)3(CH2CN)(AU/KJmol-1) | |
|---|---|---|---|
| HOMO | -0.57934 / -1521.06 | -0.48763 / -1280.27 | -0.50048 / -1314.01 |
| LUMO | -0.13306 / -349.35 | -0.12459 / -327.11 | -0.18183 / -477.40 |
| HOMO-LUMO GAP | 0.44626 / 1171.66 | 0.36304 / 953.16 | 0.31865 / 836.62 |
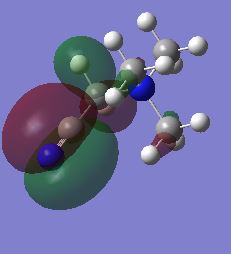
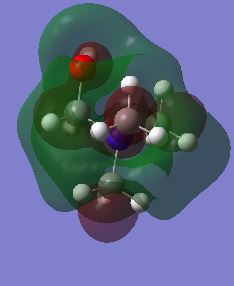
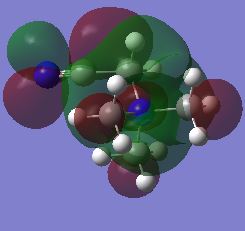
The HOMO of the N(CH3)4 molecule is symmetric due to the highly symmetric nature of the molecule. There is seen to be an even contribution from the nitrogen orbitals and the methyl fragment orbitals to the overall delocalisation of the molecular orbital. The orbital is higher up in energy than its precursors due to the antibonding character associated with the molecular orbitals. This can be attributed to the increased number of nodes in the molecule due to the interaction of p-orbitals on the carbon and nitrogen atoms. When a functional group is introduced to the cation, the previous symmetry his been removed and consequently the shape of the molecular orbitals change. This is because there are new fragment orbitals which have different orbital symmetries and electronegatives and so cause a change in shape when they combine to form the molecular orbitals. In the both the hydroxyl and cyano bearing cations, there is decreased delocalisation of the molecular orbital with the major contributions to the HOMO being from the functional groups. There is an increase in energies of the HOMOS in comparison to the tetramethylammonium cation. When the interactions in the molecule are considered, it can be seen that there are more nodes and less through space bonding interactions in both the hydroxyl bearing cation and the cyano bearing cation. These effect was larger in the hydroxyl bearing cation. This in combination with the reduction in symmetry explains the increase in enegies of the HOMOS.
The shape of the LUMOs is harder to rationalise due to the different nature of the calculation that is used to determine their shape. However it can qualitatively be seen that the shape has changed and that there is an increased amount of through space anti-bonding interactions and an increased incidence of nodes which explain the increase in energy of all of the orbitals with respect to their corresponding HOMOs. It can also be seen that they charge is more delocalised in the unsymmetric LUMO orbitals in comparison to the HOMOS which means that it is difficult to determine the orbitals that contribute most to the structure. The additional of the functional groups increased the energy of the LUMO in the case of the hydroxyl group but not in the case of the cyano group. There was in fact a decrease in the LUMO of the cyano group meaning that it experienced a greater degree of bonding in its orbital in comparison with the TMA.
As a result of these shifts in energy, there is also a difference in the HOMO-LUMO gap of the molecules. The HOMO-LUMO gap has decreased upon addition of the functional groups with the smallest gap being for the cyano group. The decrease of the LUMO energy in this molecule would make it a more Lewis acidic molecule. This is because it has a lower energy acceptor orbital and can therefore interact with the HOMO of an incoming Lewis base with greater ease and stabilisation. The addition of a functional group, whether electron donating or withdrawing, increased the energy of the HOMO. This means that the molecule is better able to act as a Lewis base as it will be closer in energy to the LUMO of an incoming Lewis acid. The electrons will not be held as tightly by the molecule at a higher energy which gives scope for greater reactivity especially with anions in the formation of ionic liquids.
References
- ↑ Atomic radius of the elements, http://periodictable.com/Properties/A/AtomicRadius.v.html, (accessed 21/11/2014)
- ↑ Chemical Bonding, http://www.smallscalechemistry.colostate.edu/PowerfulPictures/ChemicalBonding.pdf, (accessed 13/11/2014)
- ↑ Gaussian User Manual, http://www.gaussian.com/g_tech/g_ur/k_freq.htm, (accessed 13/11/2014)
- ↑ A.N Barret, G.C.K Roberts, A.S.V Burgen, G.M Clore, Ab Initio MOlecular Orbital Calculations of Electron Distribution in Tetramethylammonium Ion, Medical Pharmacology, 1983, 24, 443-448


