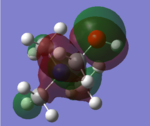
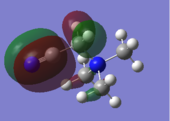
Rep:Title=Mod:OaB8102
Optimisation of a molecule
Optimisation of BH3
Using a Low Basis Set
A BH3 molecule was created in Gaussview. An optimisation calculation was run on the BH3 molecule with a B3LYP method and a 3-21G basis set. The optimisation file can be found here:File:BH3 OPT1 321G OB810.LOG The results summary of the calculation and the corresponding Item are provided below. The optimised molecule of BH3 is given in Figure 1.
| File Name | BH3_OPT1_321G_OB810 |
|---|---|
| File Type | .log |
| Calculation Type | FOPT |
| Calculation Method | RB3LYP |
| Basis Set | 3-21G |
| Charge | 0 |
| Energy (RB3LYP) | -26.46 a.u |
| RMS Gradient Norm | 0.00020672 a.u. |
| Dipole Moment | 0.0000 Debye |
| Point Group | D3H |
| Job cpu Time | 7.0 seconds |
 Item               Value     Threshold  Converged?
 Maximum Force            0.000413     0.000450     YES
 RMS     Force            0.000271     0.000300     YES
 Maximum Displacement     0.001610     0.001800     YES
 RMS     Displacement     0.001054     0.001200     YES
 Predicted change in Energy=-1.071764D-06
 Optimization completed.
    -- Stationary point found.
                           ----------------------------
                           !   Optimized Parameters   !
                           ! (Angstroms and Degrees)  !
 --------------------------                            --------------------------
 ! Name  Definition              Value          Derivative Info.                !
 --------------------------------------------------------------------------------
 ! R1    R(1,2)                  1.1935         -DE/DX =    0.0004              !
 ! R2    R(1,3)                  1.1935         -DE/DX =    0.0004              !
 ! R3    R(1,4)                  1.1935         -DE/DX =    0.0004              !
 ! A1    A(2,1,3)              120.0            -DE/DX =    0.0                 !
 ! A2    A(2,1,4)              120.0            -DE/DX =    0.0                 !
 ! A3    A(3,1,4)              120.0            -DE/DX =    0.0                 !
 ! D1    D(2,1,4,3)            180.0            -DE/DX =    0.0                 !
 --------------------------------------------------------------------------------

The optimisation has completed successfully as the 'summary' gradient is below 0.001. Equally, all the forces and distances have converged, as indicated in the Item. The B-H bond distances are calculated to be 1.19 Å. Additionally, the H-B-H bond angles were determined to be 120.0°. This optimised bond distance is consistent with that recorded in literature. Literature[1] B-H bond lengths are reported as 1.19 Å. Furthermore, the H-B-H bond angle is consistent with that of trigonal planar geometry.
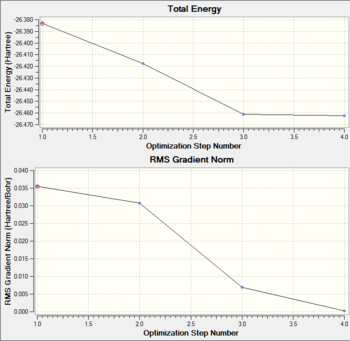
When BH3 is optimised, the Schrodinger Equation is solved under the Born-Oppenheimer Approximations. The Total Energy Curve and the Root Mean Squared (RMS) graphs for BH3 optimisation are provided below. The Total Energy Curve shows how Gaussview is traversing the potential energy surface (PES) of BH3, until the minimum structure is obtained and the gradient is zero. The gradient is the difference in energy divided by the the difference in nuclei position; dE/dx. At the minimum, the short range repulsive interactions of the nuclei are in equilibrium with The long range attraction forces between the electrons and nuclei. The RMS graph shows how the gradient tends to zero as the structure approaches a minimum.
Using A Better Basis Set
The optimised BH3 molecule from the 3-21G basis set, was used as the starting molecule for an optimisation using a higher basis set of 6-31G(d,p) and a method of B3LYP. A link to the completed 6-31G optimisation file can be found here:File:BH3 OPT 631G DP OB810.LOG. The results summary and Item are provided below. Figure 2 represents the optimised molecule of BH3.
| File Name | BH3_OPT_631-G(d,p) |
|---|---|
| File Type | .log |
| Calculation Type | FOPT |
| Calculation Method | RB3LYP |
| Basis Set | 6-31G(d,p) |
| Charge | 0 |
| Spin | Singlet |
| E(RB3LYP | -26.62 a.u |
| RMS Gradient Norm | 0.00000235 a.u |
| Dipole Moment | 0.0000 Debye |
| Point Group | D3H |
| Job cpu time | 4.0 seconds |
        Item               Value     Threshold  Converged?
 Maximum Force            0.000005     0.000450     YES
 RMS     Force            0.000003     0.000300     YES
 Maximum Displacement     0.000019     0.001800     YES
 RMS     Displacement     0.000012     0.001200     YES
 Predicted change in Energy=-1.304899D-10
 Optimization completed.
    -- Stationary point found.
                           ----------------------------
                           !   Optimized Parameters   !
                           ! (Angstroms and Degrees)  !
 --------------------------                            --------------------------
 ! Name  Definition              Value          Derivative Info.                !
 --------------------------------------------------------------------------------
 ! R1    R(1,2)                  1.1923         -DE/DX =    0.0                 !
 ! R2    R(1,3)                  1.1923         -DE/DX =    0.0                 !
 ! R3    R(1,4)                  1.1923         -DE/DX =    0.0                 !
 ! A1    A(2,1,3)              120.0            -DE/DX =    0.0                 !
 ! A2    A(2,1,4)              120.0            -DE/DX =    0.0                 !
 ! A3    A(3,1,4)              120.0            -DE/DX =    0.0                 !
 ! D1    D(2,1,4,3)            180.0            -DE/DX =    0.0                 !
 --------------------------------------------------------------------------------
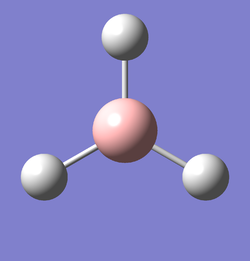
The optimisation has completed successfully as the 'summary' gradient is below 0.001. Equally, all the forces and distances have converged, as indicated in the Item. The B-H bond distances are calculated to be 1.19 Å. Additionally, the H-B-H bond angles were determined to be 120.0°. This optimised bond distance is consistent with that recorded in literature. Literature[2] B-H bond lengths are reported as 1.19 Å. Furthermore, the H-B-H bond angle is consistent with that of trigonal planar geometry.
The total energy of the optimised 3-21G structure of BH3 is -26.46226338 atomic mass units(a.u.). Additionally, the total energy of the optimised 6-31G structure is -26.61532363 a.u. Thus, the 6-31G structure has a lower energy. The difference in energy between the two structures is 0.15306025 a.u, which is equivalent to 403.3 kJ/mol. However, the energies obtained from the 3-21G and 6-31G basis set cannot be compared, as a different basis set was applied to the atoms in each of the calculations.
Using Pseudo Potentials (PP): Optimisation of TlBr3
A molecule of TlBr3 was created in Gaussview. The symmetry of TlBr3 was restricted to D3H. An optimisation calculation was performed on TlBr3 with a B3LYP method and a LanL2DZ basis set of. The optimistion of TlBr3 was publihsed to D-Space: DOI:10042/22780 10042/22780 . The results summary and Item are provided below.
| File Name | TlBr3_2log_69145 |
|---|---|
| File Type | .log |
| Calculation Type | FOPT |
| Calculation Method | RB3LYP |
| Basis Set | LanL2DZ |
| Charge | 0 |
| Spin | Singlet |
| Energy (RB3LYP) | -91.22 a.u |
| RMS Gradient Norm | 0.00000090 a.u. |
| Dipole Moment | 0.0000 Debye |
| Point Group | D3H |
| Length of Calculation | 21.4 seconds |
         Item               Value     Threshold  Converged?
 Maximum Force            0.000002     0.000450     YES
 RMS     Force            0.000001     0.000300     YES
 Maximum Displacement     0.000022     0.001800     YES
 RMS     Displacement     0.000014     0.001200     YES
 Predicted change in Energy=-6.084079D-11
 Optimization completed.
    -- Stationary point found.
                           ----------------------------
                           !   Optimized Parameters   !
                           ! (Angstroms and Degrees)  !
 --------------------------                            --------------------------
 ! Name  Definition              Value          Derivative Info.                !
 --------------------------------------------------------------------------------
 ! R1    R(1,2)                  2.651          -DE/DX =    0.0                 !
 ! R2    R(1,3)                  2.651          -DE/DX =    0.0                 !
 ! R3    R(1,4)                  2.651          -DE/DX =    0.0                 !
 ! A1    A(2,1,3)              120.0            -DE/DX =    0.0                 !
 ! A2    A(2,1,4)              120.0            -DE/DX =    0.0                 !
 ! A3    A(3,1,4)              120.0            -DE/DX =    0.0                 !
 ! D1    D(2,1,4,3)            180.0            -DE/DX =    0.0                 !
 --------------------------------------------------------------------------------
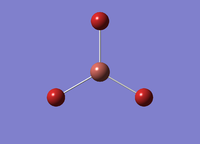
The optimisation summary has completed successfully as the 'summary' gradient is below 0.001. Also, the all forces and distances have converged, as confirmed by the Item. The Tl-Br bond length was calculated to be 2.65 Å. Likewise, the Br-Tl-Br angle was determined to be 120.0°. Literature[3]30 value for Tl-Br bond length are reported as 2.62 Å. The Br-Tl-Br bond angle is consistent with a trigonal planar geometry of 120°.
Using a Mixture of Basis Sets and PP: Optimisation of BBr3
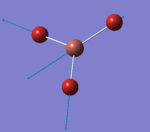
A molecule of BBr3 was created in Gaussview. An optimisation calculation was performed with a B3LYP method and a 6-31G(d,p) and LanL2DZ basis set. The optimisation file was published to D-Space: DOI:10042/22781 The results summary and Item of the calculation are provided below. The image of optimised TlBr3 molecule is given in Figure 3.
| File Name | BBr3_log_69149 |
|---|---|
| File Type | .log |
| Calculation Type | FOPT |
| Calculation Method | RB3LYP |
| Basis Set | Gen |
| Charge | 0 |
| Spin | Singlet |
| Energy (RB3LYP) | -64.43 a.u. |
| RMS Gradient Norm | 0.00000382 a.u. |
| Dipole Moment | 0.0000 Debye |
| Point Group | D3H |
| Job cpu Time | 19.2 seconds |
         Item               Value     Threshold  Converged?
 Maximum Force            0.000008     0.000450     YES
 RMS     Force            0.000005     0.000300     YES
 Maximum Displacement     0.000036     0.001800     YES
 RMS     Displacement     0.000023     0.001200     YES
 Predicted change in Energy=-4.026911D-10
 Optimization completed.
    -- Stationary point found.
                           ----------------------------
                           !   Optimized Parameters   !
                           ! (Angstroms and Degrees)  !
 --------------------------                            --------------------------
 ! Name  Definition              Value          Derivative Info.                !
 --------------------------------------------------------------------------------
 ! R1    R(1,2)                  1.934          -DE/DX =    0.0                 !
 ! R2    R(1,3)                  1.934          -DE/DX =    0.0                 !
 ! R3    R(1,4)                  1.934          -DE/DX =    0.0                 !
 ! A1    A(2,1,3)              120.0            -DE/DX =    0.0                 !
 ! A2    A(2,1,4)              120.0            -DE/DX =    0.0                 !
 ! A3    A(3,1,4)              120.0            -DE/DX =    0.0                 !
 ! D1    D(2,1,4,3)            180.0            -DE/DX =    0.0                 !
 --------------------------------------------------------------------------------
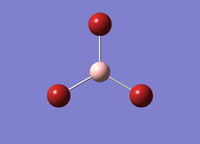
The optimisation was successful as the 'summary' gradient is below 0.001. Additionally, the Item indicates that all forces and distances have converged. The optimised B-Br bond length was calculated to be 1.93 Å and the Br-B-Br bond angle was determined to be 120.0°. The B-Br bond length is in good agreement with that reported in literature. Literature[4] B-Br bond lengths are reported as 1.89 Å. The Br-B-Br bond angle is consistent with trigonal planar geometry.
Comparison of BH3, BBr3 and TlBr3
The different bond lengths of BH3, BBr3 and TlBr3 are summarised in Table 1.
| Molecule | BH3 | BBr3 | TlBr3 |
| Bond | B-H | B-Br | Tl-Br |
| Length (Å) | 1.19 | 1.93 | 2.65 |
A longer bond is observed on changing the ligand from H to Br. This observation may be explained by considering the electronic configurations and electronegativites of H and Br. The electronic configurations of H and Br are 1s1 and [Ar] 4s2, 3d10, 4p5 respectfully. Therefore, both H and Br have an unpaired electron in their valence shell. However, Br is larger than H and therefore has more diffuse orbitals, leading to a weaker interaction with the central Boron atom. Additionally, H is more electronegative than Br. Consequently, the B-H bond is more polar than B-Br bond.
A longer bond is observed on changing the central atom from B and Tl. Tl is a larger atom than B and Tl has more diffuse orbitals than B. However,the regions of orbital overlap in Tl-Br bond will have a lower electron density compared to B-Br. Therefore, the total amount of overlap is reduced. This leads to a weaker Tl-Br bond. Additionally, the oxidation states of both B and Tl in BBr3 and TlBr3 are +3. B prefers an oxidation state of +3. However, unlike B, Tl prefers an oxidation state of +1. Consequently, the BBr3 complex is more stable (has a lower energy) than the TlBr3 complex.
Why does Guassian sometimes not show a bond?
Sometimes Gaussview does not show bonds in intermediate structures. This is because Gaussivew assigns bonds on a distance criteria.
What is a bond?
A bond is a region of high electron density between 2 atoms, which leads to an electromagnetic force of attraction between atoms. The strength of a bond can vary considerably, depending on the type of bonding interaction occurring. Covalent and ionic bonds are example of 'strong' bonds. Whereas, dipole-dipole interactions and hydrogen bonding are 'weak' bonds.
Frequency Analysis
Frequency Analysis of BH3
A frequency analysis was carried out for the optimised BH3 molecule with a basis set of 6-31G (d,p). The symmetry was constrained to D3H. A link to the completed frequency analysis is provided here: File:OB810 BH3 FREQ.LOG The results summary, Item and low frequencies are given below.
| File Name | ob810_BH3_freq_ |
|---|---|
| File Type | .log |
| Calculation Type | FREQ |
| Calculation Method | RB3LYP |
| Basis Set | 6-31G(d,p) |
| Charge | 0 |
| Spin | Singlet |
| Energy (RB3LYP) | -26.62a.u |
| RMS Gradient Norm | 0.00000237 a.u. |
| Dipole Moment | 0.0000 Debye |
| Imaginary Freq | 0 |
| Point Group | D3H |
| Job cpu Time | 11.0 seconds |
          Item               Value     Threshold  Converged?
 Maximum Force            0.000005     0.000450     YES
 RMS     Force            0.000002     0.000300     YES
 Maximum Displacement     0.000019     0.001800     YES
 RMS     Displacement     0.000009     0.001200     YES
 Predicted change in Energy=-1.323374D-10
 Optimization completed.
    -- Stationary point found.
Low frequencies ---   -0.9033   -0.7343   -0.0054    6.7375   12.2491   12.2824
 Low frequencies --- 1163.0003 1213.1853 1213.1880
 Harmonic frequencies (cm**-1), IR intensities (KM/Mole), Raman scattering
 activities (A**4/AMU), depolarization ratios for plane and unpolarized
 incident light, reduced masses (AMU), force constants (mDyne/A),
 and normal coordinates:
                     1                      2                      3
                    A2"                    E'                     E'
 Frequencies --  1163.0003              1213.1853              1213.1880
 Red. masses --     1.2531                 1.1072                 1.1072
 Frc consts  --     0.9986                 0.9601                 0.9601
 IR Inten    --    92.5478                14.0553                14.0589
  Atom  AN      X      Y      Z        X      Y      Z        X      Y      Z
     1   5     0.00   0.00   0.16     0.00   0.10   0.00    -0.10   0.00   0.00
     2   1     0.00   0.00  -0.57     0.00   0.08   0.00     0.81   0.00   0.00
     3   1     0.00   0.00  -0.57    -0.39  -0.59   0.00     0.14   0.39   0.00
     4   1     0.00   0.00  -0.57     0.39  -0.59   0.00     0.14  -0.39   0.00
The energy of the optimised frequency structure of BH3, is -26.62 a.u. This is in direct agreement with the energy from the optimisation calculation, indicating that the structure of BH3 has been minimised. The frequency analysis has been successfully completed as the low frequencies should be between plus/minus 15; this is the case for BH3.
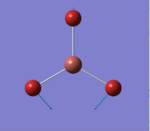
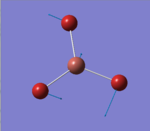
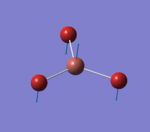
The different vibration modes of BH3 and their corresponding frequencies are provided in Table 2. The blue vectors represent the displacement vectors. The lowest real mode is 1163 cm-1. No negative vibrational modes indicates that the BH3 is a minimum on PES.
| Number | Image of Vibration | Description of Vibration | Frequency (cm-1) | Intensity | Symmetry for D3H Point Group | |||
| 1 |
|
3 H atoms move in and out of plane. B atom moves in and out of plane but in opposite direction to H atoms. Change in dipole moment. | 1163 | 92.5 | A2" | |||
| 2 |
|
2 H atoms bend in towards each other, in scissoring motion. 1 H atom moves in and out of plane. Change in dipole moment | 1213 | 14.1 | E' | |||
| 3 |
|
Concerted rocking motion of 2 H atoms towards the other H atom. Change in dipole moment. | 1213 | 14.1 | E' | |||
| 4 |
|
3 H atoms move in and out of the plane in a concerted motion. No change in dipole moment | 2582 | 0.0 | A1' | |||
| 5 |
|
2 of the B-H bonds shorten and lengthen alternatively. Change in Dipole moment. | 2715 | 126.3 | E' | |||
| 6 |
|
One B-H bond shortens and lengthens. Other H atoms stretches in and out of plane but in opposite direction to toher H atoms. Change in dipole moment. | 2715 | 126.3 | E' |

A molecule has 3N-6 vibrations, where N is the number of atoms. Thus, BH3, has six vibrational modes. However, only three peaks are observed in the IR spectrum of BH3. This is because only vibrations which lead to to a change in dipole moment are IR active and observed in IR spectrum. Therefore, the symmetric stretch is IR inactive as no change in dipole moment occurs. Additionally, vibrations 2 and 3 are degenerate. Similarly, vibrations 4 and 5 are also degenerate. A single band is observed in the IR spectrum for each degenerate pair. This results in 3 bands in the IR spectrum, which are due to A2", E' and E'.
Frequency Analysis of TlBr3
A frequency analysis was carried out on optimised molecule of TlBr3. The geometry constrained to D3H Point Group. A B3LYP method and Lan2LDZ basis set was applied. The completed frequency analysis was published to D-Space: DOI:10042/22465 The results of the frequency analysis are given below, along with the Item and low frequencies.
| File Name | log_69285(1) |
|---|---|
| File Type | .log |
| Calculation Type | FREQ |
| Calculation Method | RB3LYP |
| Basis Set | LANL2DZ |
| Charge | 0 |
| Spin | Singlet |
| Energy (RB3LYP) | -91.22 a.u |
| RMS Gradient Norm | 0.00000088 a.u. |
| Dipole Moment | 0.0000 Debye |
| Imaginary Freq | 0 |
| Point Group | D3H |
| Length of Calculation | 27.6 seconds |
Low frequencies ---   -3.4213   -0.0026   -0.0004    0.0015    3.9362    3.9362
 Low frequencies ---   46.4289   46.4292   52.1449
 Harmonic frequencies (cm**-1), IR intensities (KM/Mole), Raman scattering
 activities (A**4/AMU), depolarization ratios for plane and unpolarized
 incident light, reduced masses (AMU), force constants (mDyne/A),
 and normal coordinates:
                     1                      2                      3
                    E'                     E'                     A2"
 Frequencies --    46.4289                46.4292                52.1449
 Red. masses --    88.4613                88.4613               117.7209
 Frc consts  --     0.1124                 0.1124                 0.1886
 IR Inten    --     3.6867                 3.6867                 5.8466
  Atom  AN      X      Y      Z        X      Y      Z        X      Y      Z
     1  81     0.00   0.28   0.00    -0.28   0.00   0.00     0.00   0.00   0.55
     2  35     0.00   0.26   0.00     0.74   0.00   0.00     0.00   0.00  -0.48
     3  35    -0.43  -0.49   0.00    -0.01   0.43   0.00     0.00   0.00  -0.48
     4  35     0.43  -0.49   0.00    -0.01  -0.43   0.00     0.00   0.00  -0.48
         Item               Value     Threshold  Converged?
 Maximum Force            0.000002     0.000450     YES
 RMS     Force            0.000001     0.000300     YES
 Maximum Displacement     0.000022     0.001800     YES
 RMS     Displacement     0.000011     0.001200     YES
 Predicted change in Energy=-5.660840D-11
 Optimization completed.
    -- Stationary point found.
 GradGradGradGradGradGradGradGradGradGradGradGradGradGradGradGradGradGrad
The frequency analysis has been successful as all of the low frequencies are between plus/minus 15. Also, the frequency analysis confirms that TlBr3 has been minimised successfully as the energies of the optimisation and frequency calculations are equal.
The different vibration modes of TlBr3 and their corresponding frequencies are provided in Table 3. The blue vectors represent the displacement vectors. The lowest real mode is 46 cm-1.

The predicted IR spectrum of TlBr3 is provided below. 3 peaks are observed in the spectrum. Vibrations 1 and 2 are degenerate, therefore, only one peak is observed for both of them. Vibrations 5 and 6 are also degenerate, with one peak observed for both of them. Vibration 4 is IR inactive as there is no change in dipole moment. Thus the IR bands are due to E', A2" and E' vibrational modes.
Comparison of vibration frequencies for BH3 and TlBr3
Table 4 summarises the wavenumber and Point Group for the vibrations of BH3 and TlBr3.
| BH3 | TlBr3 | Point Group of Vibration |
|---|---|---|
| 1163 | 52 | A2" |
| 1213 | 46 | E' |
| 2582 | 165 | A1' |
| 2715 | 211 | E' |
From Table 5 and the IR spectra of BH3 and TlBr3, the following observations and comparisons can be made. Firstly, it is clear that the vibrational frequency values for BH3 are larger than for TlBr3. Secondly, there has been a re ordering of vibrational modes between BH3 and TlBr3. Thirdly, both of the IR spectra of BH3 and TlBr3 have 3 peaks.
Hooke's Law provides the equation for the wavenumber of a vibration. The equation is of the form;

It is also apparent that both IR spectra have three peaks, two of which are from a degenerate set. Both of the degenerate peaks in each IR spectra have E' symmetry. Similarly, two of the peaks in each spectrum lie very close together in energy. For BH3, the A2" and E' are close together and for TlBr3, the A1' and E' are close together. The E' and A2" have a lower energy as they are bending modes. Whereas, E' and A1' have a higher energy has they are stretching modes.
The vibrational modes of BH3 have the following order: A2", E', E', A1', E', 'E'. Conversely, the vibrational modes for TlBr3 have the following order: E', E', A2", A1', E', E'. A re ordering of vibrational modes has been observed due to the mass difference between Br and H. A2" bending vibration, requires more energy for the Tl-Br bond than B-H bond as Br is heavier than H.
The same method and basis set must be applied for optimisation and frequency calculations because the frequency analysis has to be on the same PES. If the frequency calculation was performed on a different basis set, the results would be meaningless. Likewise, in order to compare different molecules, they must have the same number number of atoms and the same basis set on each atom.
A frequency analysis is performed to ensure that a minimum structure has been obtained. Likewise, the data produced can be compared to experimental and literature results.
The low frequencies represent the motions of center of mass of the molecule. A molecule has 3N-6 vibrations, where N is the number of atoms present.
Population Analysis of BH3
A single point energy calculation was performed on optimised structure of BH3. A B3LYP method and 6-31G basis set was used. The completed population analysis was published to D-Space: DOI:10042/22781 . The results summary is given below.
| File Name | BH3_MO_OB810 ) |
|---|---|
| File Type | .log |
| Calculation Type | SP |
| Calculation Method | RB3LYP |
| Basis Set | 6-31G(d,p) |
| Charge | 0 |
| Spin | Singlet |
| Energy (RB3LYP) | -26.62 a.u. |
| RMS Gradient Norm | 0.00000000 a.u. |
| Dipole Moment | 0.0000 Debye |
| Imaginary Freq | |
| Point Group | D3H |
| Job CPU Time | 15.9 seconds |
Orbital energies and kinetic energies (alpha):
                                 1                 2
   1         (A1')--O         -6.771401         10.797555
   2         (A1')--O         -0.512537          0.904876
   3         (E')--O          -0.350794          0.728266
   4         (E')--O          -0.350794          0.728266
   5         (A2")--V         -0.066053          0.640361
   6         (A1')--V          0.168390          0.935058
   7         (E')--V           0.179289          0.644594
   8         (E')--V           0.179289          0.644594
The molecular orbitals were visulised in Gaussview and the MO diagram was drawn.
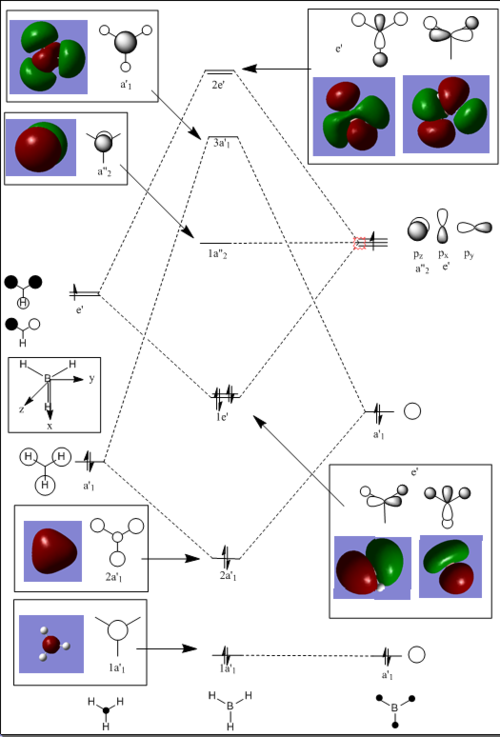
Snapshots of the 'real' MOs were placed beside the Linear Combination of Atomic Orbitals (LCAO) in the MO diagram. There is no significant difference between the 'real' MOs and the LCAO MOs,indicating that qualitative MO theory is accurate and useful.
NBO Analysis
Optimising a Molecule of NH3
A NH3 molecule was drawn in Gaussview. An optimisaiton calculation was carried out on the molecule with B3LYP a method of and a6-31G (d,p) basis set. No symmetry was applied to the molecule. The optimised file can be found here: File:NH3 OPT 631G OB810 1.LOG The results summary and Item are given below:
| File Name | NH3_OPT_631G_OB810 ) |
|---|---|
| File Type | .log |
| Calculation Type | FOPT |
| Calculation Method | RB3LYP |
| Basis Set | 6-31G(d,p) |
| Charge | 0 |
| Spin | Singlet |
| Energy (RB3LYP) | -56.56 a.u. |
| RMS Gradient Norm | 0.00000888 a.u. |
| Dipole Moment | 1.8461 Debye |
| Imaginary Freq | |
| Point Group | C1 |
| Job CPU Time | 20.0 seconds |
       Item               Value     Threshold  Converged?
 Maximum Force            0.000024     0.000450     YES
 RMS     Force            0.000012     0.000300     YES
 Maximum Displacement     0.000088     0.001800     YES
 RMS     Displacement     0.000056     0.001200     YES
 Predicted change in Energy=-1.759459D-09
 Optimization completed.
    -- Stationary point found.
                           ----------------------------
                           !   Optimized Parameters   !
                           ! (Angstroms and Degrees)  !
 --------------------------                            --------------------------
 ! Name  Definition              Value          Derivative Info.                !
 --------------------------------------------------------------------------------
 ! R1    R(1,2)                  1.018          -DE/DX =    0.0                 !
 ! R2    R(1,3)                  1.018          -DE/DX =    0.0                 !
 ! R3    R(1,4)                  1.018          -DE/DX =    0.0                 !
 ! A1    A(2,1,3)              105.7414         -DE/DX =    0.0                 !
 ! A2    A(2,1,4)              105.7486         -DE/DX =    0.0                 !
 ! A3    A(3,1,4)              105.7478         -DE/DX =    0.0                 !
 ! D1    D(2,1,4,3)           -111.8631         -DE/DX =    0.0                 !
 --------------------------------------------------------------------------------
The optimisation has been successful as all forces and distances have converged, as indicated by the 'YES' in the Item. The optimised N-H bond length is 1.02 Å and the H-N-H bond angle is reported as 105.7°. Literature[5] bond lengths are reported as 1.01 Å. Literature[6] bond angles reported as 106.7° The H-N-H bond angle is consistent with trigonal pyramidal geometry.
Frequency Analysis of NH3
Frequency analysis was performed on optimised NH3 molecule. A B3LYP method and 6-31G(d,p) basis set was used. The frequency file can be found here:File:NH3 FREQ 631G OB810 2.LOG. No negative frequencies were found and the low frequencies are between plus/minus 15, indicating that the frequency analysis was completed successfully. The results summary and Item are given below.
| File Name | NH3_FREQ_631G_OB810_2 ) |
|---|---|
| File Type | .log |
| Calculation Type | FREQ |
| Calculation Method | RB3LYP |
| Basis Set | 6-31G(d,p) |
| Charge | 0 |
| Spin | Singlet |
| Energy (RB3LYP) | -56.56 a.u. |
| RMS Gradient Norm | 0.00000822 a.u. |
| Dipole Moment | 1.8461 Debye |
| Imaginary Freq | 0 |
| Point Group | C1 |
| Job CPU Time | 24.0 seconds |
                 Item               Value     Threshold  Converged?
 Maximum Force            0.000023     0.000450     YES
 RMS     Force            0.000011     0.000300     YES
 Maximum Displacement     0.000075     0.001800     YES
 RMS     Displacement     0.000051     0.001200     YES
 Predicted change in Energy=-1.468423D-09
 Optimization completed.
    -- Stationary point found.
The low frequencies are recorded as:
Low frequencies ---  -10.2155   -0.0007    0.0006    0.0006    9.1102   14.6481
 Low frequencies --- 1089.3141 1693.9160 1693.9484
The predicted IR Spectrum of NH3 is given below:

Population Analysis of NH3
A single point Energy calculation was performed on optimised molecule of NH3. A B3LYP method and 6-31G(d,p) basis set of were used. The completed energy calculation was published to D-Space: DOI:10042/22797 A results summary and orbital energies are given below.
| File Name | NH3_MO_OB810 ) |
|---|---|
| File Type | .log |
| Calculation Type | SP |
| Calculation Method | RB3LYP |
| Basis Set | 6-31G(d,p) |
| Charge | 0 |
| Spin | Singlet |
| Energy (RB3LYP) | -56.56 a.u. |
| RMS Gradient Norm | |
| Dipole Moment | 1.8461 Debye |
| Imaginary Freq | 0 |
| Point Group | C1 |
| Job CPU Time | 11.8 seconds |
 Orbital energies and kinetic energies (alpha):
                                 1                 2
   1         O               -14.305680         21.960789
   2         O                -0.844655          1.812566
   3         O                -0.450305          1.310097
   4         O                -0.450291          1.310120
   5         O                -0.253172          1.629338
   6         V                 0.079852          1.024145
   7         V                 0.169225          1.055075
   8         V                 0.169228          1.055071
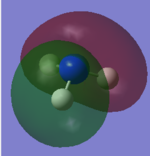
The MOs of NH3 and their corresponding energies are given in Table 5.
NBO Analysis of NH3
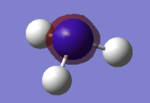
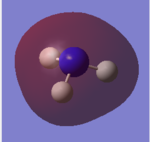
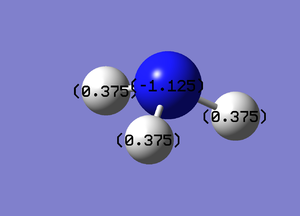
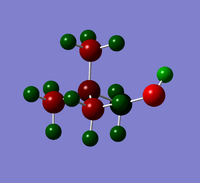
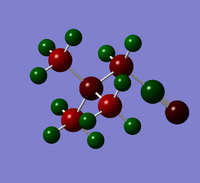
For the Natural Bond Orbital Analysis of NH3, NBO charge distribution was chosen as the job type. Bright green areas indicate regions of positive charge. Bright red areas represent areas of negative charges. The charge limit is from -1.000 to 1.000.

The NBO charge on N is -1.125 and the NBO charge on H is 0.375.
 Summary of Natural Population Analysis:

                                       Natural Population
                Natural  -----------------------------------------------
    Atom  No    Charge         Core      Valence    Rydberg      Total
 -----------------------------------------------------------------------
      N    1   -1.12515      1.99982     6.11104    0.01429     8.12515
      H    2    0.37505      0.00000     0.62250    0.00246     0.62495
      H    3    0.37505      0.00000     0.62250    0.00246     0.62495
      H    4    0.37505      0.00000     0.62249    0.00246     0.62495
 =======================================================================
   * Total *    0.00000      1.99982     7.97852    0.02166    10.00000
        (Occupancy)   Bond orbital/ Coefficients/ Hybrids
 ---------------------------------------------------------------------------------
     1. (1.99909) BD ( 1) N   1 - H   2
                ( 68.83%)   0.8297* N   1 s( 24.87%)p 3.02( 75.05%)d 0.00(  0.09%)
                                           -0.0001 -0.4986 -0.0059  0.0000 -0.2910
                                            0.0052  0.8155  0.0277  0.0000  0.0000
                                            0.0281  0.0000  0.0000  0.0032  0.0082
                ( 31.17%)   0.5583* H   2 s( 99.91%)p 0.00(  0.09%)
                                           -0.9996  0.0000  0.0072 -0.0289  0.0000
     2. (1.99909) BD ( 1) N   1 - H   3
                ( 68.83%)   0.8297* N   1 s( 24.86%)p 3.02( 75.05%)d 0.00(  0.09%)
                                            0.0001  0.4986  0.0059  0.0000  0.2910
                                           -0.0052  0.4077  0.0138  0.7062  0.0240
                                            0.0140  0.0243  0.0076  0.0033  0.0031
                ( 31.17%)   0.5583* H   3 s( 99.91%)p 0.00(  0.09%)
                                            0.9996  0.0000 -0.0072 -0.0145 -0.0250
     3. (1.99909) BD ( 1) N   1 - H   4
                ( 68.83%)   0.8297* N   1 s( 24.87%)p 3.02( 75.05%)d 0.00(  0.09%)
                                            0.0001  0.4986  0.0059  0.0000  0.2909
                                           -0.0052  0.4077  0.0138 -0.7062 -0.0239
                                            0.0140 -0.0243 -0.0076  0.0033  0.0031
                ( 31.17%)   0.5583* H   4 s( 99.91%)p 0.00(  0.09%)
                                            0.9996  0.0000 -0.0072 -0.0145  0.0250
     4. (1.99982) CR ( 1) N   1           s(100.00%)
                                            1.0000 -0.0002  0.0000  0.0000  0.0000
                                            0.0000  0.0000  0.0000  0.0000  0.0000
                                            0.0000  0.0000  0.0000  0.0000  0.0000
     5. (1.99721) LP ( 1) N   1           s( 25.38%)p 2.94( 74.52%)d 0.00(  0.10%)
                                            0.0001  0.5036 -0.0120  0.0000 -0.8618
                                            0.0505  0.0000  0.0000  0.0000  0.0000
                                            0.0000  0.0000  0.0000 -0.0269  0.0155
 Second Order Perturbation Theory Analysis of Fock Matrix in NBO Basis

     Threshold for printing:   0.50 kcal/mol
                                                                              E(2)  E(j)-E(i) F(i,j)
         Donor NBO (i)                     Acceptor NBO (j)                 kcal/mol   a.u.    a.u.
  Natural Bond Orbitals (Summary):

                                                            Principal Delocalizations
           NBO                        Occupancy    Energy   (geminal,vicinal,remote)
 ====================================================================================
 Molecular unit  1  (H3N)
     1. BD (   1) N   1 - H   2          1.99909    -0.60417
     2. BD (   1) N   1 - H   3          1.99909    -0.60417
     3. BD (   1) N   1 - H   4          1.99909    -0.60416
     4. CR (   1) N   1                  1.99982   -14.16768
     5. LP (   1) N   1                  1.99721    -0.31756  24(v),16(v),20(v),17(v)
                                                    21(v),25(v)
NBO analysis reveals the different contributions of N and H to the N-H bond. N contributes 69%, and is 25% in s character and 75% in p character. H contributes 31% and is 100% s character. It is also noted that the core orbital of N is substantially lower in energy (-14.17 a.u.) than the non core orbitals.
Association Energies: Ammonia-Borane
Optimisation of Ammonia-Borane
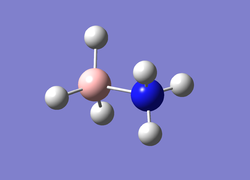
A molecule of ammonia borane was created in Guassview. An optimisation calculation was carried out with a method of B3LYP and a basis set of 3-21G. The optimised structure for 3-21G was then used as in the input file for the optimisation calculation with a basis set of 6-321G. The optimisation file can be found here:File:NH3BH3 OPT 631G OB810.LOG The calculation results summary and Item are given below.
| File Name | NH3BH3_OPT_321G_OB810 |
|---|---|
| File Type | .log |
| Calculation Type | FOPT |
| Calculation Method | RB3LYP |
| Basis Set | 6-31G(d,p) |
| Charge | 0 |
| Spin | Singlet |
| Energy (RB3LYP) | -83.22 a.u. |
| RMS Gradient Norm | 0.00005737 a.u. |
| Dipole Moment | 5.5622 Debye |
| Imaginary Freq | |
| Point Group | C1 |
| Job CPU Time | 9.0 seconds |
         Item               Value     Threshold  Converged?
 Maximum Force            0.000132     0.000450     YES
 RMS     Force            0.000037     0.000300     YES
 Maximum Displacement     0.000877     0.001800     YES
 RMS     Displacement     0.000414     0.001200     YES
 Predicted change in Energy=-1.145396D-07
 Optimization completed.
    -- Stationary point found.
The optimisation has been completed successfully as the 'summary' gradient is below 0.001 and all forces and distances have converged.
The bond lengths and bond angles in NH3BH3 are given in Table 6:
| N-H Bond Length | 1.02 Å |
| H-N-H Bond Angle | 107.9° |
| B-H Bond Length | 1.2 Å |
| H-B-H Bond Angle | 113.9° |
| B-N Bond Length | 1.67 Å |
Frequency Analysis of Ammonia-Borane
A frequency analysis was performed on the optimised structure of NH3BH3. The frequency file can be found here: File:NH3BH3 FREQ OPT 2 OB810.LOG The result summary and Item are given below.
| File Name | )NH3BH3_FREQ_OPT_OB810 |
|---|---|
| File Type | .log |
| Calculation Type | FREQ |
| Calculation Method | RB3LYP |
| Basis Set | 6-31G(d,p) |
| Charge | 0 |
| Spin | Singlet |
| Energy (RB3LYP) | -83.22 a.u. |
| RMS Gradient Norm | 0.00006198a.u. |
| Dipole Moment | 5.5622 Debye |
| Imaginary Freq | |
| Point Group | C1 |
| Job CPU Time | 1 minutes 23.0 seconds |
        Item               Value     Threshold  Converged?
 Maximum Force            0.000139     0.000450     YES
 RMS     Force            0.000039     0.000300     YES
 Maximum Displacement     0.001499     0.001800     YES
 RMS     Displacement     0.000487     0.001200     YES
 Predicted change in Energy=-2.329943D-07
 Optimization completed.
    -- Stationary point found.
The low frequencies are reported at:
Low frequencies ---  -12.7354   -0.0004    0.0013    0.0013    8.7991   10.0028
 Low frequencies ---  262.7780  631.1489  637.9854
The frequency analysis confirms that NH3BH3 has been minimised. The frequency analysis was successful as the low frequencies are between plus/minus 15. The lowest real frequency is 262 cm-1.
Energy comparison of BH3, NH3 and BH3NH3
E(NH3) = -56.55776856 a.u. E(BH3) = -26.61532363 a.u. E(NH3BH3)= -83.22469022 a.u.
ΔE = E(NH3BH3) - [E(NH3) + E(BH3)] = -0.05159803 a.u.
1 a.u. = 2625.5 kJmol-1
Therefore, -0.05159803 a.u. = -0.05159803 x 2625.50 = -135.4706278 kJmol-1 = -135.5 kJmol-1
Therefore, the dissociation energy of NH3BH3 is -135.5 kJmol-1.
The dissociation of NH3BH3 is an exothermic process. Also, the N-B bond dissociation energy is a relatively low value, indicating that the N-B bond is weak and does not require a large amount of energy to break.
Mini Project: Ionic Liquids and Designer Solvents
The structures of [N(CH3)4]+, [P(CH3)4]+ and [S(CH3)3]+ were optimised and a frequency, population and NBO calculation was performed on each molecule. Similarly, the presence of functional groups was examined and an optimisation, frequency and population analysis were performed on [N(CH3)3CH2OH]+ and [N(CH3)3CH2CN]+. All calculations were performed on the HPC and all files were published to D-Space.
[N(CH3)4]+
Optimisation Analysis
An optimisation calculation was performed on molecule of [N(CH3)4]+. A B3LYP method and a 6-31G basis set was used. The optimisation file was published to D-Space: DOI:/10042/22595
| File Name | )[N(CH3)4] |
|---|---|
| File Type | .log |
| Calculation Type | FOPT |
| Calculation Method | RB3LYP |
| Basis Set | 6-31G(d,p) |
| Charge | 1 |
| Spin | Singlet |
| Energy (RB3LYP) | -214.18 a.u. |
| RMS Gradient Norm | 0.00002839 a.u. |
| Dipole Moment | 0.0003Debye |
| Point Group | C1 |
| Job CPU Time | 11 minutes 48.8 seconds |
         Item               Value     Threshold  Converged?
 Maximum Force            0.000084     0.000450     YES
 RMS     Force            0.000026     0.000300     YES
 Maximum Displacement     0.001473     0.001800     YES
 RMS     Displacement     0.000443     0.001200     YES
 Predicted change in Energy=-1.265234D-07
 Optimization completed.
    -- Stationary point found.
The optimisation was completed successfully as the 'summary' gradient is below 0.001 and all of the forces and distances have converged.
Frequency Analysis
A frequency calculation was performed on optimised structure of [N(CH3)4]+. The completed frequency file was published to D-Space DOI:10042/22593 . The results summary, Item and low frequencies are provided below.
| File Name | )N_CH3_4_FREQ_OB810 |
|---|---|
| File Type | .log |
| Calculation Type | FREQ |
| Calculation Method | RB3LYP |
| Basis Set | 6-31G(d,p) |
| Charge | 1 |
| Spin | Singlet |
| Energy (RB3LYP) | -214.18 a.u. |
| RMS Gradient Norm | 0.00000658 a.u. |
| Dipole Moment | 0.0000Debye |
| Point Group | C1 |
| Job CPU Time | 21 minutes 45.6 seconds |
         Item               Value     Threshold  Converged?
 Maximum Force            0.000015     0.000450     YES
 RMS     Force            0.000004     0.000300     YES
 Maximum Displacement     0.000407     0.001800     YES
 RMS     Displacement     0.000121     0.001200     YES
 Predicted change in Energy=-6.608651D-09
 Optimization completed.
    -- Stationary point found.
 Low frequencies ---   -7.4759   -2.5642    0.0008    0.0009    0.0013    4.1974
 Low frequencies ---  182.4900  288.3087  288.6136
The frequency analysis confirms that the minimum structure of [N(CH3)4]+ has been obtained, as the energies of the optimisation and frequency calculations are the same. The frequency analysis has been successfully completed as the low frequencies are between plus/minus 15.
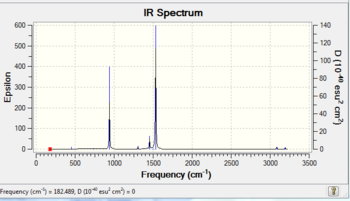
Population Analysis
A population analysis was performed on optimised structure of [N(CH3)4]+. The population file was published in D-Space: DOI:10042/22603 The results summary is given below:
| File Name | )N_CH3_4_MO_OB810 |
|---|---|
| File Type | .log |
| Calculation Type | SP |
| Calculation Method | RB3LYP |
| Basis Set | 6-31G(d,p) |
| Charge | 1 |
| Spin | Singlet |
| Energy (RB3LYP) | -214.18 a.u. |
| RMS Gradient Norm | |
| Dipole Moment | 0.0003 Debye |
| Point Group | C1 |
| Job CPU Time | 53.7 seconds |
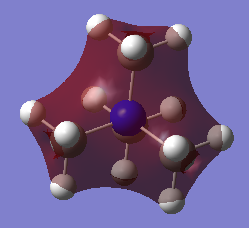
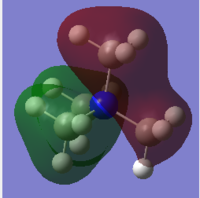
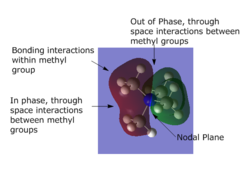
All non core MOs of [N(CH3)4]+ were visualised. 5 of the occupied MOs are presented in Table 7 and the interactions present in each MO have been described.
[P(CH3)4]+
Optimisation Analysis
An optimisation calculation was performed on molecule of [P(CH3)4]+. A B3LYP method and a 6-31G basis set were used. The optimisation file was published to D-Space: DOI:10042/22597 The results summary and Item have been produced below:
| File Name | [P(CH3)4]_OPT_631G_OB810 |
|---|---|
| File Type | .log |
| Calculation Type | FOPT |
| Calculation Method | RB3LYP |
| Basis Set | 6-31G(d,p) |
| Charge | 1 |
| Spin | Singlet |
| Energy (RB3LYP) | -500.83 a.u. |
| RMS Gradient Norm | 0.00003752 a.u. |
| Dipole Moment | 0.0002Debye |
| Point Group | C1 |
| Job CPU Time | 13 minutes 11.5 seconds |
        Item               Value     Threshold  Converged?
 Maximum Force            0.000081     0.000450     YES
 RMS     Force            0.000024     0.000300     YES
 Maximum Displacement     0.001662     0.001800     YES
 RMS     Displacement     0.000481     0.001200     YES
 Predicted change in Energy=-1.484456D-07
 Optimization completed.
    -- Stationary point found.
The optimisation has been successful as the 'summary' gradient is below 0.001. Additionally, all forces and distance have been converged.
Frequency Analysis
A frequency analysis was performed on optimised molecule of [P(CH3)4]+. A B3LYP method and 6-31G basis set were used. The frequency file was published to D-SPACE: DOI:10042/22591
| File Name | P_CH3_3_FREQ_OB810 |
|---|---|
| File Type | .log |
| Calculation Type | FREQ |
| Calculation Method | RB3LYP |
| Basis Set | 6-31G(d,p) |
| Charge | 1 |
| Spin | Singlet |
| Energy (RB3LYP) | -500.83 a.u. |
| RMS Gradient Norm | 0.00000529 a.u. |
| Dipole Moment | 0.0004 Debye |
| Point Group | C1 |
| Job CPU Time | 19 minutes 24.6 seconds |
         Item               Value     Threshold  Converged?
 Maximum Force            0.000015     0.000450     YES
 RMS     Force            0.000005     0.000300     YES
 Maximum Displacement     0.001257     0.001800     YES
 RMS     Displacement     0.000403     0.001200     YES
 Predicted change in Energy=-1.831119D-08
 Optimization completed.
    -- Stationary point found.
 Low frequencies ---  -14.5726   -7.6789    0.0015    0.0017    0.0018   10.2914
 Low frequencies ---  155.5307  191.4654  191.5200
The frequency analysis confirms that [P(CH3)4]+ has successfully been minimised. No negative frequencies were obtained and low frequencies are between plus/minus 15.
Population Analysis
A population analysis was performed on optimised structure of [P(CH34]+ and was published to D-space: DOI:10042/22638 . The results summary is given below:
| File Name | P_CH3_4_MO_OB810 |
|---|---|
| File Type | .log |
| Calculation Type | SP |
| Calculation Method | RB3LYP |
| Basis Set | 6-31G(d,p) |
| Charge | 1 |
| Spin | Singlet |
| Energy (RB3LYP) | -500.83 a.u. |
| RMS Gradient Norm | |
| Dipole Moment | 0.0002 Debye |
| Point Group | C1 |
| Job CPU Time | 53.3 seconds |
[S(CH3)3]+
Optimisation Analysis
An optimisation calculation was performed on molecule of [S(CH3)3]+. A B3LYP method and a 6-31G basis set were used. The optimisation file was published to D-Space: DOI:10042/22596 10042/22596 The results summary and Item have been produced below:
| File Name | )[P(CH3)4]_OPT_631G_OB810 |
|---|---|
| File Type | .log |
| Calculation Type | FOPT |
| Calculation Method | RB3LYP |
| Basis Set | 6-31G(d,p) |
| Charge | 1 |
| Spin | Singlet |
| Energy (RB3LYP) | -517.68 a.u. |
| RMS Gradient Norm | 0.00005942 a.u. |
| Dipole Moment | 0.9650Debye |
| Point Group | C1 |
| Job CPU Time | 16 minutes 51.0 seconds |
         Item               Value     Threshold  Converged?
 Maximum Force            0.000209     0.000450     YES
 RMS     Force            0.000047     0.000300     YES
 Maximum Displacement     0.001172     0.001800     YES
 RMS     Displacement     0.000369     0.001200     YES
 Predicted change in Energy=-6.588300D-08
 Optimization completed.
    -- Stationary point found.
The optimisation has been successful has the 'summary' gradient is below 0.001. All forces and distances have been converged.
Frequency Analysis
A frequency analysis was carried out on optimised structure of [S(CH3)3]+ to ensure that a minimum energy was obtained. The frequency file was published to D-Space DOI:10042/22594 The results summary and Item are given below.
| File Name | [S_CH3_3_FREQ_OB810 |
|---|---|
| File Type | .log |
| Calculation Type | FREQ |
| Calculation Method | RB3LYP |
| Basis Set | 6-31G(d,p) |
| Charge | 1 |
| Spin | Singlet |
| Energy (RB3LYP) | -517.68 a.u. |
| RMS Gradient Norm | 0.00000679 a.u. |
| Dipole Moment | 0.9650Debye |
| Point Group | C1 |
| Job CPU Time | 8 minutes 52.1 seconds |
         Item               Value     Threshold  Converged?
 Maximum Force            0.000014     0.000450     YES
 RMS     Force            0.000005     0.000300     YES
 Maximum Displacement     0.000930     0.001800     YES
 RMS     Displacement     0.000296     0.001200     YES
 Predicted change in Energy=-1.078616D-08
 Optimization completed.
    -- Stationary point found.
The low frequencies are recorded as:
 Low frequencies ---  -10.1509   -5.5679   -0.0027   -0.0021    0.0033    4.8045
 Low frequencies ---  161.7381  199.4204  200.2261
The frequency analysis was successful as the low frequencies are between plus/minus 15.
The predicted IR spectrum is given below:

Population Analysis
A population analysis was completed on performed on optimised structure of [S(CH3)3]+ and published to D-Space: DOI:10042/22637 . The results summary is given below.
| File Name | S_CH3_3_MO |
|---|---|
| File Type | .log |
| Calculation Type | SP |
| Calculation Method | RB3LYP |
| Basis Set | 6-31G(d,p) |
| Charge | 1 |
| Spin | Singlet |
| Energy (RB3LYP) | -517.68 a.u. |
| RMS Gradient Norm | |
| Dipole Moment | 0.9650 Debye |
| Point Group | C1 |
| Job CPU Time | 46.5 seconds |
Comparison of [N(CH3)4]+, [P(CH3)4]+ and [S(CH3)3]+
Structural Comparison
The different bond lengths present in [N(CH3)4]+, [P(CH3)4]+ and [S(CH3)3]+ have been presented in Table 8.
It is clear from the optimisation and frequency calculations of [N(CH3)4]+, [P(CH3)4]+ and [S(CH3)3]+, that both [N(CH3)4]+ and [P(CH3)4]+ adopt a tetrahedral arrangement, as indicated by a C-X-C bond angle of 109.5°. Conversely,[S(CH3)3]+ has a C-X-C bond angle of 102.7°, indicating that it adopts a trigonal pyramidal structure. The lone pair repulsions on the S atom lead to a reduction in the C-S-C bond angle. Thus, it is slightly less than the expected bond angle of a trigonal pyramidal structure.
The difference observed in C-X bond lengths can be rationalised by considering the period and group number of N, P and S. N is found in period 2, group 15. Equally, P is found in period 3, group 15. Whilst S is found in period 3, group 16. Thus, S will have larger, more diffuse orbitals with a lower electron density in regions of overlap, due to its larger size. Consequently, the predicted trend in C-X bond lengths would would be: C-N << C-P < C-S. However the observed trend is: C-N < C-P = C-S. Both [P(CH3)4]+ and [S(CH3)3]+ have the same C-X bond length (correct to 2 d.p.). If a higher basis set was used, a difference in C-P and C-S bond lengths may be observed.
Literature[7] values for organic compounds containing [N(CH3)4]+, [P(CH3)4]+ and [S(CH3)3]+ are provided in Table 9. No value was found for [P(CH3)4]+ [S(CH3)3]+ but bond lengths for neutral compound have been provided.
| Bond | Bond length Å |
|---|---|
| (Csp3)4-N+ | 1.51 |
| (Csp3)3-P | 1.85 |
| (Csp3)2-S | 1.78 |
There is good agreement between literature bond lengths and those calculated.
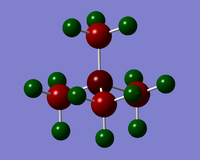
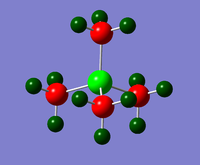
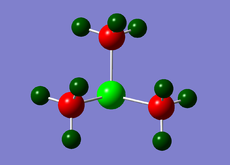
NBO Charge Comparison
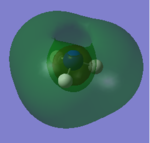
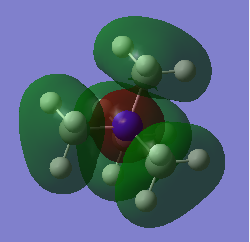
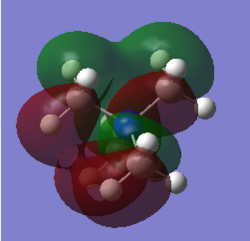
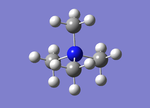
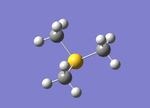
Charge Distribution diagrams for [N(CH3)4]+, [P(CH3)4]+ and [S(CH3)3)]+ are given in Table 10. Likewise, NBO charges for atoms are given in Table 11.
| [N(CH3)4]+ | [P(CH3)4]+ | [S(CH3)3)]+ |
|---|---|---|
 |
 |
|
 |
 |

|
| Cation | X | C | H |
|---|---|---|---|
| [N(CH3)4]+ | -0.295 | -0.483 | +0.269 |
| [P(CH3)4]+ | +1.667 | -1.060 | +0.298 |
| [S(CH3)3)]+ | +0.917 | -0.646 | For each methyl group, 1H has charge = 0.279 and 2H have charge =0.297 |
The observed changes in charge distribution of [N(CH3)4]+, [P(CH3)4]+ and [S(CH3)3)]+ , can be explained by considering the Pauli electronegativities of the atoms present in each cation. The Pauli electronegativities for atoms present are given in Table 12.
| Atom | Electronegativity χ |
|---|---|
| N | 3.04 |
| S | 2.58 |
| C | 2.55 |
| H | 2.2 |
| P | 2.19 |
The following trends in charge distribution can be identified. Firstly, as the central atoms becomes more electronegative, the charge on the central atom becomes more negative. Thus, N has a more negative charge compared to P and S, as it is the most electronegative. Additionally, the charge on the C atom becomes more negative as the central atom becomes more electropositive. Thus, C has a more negative charge in [P(CH3)4]+ compared to [N(CH3)4]+ and [S(CH3)3)]+ , as P is more electropositive compared to N and S.
Comparison of heteroatom contributions to sigma C-X bond
The relative percentage contributions of the heteroatom and carbon atom to C-X bonds in [N(CH3)4]+, [P(CH3)4]+ and [S(CH3)3)]+ are provided in Table 13.
| Cation | X | C |
|---|---|---|
| [N(CH3)4]+ X=N | 66.35 | 33.65 |
| [P(CH3)4]+ X=P | 40.42 | 59.58 |
| [S(CH3)3)]+ X=S | 51.33 | 48.67 |
The difference in electronegativity between the heteroatom and C atom will effect the percentage contribution of each atom to the sigma C-X bond. The electronegativities of C, N, P and S are given in Table 12. The more electronegative atom contributes more to the bonding orbital, as its corresponding atomic orbital (AO) lies deeper in energy. Thus, N will have the largest contribution to the C-N bond as it is the most electronegative, which is what is observed. Conversely, P contributes less to the sigma C-P bond as it less electronegative than C. But P contributes more to the anti bonding sigma C-P bond.
The percentage contributions of the heteroatoms to C-X bond reflect the NBO charges of the heteroatoms. Thus, as N has the most negative charge, it makes the largest contribution to the C-X bond.
Assignment of positive charge in [NR4]+
A molecule of [NR4]+ , where R is an alkyl group, is usually depicted as:
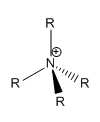
A formal charge is assigned to N atom as it is bonded to four atoms. Equally, C and H atoms are neutral as they bonded to four and one atoms respectfully. It is assumed in this model that only covalent bonding is present in the molecule. However, the NBO charge analysis of [N(CH3)4]+ reveals that N has a negative charge, indicating that there is additional bonding present in the molecule. In [N(CH3)4]+ the positive charge is assigned to the H atom. Also, differences in electronegativities between N and C atoms, lead to the the C-N bond being polarised. As N is more electronegative than C, it bears a negative charge.
Influence of Functional Groups
[N(CH3)3CH2OH]+
Optimisation Analysis
An optimisation calculation with a B3LYP method and a 6-31G basis set was performed on a molecule of [N(CH3)3CH2OH]+ and published to D-SPACE: DOI:/10042/22677 The results summary and Item are given below:
| File Name | N_CH2OH_OPT_631G_OB810 |
|---|---|
| File Type | .log |
| Calculation Type | FOPT |
| Calculation Method | RB3LYP |
| Basis Set | 6-31G(d,p) |
| Charge | 1 |
| Spin | Singlet |
| Energy (RB3LYP) | -289.39 |
| RMS Gradient Norm | 0.00002789 |
| Dipole Moment | 2.1352 Debye |
| Point Group | C1 |
| Job CPU Time | 17 minutes 7.6 seconds |
         Item               Value     Threshold  Converged?
 Maximum Force            0.000072     0.000450     YES
 RMS     Force            0.000014     0.000300     YES
 Maximum Displacement     0.001424     0.001800     YES
 RMS     Displacement     0.000242     0.001200     YES
 Predicted change in Energy=-4.808439D-08
 Optimization completed.
    -- Stationary point found.
The optimisation has been successful as the 'summary' gradient is below 0.001. Equally, all the forces and distances have successfully converged, as indicated by the Item.
Frequency Analysis
A frequency analysis was performed on optimised structure of [N(CH3)3CH2OH]+ and published to D-Space: DOI:10042/22676 . The frequency analysis confirms that [N(CH3)3CH2OH]+ has been successfully minimised, as the respective energies obtained from the optimisation and frequency analysis are equal. The results summary, Item and low frequencies are given below:
| File Name | N_CH2OH_FREQ_OB810 |
|---|---|
| File Type | .log |
| Calculation Type | FREQ |
| Calculation Method | RB3LYP |
| Basis Set | 6-31G(d,p) |
| Charge | 1 |
| Spin | Singlet |
| Energy (RB3LYP) | -289.39 |
| RMS Gradient Norm | 0.00001279 |
| Dipole Moment | 2.1358 Debye |
| Point Group | C1 |
| Job cpu time | 29 minutes 58.5 seconds |
          Item               Value     Threshold  Converged?
 Maximum Force            0.000037     0.000450     YES
 RMS     Force            0.000006     0.000300     YES
 Maximum Displacement     0.001715     0.001800     YES
 RMS     Displacement     0.000394     0.001200     YES
 Predicted change in Energy=-2.162219D-08
 Optimization completed.
    -- Stationary point found.
  Low frequencies ---   -9.0258   -5.0198   -0.0007    0.0006    0.0012    2.0195
 Low frequencies ---  131.0493  213.4808  255.7671
Frequency analysis has successfully completed as the low frequencies are between plus/minus 15.
Population Analysis
A population analysis was performed on optimised structure of [N(CH3)3CH2OH]+. The population file was published to D-Space: DOI:10042/22705 and the results summary is given below.
| File Name | N_CH2OH_POP_OB810 |
|---|---|
| File Type | .log |
| Calculation Type | SP |
| Calculation Method | RB3LYP |
| Basis Set | 6-31G(d,p) |
| Charge | 1 |
| Spin | Singlet |
| Energy (RB3LYP) | -289.39 a.u. |
| RMS Gradient Norm | |
| Dipole Moment | 2.1358 Debye |
| Point Group | C1 |
| Job cpu Time | 1 minute 5.0 seconds |
[N(CH3)3CH2CN]+
Optimisation Analysis
A optimisation calculation with a B3LYP method and a 6-31G basis set was applied to a molecule of [N(CH3)3CH2CN]+ and published to D-Space: DOI:10042/22675 . The results summary and Item are given below.
| File Name | N_CH2OH_OPT_631G |
|---|---|
| File Type | .log |
| Calculation Type | FOPT |
| Calculation Method | RB3LYP |
| Basis Set | 6-31G(d,p) |
| Charge | 1 |
| Spin | Singlet |
| Energy (RB3LYP) | -306.39 a.u. |
| RMS Gradient Norm | 0.00001888 a.u. |
| Dipole Moment | 5.7631 Debye |
| Point Group | C1 |
| Job CPU Time | 7 minutes 4.2 seconds |
          Item               Value     Threshold  Converged?
 Maximum Force            0.000050     0.000450     YES
 RMS     Force            0.000009     0.000300     YES
 Maximum Displacement     0.000876     0.001800     YES
 RMS     Displacement     0.000231     0.001200     YES
 Predicted change in Energy=-2.076840D-08
 Optimization completed.
    -- Stationary point found.
The optimisation has been successful as the 'summary' gradient is below 0.001 and all forces and distances have converged as indicated by the Item.
Frequency Analysis
Frequency Analysis was applied to optimised molecule of [N(CH3)3CH2CN]+ and published to D-Space: DOI:10042/22682 . A B3LYP method and 6-31G basis set was used. The frequency analysis confirms that [N(CH3)3CH2CN]+ has been minimised as the energies obtained from the optimisation and frequency analysis are equal. The Results Summary, Item and low frequencies are provided below.
| File Name | N_CH2CN_FREQ_OB810 |
|---|---|
| File Type | .log |
| Calculation Type | FREQ |
| Calculation Method | RB3LYP |
| Basis Set | 6-31G(d,p) |
| Charge | 1 |
| Spin | Singlet |
| Energy (RB3LYP) | -306.39 a.u. |
| RMS Gradient Norm | 0.00000601 |
| Dipole Moment | 5.7640 Debye |
| Point Group | C1 |
| Job CPU Time | 31 minutes 51.5 seconds |
          Item               Value     Threshold  Converged?
 Maximum Force            0.000011     0.000450     YES
 RMS     Force            0.000003     0.000300     YES
 Maximum Displacement     0.000636     0.001800     YES
 RMS     Displacement     0.000123     0.001200     YES
 Predicted change in Energy=-2.924757D-09
 Optimization completed.
    -- Stationary point found.
 Low frequencies ---   -2.7865   -0.0005   -0.0003    0.0005    7.1337    9.6490
 Low frequencies ---   91.7767  154.0354  210.9244
The frequency analysis has been successful as the low frequencies are between plus/minus 15.
Population Analysis
A population analysis was performed on optimised structure of [N(CH3)3CH2CN]+. The population file was published to D-Space: DOI:10042/22707 . The results summary is given below.
| File Name | N_CH2CN_POP_OB810 |
|---|---|
| File Type | .log |
| Calculation Type | SP |
| Calculation Method | RB3LYP |
| Basis Set | 6-31G(d,p) |
| Charge | 1 |
| Spin | Singlet |
| Energy (RB3LYP) | -306.39 a.u. |
| RMS Gradient Norm | |
| Dipole Moment | 5.7631 Debye |
| Point Group | C1 |
| Job CPU Time | 1 minutes 39.3 seconds |
Comparison of [N(CH3)4]+, [N(CH3)3CH2OH]+ and [N(CH3)3CH2CN]+
The corresponding HUMO and LUMO of [N(CH3)4]+, [N(CH3)3CH2OH]+ and [N(CH3)3CH2CN]+ are given in Table 14, along with their relative energies.
The atomic orbital contributions to the HOMO and LUMO, differ between [N(CH3)4]+ and the functionalised cations. The HOMO of [N(CH3)4]+ is evenly distributed over all atoms. Likewise, the LUMO of [N(CH3)4]+ is also evenly distributed over the whole cation. Conversely, the HOMOs of [N(CH3)3CH2OH]+ and [N(CH3)3CH2CN]+ have a significant contribution from the functional group, and only a small contribution from the N atom and methyl groups. However, the LUMOs of [N(CH3)3CH2OH]+ and [N(CH3)3CH2CN]+ are more evenly distributed over the whole cation.
It is also noted that the HOMO has been raised in energy for both [N(CH3)3CH2OH]+ and [N(CH3)3CH2CN]+, with respect to [N(CH3)4]+. Additionally, the LUMO has been raised in energy for [N(CH3)3CH2OH]+ but has been lowered in energy for [N(CH3)3CH2CN]+, with respect to [N(CH3)4]+. Overall, the energy gap between the HOMO and LUMO of the functionalised cations has decreased. Consequently, the reactivity of the functionalised cations will differ from [N(CH3)4]+ as a result of the energy difference between the HUMO and LUMO. Thus, it would be predicted that [N(CH3)3CH2OH]+ and [N(CH3)3CH2CN]+ would react more readily, due to the smaller HOMO/LUMO energy gap. For example, [N(CH3)3CH2CN]+ would be easily reduced as it has the smallest HUMO/LUMO energy gap and the lowest lying energy LUMO.
NBO Analysis
A natural bond analysis (NBO) was performed on the optimised structure of [N(CH3)3CH2OH]+ and [N(CH3)3CH2CN]+.
| OH | CN | |
|---|---|---|
 |
| |
 |

|
A hyroxyl group is an electron donating (EDG), whilst a nitrile group is electron withdrawing (EWG). The presence of functional groups might be predicted to effect the NBO charge on the central N atom. This is observed in a molecule of [N(CH3)3CH2OH]+, as the N NBO charge changes from -0.296, in un-functionalised cation, to -0.322. However, only a small change is observed in [N(CH3)3CH2CN]+, as the N NBO charge changes from -0.296 to -0.289. Additionally, the functional groups have a large effect on the NBO charge of the C atom of the adjacent CH2 group. These effects are summarised in Tables 14 and 15.
| Atom | NBO Charge |
|---|---|
| N (central atom) | -0.289 |
| -CH2 | 0.309 |
| -CN | -0.186 |
| -CN | 0.209 |
| Atom | NBO Charge |
|---|---|
| N (central atom) | -0.322 |
| -CH2 | 0.089 |
| -OH | -0.725 |
| -OH | 0.521 |
References
- ↑ HPC Handbook of Chemistry and Physics, 2012, 93rd Edition, Chapter 9 p21
- ↑ HPC Handbook of Chemistry and Physcis, 2012, 93rd Edition, Chapter 9 p21
- ↑ HPC Handbook of Chemistry and Physics, 2012, 93rd Edition, Chapter 9, p30
- ↑ CRC Handbook of Chemistry and Physics, 2012, 93rd Edition, Chapter 9, p20
- ↑ CRC Handbook of Chemistry and Physics, 2012, 93rd Edition, Chapter 9, p26
- ↑ CRC Handbook of Chemistry and Physics, 2012, 93rd Edition, Chapter 9, p26
- ↑ CRC Handbook of Chemistry and Physics, 2012 93rd Edition, Chapter 9, pp6-11

