Rep:Title=Mod:NAS13
EX3
Optimisation and Frequency
| Property | BH3 | BBr3 | GaBr3 |
|---|---|---|---|
| r(E-X)/angstrom | 1.19 | 1.93 | 2.90 |
| θ(X-E-X)/deg | 120.0 | 120.0 | 120.0 |
BH3
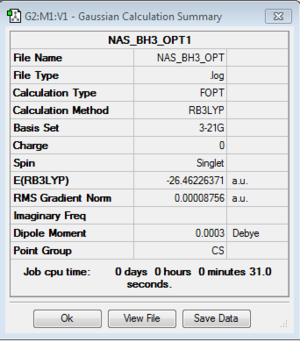
B3LYP/3-21G level
Optimisation log file here
B3LYP/6-21G (dp) level
Optimisation log file here
| summary data | convergence | Jmol | |||
|---|---|---|---|---|---|
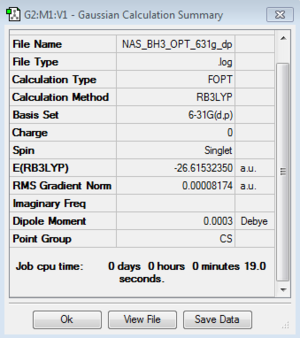
|
Item Value Threshold Converged? Maximum Force 0.000203 0.000450 YES RMS Force 0.000098 0.000300 YES Maximum Displacement 0.000867 0.001800 YES RMS Displacement 0.000415 0.001200 YES |
|
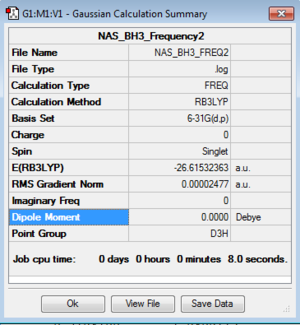
Frequency log file here
| summary data | low modes | |
|---|---|---|
|
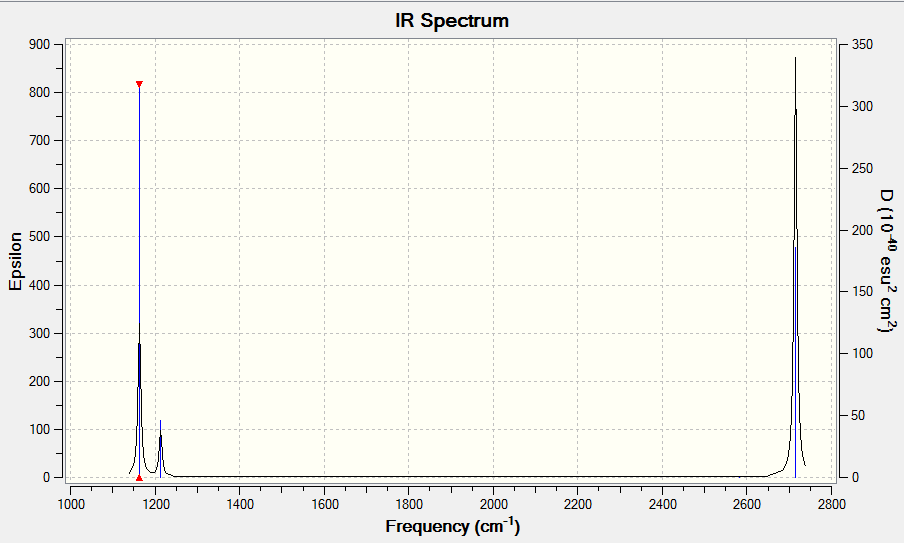
Low frequencies --- -0.2268 -0.0081 -0.0006 22.1146 22.1157 24.1362 Low frequencies --- 1163.1747 1213.2735 1213.2737 |
NBO
Energy file DOI:10042/104583
BBr3
B3LYP/6-31G(d,p)LANL2DZ level
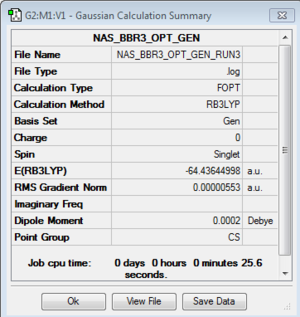
Optimisation log file here or DOI:10042/93114
| summary data | convergence | Jmol | |||
|---|---|---|---|---|---|
|
Item Value Threshold Converged? Maximum Force 0.000011 0.000450 YES RMS Force 0.000007 0.000300 YES Maximum Displacement 0.000047 0.001800 YES RMS Displacement 0.000031 0.001200 YES |
|
GaBr3
B3LYP/LanL2DZ Level
Optimisation log file here or DOI:10042/88033
| summary data | convergence | Jmol | |||
|---|---|---|---|---|---|

|
Item Value Threshold Converged? Maximum Force 0.000203 0.000450 YES RMS Force 0.000098 0.000300 YES Maximum Displacement 0.000867 0.001800 YES RMS Displacement 0.000415 0.001200 YES |
|
Frequency log file here or DOI:10042/101735
| summary data | low modes | |
|---|---|---|

|
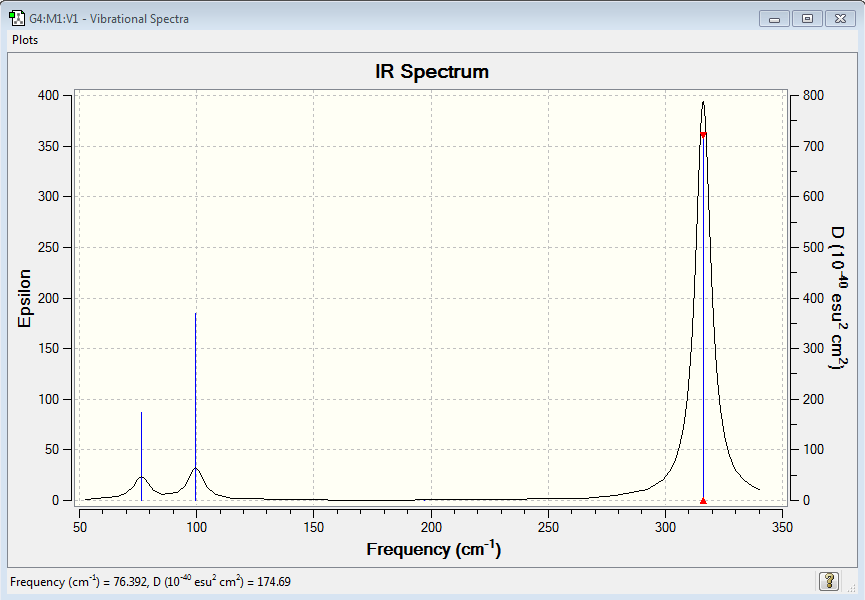
Low frequencies --- -1.4878 -0.0015 -0.0002 0.0096 0.6540 0.6540 Low frequencies --- 76.3920 76.3924 99.6767 |
Optimisation Analysis
A bond is formed by the overlap of electron wavefunctions or atomic orbitals (of correct symmetry and similar energies) between atoms which interact to form new molecular orbitals which result in the overall lowering in potential energy of the molecule. Strong bonds arise when there is a significant interaction, and therefore lowering in energy, of AOs which occurs when the AOs are of similar energy and have high density. An example is a homodiatomic covalent bond such as C-C. A medium strength bond could be a heterodiatomic covalent bond of large atoms where there is a difference in energy of the AOs and hence the overlap is less efficient, resulting in a smaller lowering in energy than with the homodiatomic. For example, I-Se bond (mismatch in diffuse orbital’s size). The weakest bonds in this picture are those where there is only transient overlap of AOs, for example hydrogen bonding liquid water where thermal motion is continuously forming and breaking the weak bonds. We will use this basis to comment on our results below. NB: when interpreting bonds in Gaussview we need to remember the caveat that Guassview uses a predefined distance criteria to mark on bonds. (Similarly, most people use some predefinition of their own when drawing bonds with pen and paper- organic chemists draw c-c bonds all the time, but do not always painstakingly mark on hydrogen bonds….) BH3, BBr3 and GaBr3 are all trigonal planar complexes with an electron deficient group 13 element at their core. Naturally the bond length increases as Ga and Br are substituted for B and H respectively, as these heavier elements have larger valance orbitals. B-Br and Ga-Br bonds are formed via overlap of electron wavefunctions, and the sharing of electron density between the atoms contribute to forming a minimum on the potential energy surface. Ga-Br is the combination with the largest valance orbitals and hence we see that the bond equilibrium point occurs at a greater interatomic distance, whereas boron and hydrogen have valance orbitals with primary quantum number=1 and 2 respectively so form the shortest covalent bonds we studied. Additionally the strength of the bond is dependent on the size of the central atom, with the Ga valence orbitals being larger and more diffuse than the B orbitals, any overlap with ligand orbitals is less efficient and hence the stabilisation energy from the interaction is smaller in magnitude. B-Br bonds have a degree of double bond character, whereas B-H are singular in nature. Using a hybrid orbital approach, we consider B to be sp2 hybrid with a vacant pz orbital out of plane with the molecule. In B-H, this orbital remains unaffected by mixing since H does not possess any orbitals low enough in energy and of the correct symmetry to interact with it. However Br has a lone pair occupying the 4pz orbital. The interaction between these pz orbitals leads to a lowering of energy of molecule and forms a MO that smears some of the Br electron density towards the electron deficient B, hence a bond order above 1 is presence. A bond is formed by the overlap of electron wavefunctions or atomic orbitals (of correct symmetry and similar energies) between atoms which interact to form new molecular orbitals which result in the overall lowering in potential energy of the molecule.
Vibrational Analysis
Vibrational Analysis of BH3
BH3 and GaBr3 both have 6 vibrational modes, in accordance with the 3N-2 rule. Moreover, both only have 3 visible peaks on the IR spectra. The modes at 2582 cm-1 on BH3 and at 197 cm-1 on GaBr3 are symmetric stretches which result in no change in dipole moment so are not IR active. We also note from our calculations that each molecule possess two sets of degenerate vibrational modes (1 set of bends and 1 of stretches per molecule). This means they reinforce each other on the spectra. It is also fruitful to note that the asymmetric stretch, whilst being more energetic in nature, also produce a greater intensity signal in the IR Spectrum due to the more pronounced change in dipole moment. GaBr3 has vibrational modes of a much less energetic nature than BH3. This reflects the fact that the Ga-Br bond is weaker (therefore the spring constant is smaller) and also the masses of the ligands are much larger. As a consequence the energy required to excite the molecule to the first vibrational mode is much less than required for the stronger, shorter B-H bond. We also notice that, especially for the A2’’ umbrella mode, that the Ga centre has a greater displacement along the z axis than B does in borane. This can be simply explained by the notion that the molecule is being considered in the centre of mass frame, so in order to conserve the CoM the central atom migrates in the opposite direction to the ligands. Since Ga makes up a much smaller fraction (less than ¼) of total mass of the molecule, there is a much greater displacement compared to Boron. The same basis set and methods are used when calculating frequencies and optimisations so we can draw a meaningful comparison between the molecules. Being inconsistent with frequency/optimisation calculations would lead to spurious results because of the difference in calculation methods using different potential energy surfaces. The purpose of carrying out frequency analysis, is mainly to confirm that we have reached a global energy minima. If all of our frequencies are positive it shows we have found a minimum, whereas if one or more are negative it shows we lie on a saddle on the potential energy surface and we have not acquired a fully optimised structure. The calculation also provides information about the vibrational modes of the molecules which we can compare our generated modes with those observed in experiment. The low frequencies show the movements of the centre of mass away from the equilibrium positions. We would expect these to relatively small otherwise this is signalling a large translational movement of the central (more massive atom).
| wavenumber | Intensity | IR active? | type |
| 1163 | 93 | yes | bend |
| 1213 | 14 | weak | bend |
| 1213 | 14 | weak | bend |
| 2582 | 0 | no | symmetric stretch |
| 2715 | 126 | yes | asymmetric stretch |
| 2715 | 126 | yes | asymmetric stretch |
Vibrational Analysis of GaBr3
| wavenumber | Intensity | IR active? | type |
| 76 | 3 | weak | bend |
| 76 | 3 | weak | bend |
| 100 | 9 | yes | bend |
| 197 | 0 | no | symmetric stretch |
| 316 | 57 | yes | asymmetric stretch |
| 316 | 57 | yes | asymmetric stretch |
NH3
B3LYP/6-31G(d,p)Level
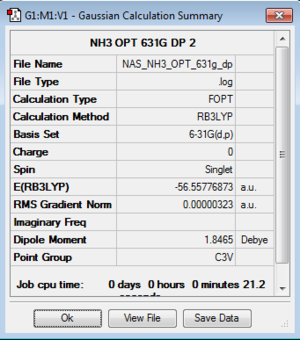
Optimisation log file here or DOI:10042/104984
| summary data | convergence | Jmol | |||
|---|---|---|---|---|---|
|
Item Value Threshold Converged? Maximum Force 0.000006 0.000450 YES RMS Force 0.000004 0.000300 YES Maximum Displacement 0.000012 0.001800 YES RMS Displacement 0.000008 0.001200 YES |
|
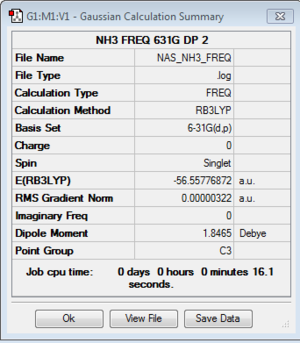
Frequency log file here or DOI:10042/105000
| summary data | low modes | |
|---|---|---|
|
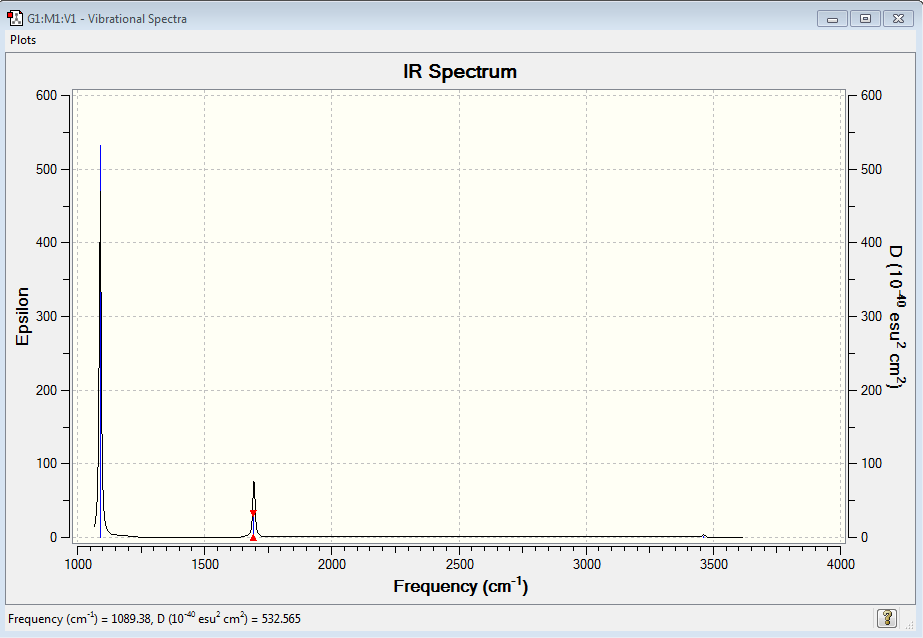
Low frequencies --- -0.0138 -0.0026 -0.0009 7.0783 8.0932 8.0937 Low frequencies --- 1089.3840 1693.9368 1693.9368 |
Vibrational Analysis of NH3
INSERT EXPLANATION OF WHY CERTAIN PEAKS SHOW UP AND WHY DEGENERACY
| wavenumber | Intensity | IR active? | type |
| 1089 | 145 | strong | bend |
| 1694 | 14 | weak | bend |
| 1694 | 14 | weak | bend |
| 3461 | 1 | weak | symmetric stretch |
| 3590 | 0 | no/weak | asymmetric stretch |
| 3590 | 0 | no/weak | asymmetric stretch |
NBO
Energy file DOI:10042/105042
NH3BH3
B3LYP/6-31G(d,p)Level
Optimisation log file here or DOI:10042/106796
| summary data | convergence | Jmol | |||
|---|---|---|---|---|---|
|
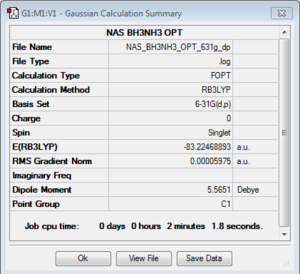
Item Value Threshold Converged? Maximum Force 0.000122 0.000450 YES RMS Force 0.000058 0.000300 YES Maximum Displacement 0.000513 0.001800 YES RMS Displacement 0.000296 0.001200 YES |
|
Frequency log file DOI:10042/106827
| summary data | low modes | |
|---|---|---|

|
Low frequencies --- -0.0251 -0.0032 -0.0007 17.1421 17.1447 37.2025 Low frequencies --- 265.8016 632.2134 639.3555 |
Vibrational Analysis of NH3BH3
| wavenumber | Intensity | IR active? | type |
| 266 | 0.0000 | no | bend |
| 632 | 14 | weak | stretch |
| 639 | 4 | weak | bend |
| 639 | 4 | weak | bend |
| 1069 | 41 | Yes | bend |
| 1069 | 41 | Yes | bend |
| 1196 | 110 | yes | bend |
| 1204 | 3 | weak | bend |
| 1204 | 3 | weak | bend |
| 1330 | 114 | yes | bend |
| 1676 | 28 | yes | bend |
| 1676 | 28 | yes | bend |
| 2470 | 67 | yes | stretch |
| 2530 | 231 | yes | stretch |
| 2530 | 231 | yes | stretch |
| 3462 | 3 | weak | stretch |
| 3580 | 28 | yes | stretch |
| 3580 | 28 | yes | stretch |
Energy of stabilisation of ammonia lp donation to borane
ΔE=E(NH3BH3)-[E(NH3)+E(BH3)]=-83.2246889+56.5577687+26.6153235=-0.0515967 au -0.0515967*2625.50 (au->kjmol-1 conversion factor) =-135.47 kjmol-1
As we can see the donation of the ammonia lone pair into the electron deficient borane pz orbital produces a stark lowering in energy of the system compared to the two isolated molecules. The value of -135 kj/mol is in line with weak covalent bonds, such as I-I (148kj/mol), however we expect at room temperature the bond is readily formed as the enthalpy of bond formation would overcome the reduction in entropy of the molecule. We also note the change of geometry of the BH3 molecule to more of a tetrahedral-like structure. This can be rationalised by the change in hybridisation from sp2 to sp3.
Comparison of LCAO and MO
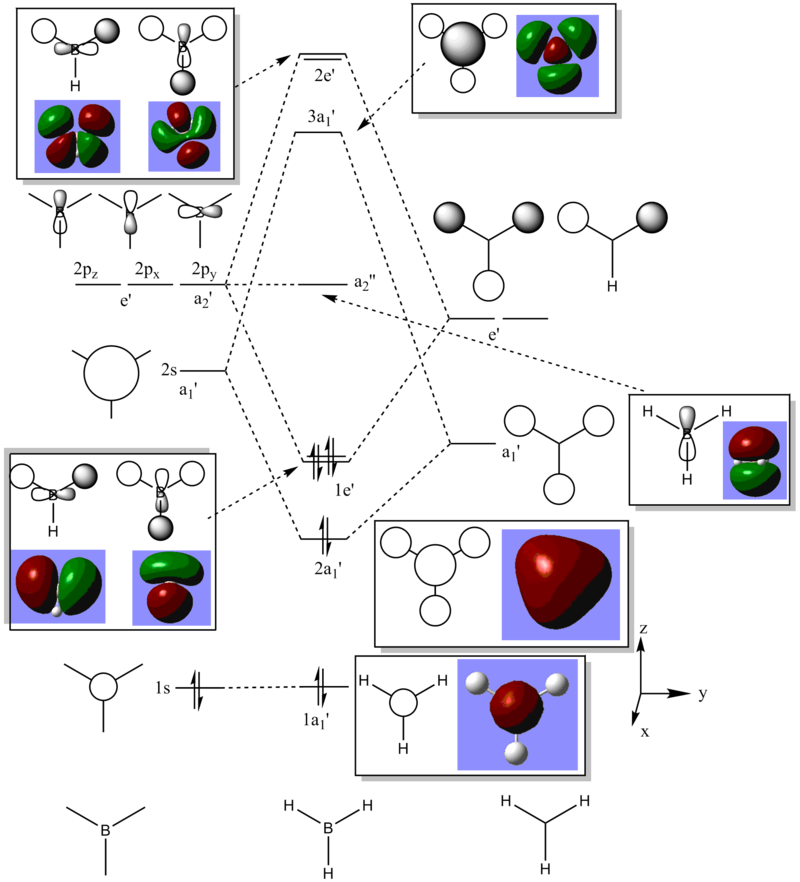
The similarity between the calculated MOs and the hand drawn AOs is striking. Not only do the LCAO predict the areas of opposite polarity and the correct nodal planes, but with a little imagination they correspond well to the through-space interactions which are fully incorporated in the MO calculation. For example the 1e’ orbitals show that there is significant electron density in between the LCAO representation, but this could have been guessed from the LCAO representation.
AROMATICITY PROJECT
Log Files on DSpace
| Calculation | Benzene | Boratabenzene | Pyridinium | Borazine |
|---|---|---|---|---|
| Optimisation | DOI:10042/107118 | DOI:10042/107249 | DOI:10042/107337 | DOI:10042/107464 |
| Frequency | DOI:10042/107150 | DOI:10042/107289 | DOI:10042/107372 | DOI:10042/107494 |
| Energy | DOI:10042/107203 | DOI:10042/107313 | DOI:10042/107399 | DOI:10042/107517 |
Optimisation Summaries
B3LYP/6-31G(d,p)Level
| Molecule | summary data | convergence | Jmol | |||
|---|---|---|---|---|---|---|
| Benzene | 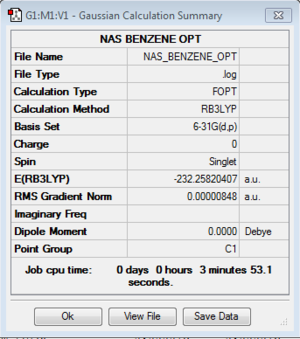
|
         Item               Value     Threshold  Converged?
 Maximum Force            0.000013     0.000015     YES
 RMS     Force            0.000004     0.000010     YES
 Maximum Displacement     0.000054     0.000060     YES
 RMS     Displacement     0.000017     0.000040     YES
 Predicted change in Energy=-1.965794D-09
 Optimization completed.
    -- Stationary point found.
|
| |||
| Boratabenzene | 
|
         Item               Value     Threshold  Converged?
 Maximum Force            0.000011     0.000015     YES
 RMS     Force            0.000002     0.000010     YES
 Maximum Displacement     0.000045     0.000060     YES
 RMS     Displacement     0.000012     0.000040     YES
 Predicted change in Energy=-6.280187D-10
 Optimization completed.
    -- Stationary point found.
|
| |||
| Pyridinium | 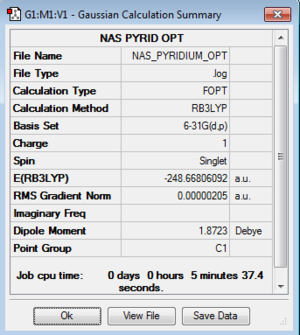
|
         Item               Value     Threshold  Converged?
 Maximum Force            0.000004     0.000015     YES
 RMS     Force            0.000001     0.000010     YES
 Maximum Displacement     0.000010     0.000060     YES
 RMS     Displacement     0.000004     0.000040     YES
 Predicted change in Energy=-9.102519D-11
 Optimization completed.
    -- Stationary point found.
|
| |||
| Borazine | 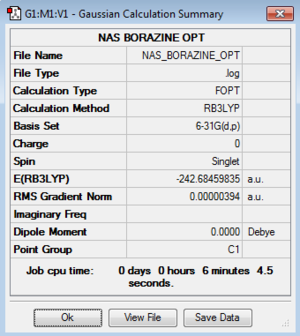
|
         Item               Value     Threshold  Converged?
 Maximum Force            0.000008     0.000015     YES
 RMS     Force            0.000002     0.000010     YES
 Maximum Displacement     0.000028     0.000060     YES
 RMS     Displacement     0.000010     0.000040     YES
 Predicted change in Energy=-4.874603D-10
 Optimization completed.
    -- Stationary point found.
|
|
Frequencies
| Molecule | Summary | Low Frequencies |
| Benzene | 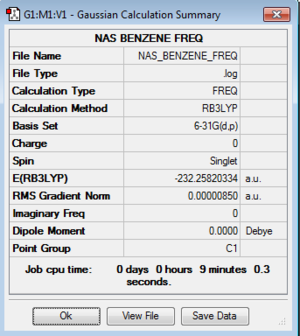
|
Low frequencies --- -5.0211 -4.6278 -0.0005 0.0004 0.0009 3.2465 Low frequencies --- 414.5375 414.5498 621.0653 |
| Boratobenzene | 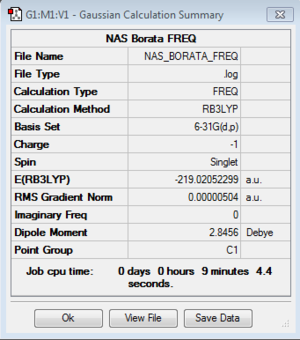
|
Low frequencies --- -7.2623 -0.0008 -0.0003 0.0005 3.1684 4.5341 Low frequencies --- 371.2962 404.4164 565.0824 |
| Pyridinium | 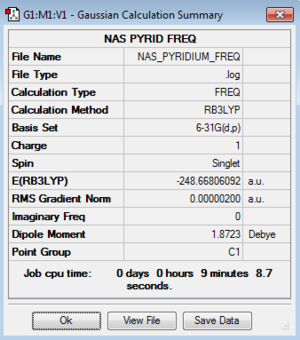
|
Low frequencies --- -9.3855 -2.9634 -0.0006 -0.0003 0.0006 0.8971 Low frequencies --- 391.9002 404.3426 620.1994 |
| Borazine | 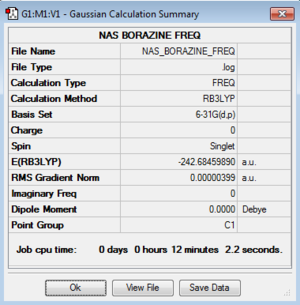
|
Low frequencies --- -8.1276 -2.9521 0.0005 0.0008 0.0011 5.9497 Low frequencies --- 289.5749 289.6524 404.4430 |
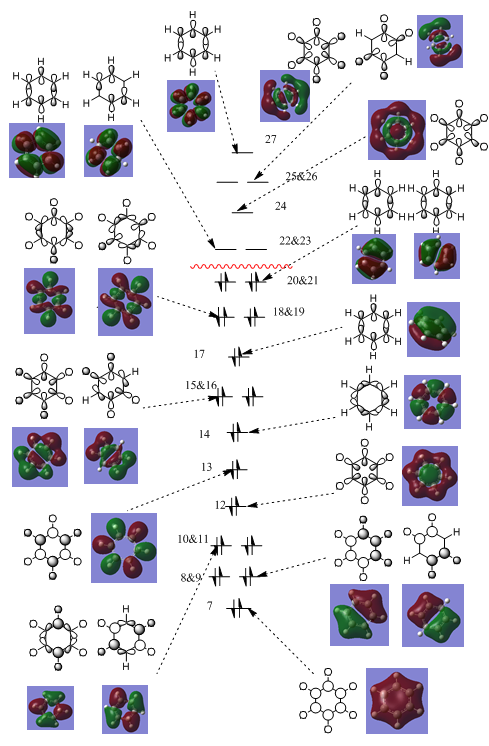
Simplified Molecular Orbital Diagram of Benzene
The following diagram compares the LCAO orbital representation and the molecular orbitals produced from calculation. There is a strong similarity between the two representations, paying testament to the validity of the LCAO approximation for molecular orbitals. The molecular orbital diagram can be split into those which contribute to the sigma framework and those that contribute to the out of plane π network, namely orbitals 17, 20-23 inclusive and 27. The sigma framework comprises of the MOs that are low in energy (7-17 and 18-19) and are responsible for the stability of the C-H bonds and much of the stability of the C-C bonds. The π network is formed from the overlap of the carbon pz orbitals. The lowest energy π MO (17) presents a ring of delocalised electrodensity that only possesses 1 nodal plane. The next degenerate set of π orbitals again present an area of delocalised electrodenisty, however there is a second nodal plane which bisects the ring and divides two regions of opposite polarisation. Now we have established that there is a delocalised п system present the other condition for aromaticity is the electron occupation. To ensure that only the bonding orbitals are occupied we know that a п system must contain 4n+2 electrons. We find this Huckel Criteria is fulfilled as there are 6 electrons present and therefore benzene can be confirmed as aromatic.
NBO ANALYSIS
| Type | Benzene | Boratabenzene | Pyridinium | Borazine |
Colour Charge Representation |
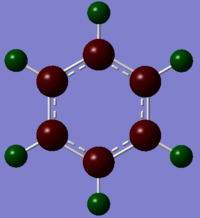 |
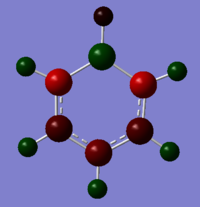 |
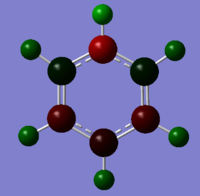 |
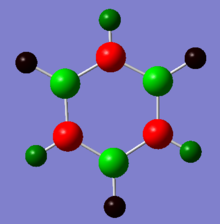 |
Numeric Charge Representation |
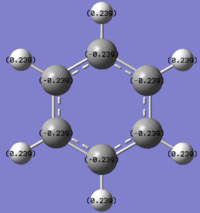 |
 |
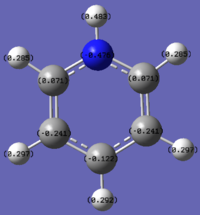 |
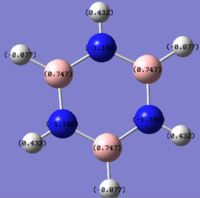 |
Please note the range of the coloured representation is normalised to between -1 and 1 for ease of comparison.
Firstly we note that in benzene the carbon atoms have a higher charge density and the hydrogens. This is because carbon is more electronegative than hydrogen due to its higher effective nuclear charge, so the bonding orbitals containing the electrons contain more carbon orbital character and have more density on the carbon than the hydrogen. We should also note due to the high level of symmetry (D6h) all carbons have the same relative charge and likewise so do all hydrogen atoms.
Boron is less electronegative than hydrogen and even less electronegative than carbon. This means that there is a lesser contribution to the bonding MOs from boron than carbon, and a greater contribution to the anti-bonding orbitals. As a consequence the boron atom is positively charged (0.208) and the neighbouring carbons are more negatively charged than in benzene. This largely down to effects on the sigma framework rather than the π network, because the sigma network orbitals of boron are in plane so have a larger amount of density closer to carbon atoms. We also note that the carbon para to the boron atom is more negatively charged than in benzene as the electropositive boron pushes electron density across the ring.
Pyridinium contains the electronegative Nitrogen atom. This contributes to a greater extent to the low energy bonding orbitals and hence there is greater electron density associated with the negatively charged Nitrogen. In the reverse case to boratabenzene the carbons adjacent to nitrogen are relatively positive, due to their proximity to the nitrogen. The para carbon is slightly less negative than may be expected when compared to benzene, this can be explained by invoking resonance structures of the pyridinium in which the para and meta carbons can hold a localised positive charge.
Borazine demonstrates a mixture of these effects. The electronegativity difference between the boron and nitrogen is greater than any of the previous comparisons and as a consequence the magnitude of the charges is at a greater scale. Essentially at this point the molecule is becoming less delocalised with a large part of the electrodensity situated on the nitrogens and their adjacent hydrogens.
MO comparison
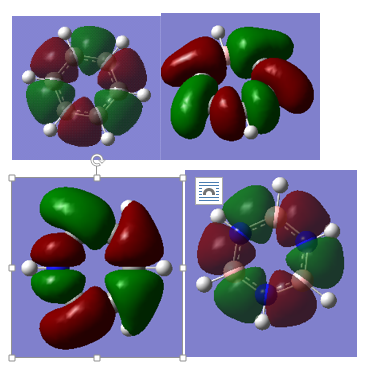
Clockwise from top left: benzene, boratobenzene, pyridinium and borazine
This set makes up part of the c-c sigma framework. As we can see the symmetry is a key factor is the shape of these orbitals, with both benzene and borazine showing the same shaped MO. However more interestingly the MO in the boratobenzene orbitals curl away from boron since it is electropositive. And likewise the orbitals curl towards the electronegative nitrogen.
Clockwise from top left: benzene, boratobenzene, pyridinium and borazine

