
Rep:Title=Mod:ELMI
Inorganic Computational
Objectives
To use computational techniques and carry out simple calculations with the aim to learn more about small molecules including optimising structures and predicting IR spectra.
Part 1
Optimising the structure of molecules
Analysing the optimised BH3
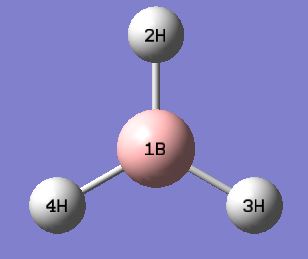
A molecule of BH3 was created on Gaussian 5.0. The bond lengths were manually set at 1.53,1.54 and 1.55 Å. An optimisation calculation was run on the same program using the 3-21G basis set. The resulting bond angles and lengths were found to be 120.0 o and 1.19 Å, respectively. This is an expected result for BH3, which has the D3h symmetry group. More information, including the final energy, can be seen in Table 1.
| File type | .log |
| Calculation type | FOPT |
| Calculation method | RB3LYP |
| Basis set | 3-21G |
| Final energy (a.u.) | -26.4622429 |
| Gradient (a.u.) | 0.00008851 |
| Dipole moment (D) | 0.00 |
| Point group | Cs |
| Calculation time (s) | 20.0 |
   Item               Value     Threshold  Converged?
 Maximum Force            0.000220     0.000450     YES
 RMS     Force            0.000106     0.000300     YES
 Maximum Displacement     0.000940     0.001800     YES
 RMS     Displacement     0.000447     0.001200     YES
 Predicted change in Energy=-1.672479D-07
 Optimization completed.
    -- Stationary point found.
                           ----------------------------
                           !   Optimized Parameters   !
                           ! (Angstroms and Degrees)  !
 --------------------------                            --------------------------
 ! Name  Definition              Value          Derivative Info.                !
 --------------------------------------------------------------------------------
 ! R1    R(1,2)                  1.1948         -DE/DX =   -0.0002              !
 ! R2    R(1,3)                  1.1947         -DE/DX =   -0.0002              !
 ! R3    R(1,4)                  1.1944         -DE/DX =   -0.0001              !
 ! A1    A(2,1,3)              120.0157         -DE/DX =    0.0                 !
 ! A2    A(2,1,4)              119.986          -DE/DX =    0.0                 !
 ! A3    A(3,1,4)              119.9983         -DE/DX =    0.0                 !
 ! D1    D(2,1,4,3)            180.0            -DE/DX =    0.0                 !
 --------------------------------------------------------------------------------
Please find the corresponding .log file here
3-21G is considered a small basis set and it was desirable to use more functions to describe the electronic structure. Therefore, the 6-31G(d,p) basis set was chosen since it uses d and p-orbital functions. Again the bond angles and lengths were recorded and found to equal 120.0 o and 1.19 Å. These are the same results as when using the 3-21G basis set. The bond lengths were slightly smaller when looking past two decimal places however this calculation is known to only be accurate to 0.01 Å.
| File type | .log |
| Calculation type | FOPT |
| Calculation method | RB3LYP |
| Basis set | 6-31G(d,p) |
| Final energy (a.u.) | -26.61532358 |
| Gradient (a.u.) | 0.00008206 |
| Dipole moment (D) | 0.00 |
| Point group | Cs |
| Calculation time (s) | 16.0 |
Item               Value     Threshold  Converged?
 Maximum Force            0.000204     0.000450     YES
 RMS     Force            0.000099     0.000300     YES
 Maximum Displacement     0.000875     0.001800     YES
 RMS     Displacement     0.000418     0.001200     YES
 Predicted change in Energy=-1.452109D-07
 Optimization completed.
    -- Stationary point found.
                           ----------------------------
                           !   Optimized Parameters   !
                           ! (Angstroms and Degrees)  !
 --------------------------                            --------------------------
 ! Name  Definition              Value          Derivative Info.                !
 --------------------------------------------------------------------------------
 ! R1    R(1,2)                  1.1928         -DE/DX =   -0.0002              !
 ! R2    R(1,3)                  1.1926         -DE/DX =   -0.0002              !
 ! R3    R(1,4)                  1.1924         -DE/DX =    0.0                 !
 ! A1    A(2,1,3)              120.0146         -DE/DX =    0.0                 !
 ! A2    A(2,1,4)              119.9866         -DE/DX =    0.0                 !
 ! A3    A(3,1,4)              119.9988         -DE/DX =    0.0                 !
 ! D1    D(2,1,4,3)            180.0            -DE/DX =    0.0                 !
 --------------------------------------------------------------------------------
Please find the corresponding .log file here
Using psuedo-potentials and larger basis sets
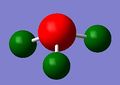
A molecule of GaBr3 was created and optimised in a similar way to BH3. However, during this calculation the symmetry point group was set as D3h and the LANL2DZ basis set was chosen, which is a medium level basis set that includes psuedo-potentials for heavier atoms such as gallium and bromine. As well, additional words such as "opt=tight" and "int=ultrafine" were added to the calculation to ensure the molecule was optimised. The results can be seen in Table 3 and the resulting bond angles and lengths were 120 o and 2.35 Å. The calculated bond lengths are concordant with a trigonal planar molecule and the bond lengths show good agreement with the literature's 2.33 Å [1].
| File type | .log |
| Calculation type | FOPT |
| Calculation method | RB3LYP |
| Basis set | LANL2DZ |
| Final energy (a.u.) | -41.70082783 |
| Gradient (a.u.) | 0.00000016 |
| Dipole moment (D) | 0.00 |
| Point group | D3h |
| Calculation time (s) | 10.0 |
Item               Value     Threshold  Converged?
 Maximum Force            0.000000     0.000015     YES
 RMS     Force            0.000000     0.000010     YES
 Maximum Displacement     0.000003     0.000060     YES
 RMS     Displacement     0.000002     0.000040     YES
 Predicted change in Energy=-1.297295D-12
 Optimization completed.
    -- Stationary point found.
                           ----------------------------
                           !   Optimized Parameters   !
                           ! (Angstroms and Degrees)  !
 --------------------------                            --------------------------
 ! Name  Definition              Value          Derivative Info.                !
 --------------------------------------------------------------------------------
 ! R1    R(1,2)                  2.3502         -DE/DX =    0.0                 !
 ! R2    R(1,3)                  2.3502         -DE/DX =    0.0                 !
 ! R3    R(1,4)                  2.3502         -DE/DX =    0.0                 !
 ! A1    A(2,1,3)              120.0            -DE/DX =    0.0                 !
 ! A2    A(2,1,4)              120.0            -DE/DX =    0.0                 !
 ! A3    A(3,1,4)              120.0            -DE/DX =    0.0                 !
 ! D1    D(2,1,4,3)            180.0            -DE/DX =    0.0                 !
 --------------------------------------------------------------------------------
Please find the corresponding .log file here
A similar calculation was run on a molecule of BBr3, with the results in Table 4. The Gen basis set allows the basis set for each individual atom to be decided. In this case, 6-31G(d,p) was chosen for boron but LanL2DZ was used for the bromine atoms, which means pseudo-potentials are being used on the heavier atoms. The bond angles and lengths were found to be 120 o and 1.93 Å for all B-Br bonds.
| File type | .log |
| Calculation type | FOPT |
| Calculation method | RB3LYP |
| Basis set | Gen |
| Final energy (a.u.) | -64.43644960 |
| Gradient (a.u.) | 0.00000486 |
| Dipole moment (D) | 0.00 |
| Point group | Cs |
| Calculation time (s) | 35.0 |
Item               Value     Threshold  Converged?
 Maximum Force            0.000008     0.000015     YES
 RMS     Force            0.000005     0.000010     YES
 Maximum Displacement     0.000049     0.000060     YES
 RMS     Displacement     0.000030     0.000040     YES
 Predicted change in Energy=-2.970801D-10
 Optimization completed.
    -- Stationary point found.
                           ----------------------------
                           !   Optimized Parameters   !
                           ! (Angstroms and Degrees)  !
 --------------------------                            --------------------------
 ! Name  Definition              Value          Derivative Info.                !
 --------------------------------------------------------------------------------
 ! R1    R(1,2)                  1.9339         -DE/DX =    0.0                 !
 ! R2    R(1,3)                  1.934          -DE/DX =    0.0                 !
 ! R3    R(1,4)                  1.9339         -DE/DX =    0.0                 !
 ! A1    A(2,1,3)              120.0007         -DE/DX =    0.0                 !
 ! A2    A(2,1,4)              120.0012         -DE/DX =    0.0                 !
 ! A3    A(3,1,4)              119.9981         -DE/DX =    0.0                 !
 ! D1    D(2,1,4,3)            180.0            -DE/DX =    0.0                 !
 --------------------------------------------------------------------------------
Please find the corresponding .log file here
- ↑ O. da Silva, O. Proux, J-L. Hazeman, J. James-Smith, D. Testemale and T. Yamaguchi, "X-ray Absorption Spectroscopy Study of Solvation and Ion-Pairing in aqueous Gallium Bromide Solutions at Supercritical Conditions", Journal of Molecular Liguds, 2008, 147, 83-95 DOI:10.1016/j.molliq.2008.06.022
Comparing bond lengths
Since all molecules BH3, GaBr3 and BBr3 showed an optimised bond angle of 120 o it was much more interesting to compare their optimised bond lengths as summarised in Table 5. The BH3 and BBr3 bond lengths also show good agreement with literature values [1][2]. When the ligands are compared it can be seen that the B-Br bond is 62 % longer than the B-H bond. This can be rationalised since bromine is in the third row of the periodic table and substantially heavier than hydrogen. This means bromine has a larger atomic radius with the possibility of populating p- and d-orbitals. However, bromine is more electronegative compared to hydrogen, which suggests a more polar bond with boron and would lead to a decrease in bond length due to the increased ionic character. It is obvious that the increased size of bromine is the dominating factor since a bond elongation is observed when hydrogen is replaced by bromine in BH3.
It was also possible to compare bond lengths when the central atom was changed. Gallium is bigger than boron since it is in the same period as bromine. Therefore an increase in bond length is expected and was observed as around a 22 % increase. Since bromine and gallium are in the same period they have similar atomic radii with gallium's being slightly larger due to the trend of atomic radius decreasing along a period. However, there will be better orbital overlap between the boron and bromine. This is because for gallium the available orbitals, 4p, are more diffuse compared to boron's 2p. Worse orbital overlap leads to weaker and therefore longer bonds. The bromine will also form a polar bond with gallium due to the difference in electronegativities however this is not believed to be a determining factor in the optimised bond length.
It was sometimes observed that Gaussview did not always show bonds between the atoms in these simple molecules. This is not because they were not present but because Gaussview determines the existence of bonds based on the distance between atoms only. In reality, many other factors must be considered however it is generally considered that a bond is formed when there is a net attraction between atoms. For a more conclusive approach of whether a bond has formed or not it is advantageous to look at molecular orbital theory.
| Molecule | Bond length (Å) |
|---|---|
| BH3 | 1.19 |
| GaBr3 | 2.35 |
| BBr3 | 1.93 |
Frequency calculations
A frequency calculation is considered the second derivative of a potential energy surface and it also allows vibrational modes to be understood, which can then be used to compare computational and experimental IR and Ramen spectra.
BH3 frequency calculations
This calculation was carried out using the same program as above on the optimised molecule of BH3 using the same basis set of 6-31G(d,p) and with D3h symmetry imposed on the molecule. The results can be seen below in Table 6 and below that are two lines titled Low frequencies. These frequencies refer to the 3N-6 vibrational modes present in the molecule. The first line refers to the movements of the centre of mass of the molecule, which in this case is the central boron atom and should ideally be as close to zero as possible however frequencies of +/- 15 cm-1 were accepted as being a successful calculation. The second line of Low frequencies are large and positive, another sign that the calculation worked.
| File type | .log |
| Calculation type | FREQ |
| Calculation method | RB3LYP |
| Basis set | 6-31G(d,p) |
| Final energy (a.u.) | -26.61532364 |
| Gradient (a.u.) | 0.00000215 |
| Dipole moment (D) | 0.00 |
| Point group | D3h |
| Calculation time (s) | 5.0 |
Low frequencies ---  -11.7227  -11.7148   -6.6070   -0.0004    0.0278    0.4278
 Low frequencies --- 1162.9743 1213.1388 1213.1390
Item               Value     Threshold  Converged?
 Maximum Force            0.000004     0.000450     YES
 RMS     Force            0.000002     0.000300     YES
 Maximum Displacement     0.000017     0.001800     YES
 RMS     Displacement     0.000008     0.001200     YES
 Predicted change in Energy=-1.087480D-10
 Optimization completed.
    -- Stationary point found.
Please find the corresponding .log file here
Below shows a summary of the vibrational modes of BH3 with the atom labels shown here.
| Vibrational Mode Number | Vibration Image | Vibration Frequency (cm-1) | Description | Intensity | Symmetry D3h point group |
|---|---|---|---|---|---|
| 1 |  |
1163 | All hydrogens wagging in time with the boron atom moving up as the hydrogens move down and vice versa | 93 | A2" |
| 2 |  |
1213 | Three hydrogens moving in plane of molecule and boron atom stationary, 3H and 4H rocking and 2H scissoring with respect to them | 14 | E' |
| 3 |  |
1213 | 3H and 4H scissoring in plane of molecule with boron and 2H stationary | 14 | E' |
| 4 |  |
2583 | All three hydrogens moving in plane of molecule at the same time, symmetrical stretching | 0 | A' |
| 5 |  |
2716 | Asymmetrical stretching of 3H and 4H in plane of molecule | 126 | E' |
| 6 |  |
2716 | Symmetrical stretching of 3H and 4H and asymmetrical stretching of 2H with respect to them | 126 | E' |

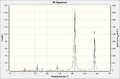
Six peaks are expected in the IR spectrum due to the number of vibrational modes predicted however only three peaks can be seen above. This is due to the overlap of vibrational modes 2 and 3 and then 5 and 6. Each of these vibrational modes have a degenerate symmetry point group (E'). Vibrational mode 4 is IR inactive due to the symmetrical stretching of all three hydrogens and so no corresponding peak is seen in the spectrum. The three peaks in the calculated IR spectrum were found to be 1163, 1213 and 2715 cm-1. These frequencies show good agreement with the literature's 1148, 1198 and 2602 cm-1[1].
- ↑ K. Kawaguchi, J. E. Butler, C. Yamada, S. H. Bauer, T. Minowa, H. Kahamon and E. Hirota, "Observation of the gas-phase infrared spectrum of BH3", Journal of Chemical Physics, 1987, 87, 2438 DOI:10.1063/1.453135
GaBr3 frequency calculations
The same method used for BH3 was applied on the optimised molecule of GaBr3. The lowest real frequency was found to be 76 cm-1.
| File type | .log |
| Calculation type | FREQ |
| Calculation method | RB3LYP |
| Basis set | LANL2DZ |
| Final energy (a.u.) | -41.70082770 |
| Gradient (a.u.) | 0.00000021 |
| Dipole moment (D) | 0.00 |
| Point group | D3h |
| Calculation time (s) | 7.0 |
Low frequencies ---   -1.4877   -0.0015   -0.0002    0.0096    0.6540    0.6540
 Low frequencies ---   76.3920   76.3924   99.6767
Item               Value     Threshold  Converged?
 Maximum Force            0.000000     0.000015     YES
 RMS     Force            0.000000     0.000010     YES
 Maximum Displacement     0.000004     0.000060     YES
 RMS     Displacement     0.000002     0.000040     YES
 Predicted change in Energy=-2.185815D-12
 Optimization completed.
    -- Stationary point found.
Please find the corresponding .log file here
Below shows a summary of the vibrational modes of GaBr3 with the atom labels shown here.
| Vibrational Mode Number | Vibration Image | Vibration Frequency (cm-1) | Description | Intensity | Symmetry D3h point group |
|---|---|---|---|---|---|
| 1 |  |
76 | 3Br and 4Br scissoring in plane of molecule with 2Br stationary, gallium has small displacement vector so moves slightly, same as vibrational mode 3 of BH3 | 3 | E' |
| 2 |  |
76 | 3Br and 4Br rocking and 2Br scissoring with respect to them, same as vibrational mode 2 of BH3 | 3 | E' |
| 3 |  |
100 | All three bromines moving together in and out of plane with gallium moving in the opposite direction, same as vibrational mode 1 of BH3 | 9 | A2" |
| 4 |  |
197 | All three bromines moving in plane of molecule at the same time, symmetrical stretching, same as vibrational mode 4 of BH3 | 0 | A1' |
| 5 |  |
316 | Symmetrical stretching of 3H and 4H and asymmetrical stretching of 2H with respect to them, same as vibrational mode 6 of BH3 | 57 | E' |
| 6 |  |
316 | Asymmetrical stretching of 3Br and 4Br in plane of molecule, same as vibrational mode 5 of BH3 | 57 | E' |

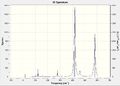
The spectrum above shows three peaks with frequencies 76, 100 and 316 cm-1. This is lower than the six vibrational modes recorded in Table 9 for similar reasons as BH3 such as degenerate vibrational modes (1 and 2 and then 5 and 6) and IR inactive symmetrical stretches. The predicted frequencies show good agreement with the literature's 89, 100 and 355 cm-1 [1]
- ↑ N. N. Greenwood, "Spectroscopic Properties of Inorganic and Organometallic Compounds; Volume 9", RSC, 1976, 198
Comparing the frequencies of BH3 and GaBr3
| Vibrational Mode | BH3 frequency (cm-1) | GaBr3 frequency (cm-1) |
|---|---|---|
| 1 | 1163 | 76 |
| 2 | 1213 | 76 |
| 3 | 1213 | 100 |
| 4 | 2583 | 197 |
| 5 | 2716 | 316 |
| 6 | 2716 | 316 |
It can be seen that BH3 has much larger frequency values compared GaBr3. This is due to both gallium and bromine being heavier atoms than boron and hydrogen. The frequency value is inversely proportional to the reduced mass of a molecule in the Harmonic Oscillator equation (). Therefore the heavier the molecule the smaller the stretching frequency. Also as previously discovered in the previous section the B-H bond is stronger compared to the Ga-Br bond, which will also lead to an increase in the frequency values. There has also been a change in the order for the lower energy frequencies of both molecules. The E' degenerate modes for BH3 correspond to the vibrational modes 2 and 3 however in GaBr3 these are found at vibrational modes 1 and 2.
The spectra of both molecules share the same shape with only three peaks observed. BH3 GaBr3 are both trigonal planar molecules with D3h point group symmetry therefore the same vibrational modes are expected. As previously explained only three peaks are observed for each molecule for the same reasons; degeneracy and symmetrical stretching. However the spectra do not show any similarities in intensities. The shape of each spectrum shows one peak at high energy and two peaks at lower energies. When the animations were viewed on Gaussview 5.0 it could be seen that the higher energy A1' and E' vibrational modes corresponded to stretching frequencies whereas the lower energy vibrational modes were bending modes. It is obvious that more energy is required to cause a stretching mode since this refers to a change in bond length rather than a change in bond angle as for bending modes.
BH3 MO diagram
The optimised molecule output (checkpoint file) was used to analyse the molecular orbitals (MOs) of BH3 using Gaussview and with the additional key words "pop=full". By placing the calculated MOs on top of the MO diagram below it can be seen that the calculated orbitals match up mostly with the predicted orbitals from LCAO (linear combination of atomic orbitals) theory. However for the more complex MOs it is better to use the computed orbitals to better understand their nature and shape. LCAO is unfortunately only a qualitative approach and so should be used in tandem with computational techniques to fully grasp the electronic structure and nature of a molecule.
| File type | .chk |
| Calculation type | SP |
| Calculation method | RB3LYP |
| Basis set | 6-31G(d,p) |
| Final energy (a.u.) | -26.61532364 |
| Gradient (a.u.) | 0.0000000 |
| Dipole moment (D) | 0.00 |
| Point group | D3h |
| Calculation time (s) | 5.0 |
Please find the corresponding .log file here

NH3 NBO analysis
A molecule of NH3 was optimised then frequency and population analyses were run in the same manner as for BH3 and GaBr3 however the additional key words "nosymm" were also included. The results below show that all calculations were successful.
| File type | .log |
| Calculation type | FOPT |
| Calculation method | RB3LYP |
| Basis set | 6-31G(d,p) |
| Final energy (a.u.) | -56.55776872 |
| Gradient (a.u.) | 0.00000314 |
| Dipole moment (D) | 1.85 |
| Point group | Cs |
| Calculation time (s) | 3.0 |
Item               Value     Threshold  Converged?
 Maximum Force            0.000006     0.000030     YES
 RMS     Force            0.000004     0.000020     YES
 Maximum Displacement     0.000016     0.000120     YES
 RMS     Displacement     0.000011     0.000080     YES
 Predicted change in Energy=-1.165946D-10
 Optimization completed.
    -- Stationary point found.
                           ----------------------------
                           !   Optimized Parameters   !
                           ! (Angstroms and Degrees)  !
 --------------------------                            --------------------------
 ! Name  Definition              Value          Derivative Info.                !
 --------------------------------------------------------------------------------
 ! R1    R(1,2)                  1.018          -DE/DX =    0.0                 !
 ! R2    R(1,3)                  1.018          -DE/DX =    0.0                 !
 ! R3    R(1,4)                  1.018          -DE/DX =    0.0                 !
 ! A1    A(2,1,3)              105.7446         -DE/DX =    0.0                 !
 ! A2    A(2,1,4)              105.7446         -DE/DX =    0.0                 !
 ! A3    A(3,1,4)              105.7445         -DE/DX =    0.0                 !
 ! D1    D(2,1,4,3)           -111.8637         -DE/DX =    0.0                 !
 --------------------------------------------------------------------------------
Please find the corresponding .log file here
| File type | .log |
| Calculation type | FREQ |
| Calculation method | RB3LYP |
| Basis set | 6-31G(d,p) |
| Final energy (a.u.) | -56.55776872 |
| Gradient (a.u.) | 0.00000314 |
| Dipole moment (D) | 1.85 |
| Point group | C3 |
| Calculation time (s) | 11.0 |
Low frequencies ---    0.0013    0.0019    0.0023    3.2004    6.2581    7.7429
 Low frequencies --- 1089.3668 1693.9325 1693.9356
Item               Value     Threshold  Converged?
 Maximum Force            0.000005     0.000450     YES
 RMS     Force            0.000003     0.000300     YES
 Maximum Displacement     0.000013     0.001800     YES
 RMS     Displacement     0.000007     0.001200     YES
 Predicted change in Energy=-1.074677D-10
 Optimization completed.
    -- Stationary point found.
Please find the corresponding .log file here
| File type | .chk |
| Calculation type | SP |
| Calculation method | RB3LYP |
| Basis set | 6-31G(d,p) |
| Final energy (a.u.) | -56.55776874 |
| Gradient (a.u.) | 0.00000000 |
| Dipole moment (D) | 1.85 |
| Point group | Cs |
| Calculation time (s) | 5.0 |
Please find the corresponding .log file here
The NBO (natural bond orbital) charge distribution was then found using the .log output file of the population analysis. The output can be seen on the left with a charge range of -1.000 and +1.000. However it was more informative to use actual numbers, seen on the right. Now it can be seen that the sum of each individual NBO charge distribution is zero, confirming the neutrality of NH3. Nitrogen has a large and negative charge distribution, which is seen in red in the first picture, and is expected.
-
 NBO charge distribution of NH3
 -
 Specific NBO charge distribution of NH3


NH3BH3 Association Energies
A molecule of NH3BH3 was optimised and underwent a frequency analysis. The results can be seen below.
| File type | .log |
| Calculation type | FOPT |
| Calculation method | RB3LYP |
| Basis set | 6-31G(d,p) |
| Final energy (a.u.) | -83.22468908 |
| Gradient (a.u.) | 0.00000138 |
| Dipole moment (D) | 5.56 |
| Point group | C1 |
| Calculation time (s) | 57.0 |
Item               Value     Threshold  Converged?
 Maximum Force            0.000002     0.000015     YES
 RMS     Force            0.000001     0.000010     YES
 Maximum Displacement     0.000034     0.000060     YES
 RMS     Displacement     0.000010     0.000040     YES
 Predicted change in Energy=-1.180662D-10
 Optimization completed.
    -- Stationary point found.----------------------------
                           !   Optimized Parameters   !
                           ! (Angstroms and Degrees)  !
 --------------------------                            --------------------------
 ! Name  Definition              Value          Derivative Info.                !
 --------------------------------------------------------------------------------
 ! R1    R(1,7)                  1.0185         -DE/DX =    0.0                 !
 ! R2    R(2,7)                  1.0185         -DE/DX =    0.0                 !
 ! R3    R(3,7)                  1.0185         -DE/DX =    0.0                 !
 ! R4    R(4,8)                  1.2098         -DE/DX =    0.0                 !
 ! R5    R(5,8)                  1.2098         -DE/DX =    0.0                 !
 ! R6    R(6,8)                  1.2098         -DE/DX =    0.0                 !
 ! R7    R(7,8)                  1.6677         -DE/DX =    0.0                 !
 ! A1    A(1,7,2)              107.8749         -DE/DX =    0.0                 !
 ! A2    A(1,7,3)              107.8748         -DE/DX =    0.0                 !
 ! A3    A(1,7,8)              111.024          -DE/DX =    0.0                 !
 ! A4    A(2,7,3)              107.8749         -DE/DX =    0.0                 !
 ! A5    A(2,7,8)              111.0238         -DE/DX =    0.0                 !
 ! A6    A(3,7,8)              111.0241         -DE/DX =    0.0                 !
 ! A7    A(4,8,5)              113.874          -DE/DX =    0.0                 !
 ! A8    A(4,8,6)              113.8741         -DE/DX =    0.0                 !
 ! A9    A(4,8,7)              104.5971         -DE/DX =    0.0                 !
 ! A10   A(5,8,6)              113.8742         -DE/DX =    0.0                 !
 ! A11   A(5,8,7)              104.5971         -DE/DX =    0.0                 !
 ! A12   A(6,8,7)              104.5972         -DE/DX =    0.0                 !
 ! D1    D(1,7,8,4)           -179.9998         -DE/DX =    0.0                 !
 ! D2    D(1,7,8,5)            -59.9999         -DE/DX =    0.0                 !
 ! D3    D(1,7,8,6)             60.0002         -DE/DX =    0.0                 !
 ! D4    D(2,7,8,4)            -59.9998         -DE/DX =    0.0                 !
 ! D5    D(2,7,8,5)             60.0            -DE/DX =    0.0                 !
 ! D6    D(2,7,8,6)           -179.9998         -DE/DX =    0.0                 !
 ! D7    D(3,7,8,4)             60.0002         -DE/DX =    0.0                 !
 ! D8    D(3,7,8,5)           -179.9999         -DE/DX =    0.0                 !
 ! D9    D(3,7,8,6)            -59.9998         -DE/DX =    0.0                 !
 --------------------------------------------------------------------------------
Please find the corresponding .log file here
| File type | .log |
| Calculation type | FREQ |
| Calculation method | RB3LYP |
| Basis set | 6-31G(d,p) |
| Final energy (a.u.) | -83.22468909 |
| Gradient (a.u.) | 0.00000144 |
| Dipole moment (D) | 5.56 |
| Point group | C1 |
| Calculation time (s) | 30.0 |
Item               Value     Threshold  Converged?
 Maximum Force            0.000005     0.000450     YES
 RMS     Force            0.000001     0.000300     YES
 Maximum Displacement     0.000029     0.001800     YES
 RMS     Displacement     0.000011     0.001200     YES
 Predicted change in Energy=-1.303340D-10
 Optimization completed.
    -- Stationary point found.
Low frequencies ---   -2.1878   -0.0005   -0.0005    0.0004    2.3950    3.3005
 Low frequencies ---  263.4754  632.9559  638.4487
Please find the corresponding .log file here
The energies of BH3, NH3 and BH3NH3 were found to be -26.61532358, -56.55776872 and -83.22468909 a.u. respectively. By putting these numbers into this equation the energy difference or association energy of ammonium borane was found to be -0.05159679 a.u. A conversion factor of 2625.50[1] was then used to convert this into kJmol-1 and was found to equal -135.4673721. However due to accuracy restrictions this can only be recorded as -135 kJmol-1. On the other hand, the bond dissociation is +135 kJmol-1, which shows some agreement with the literature as it has the same order of magnitude[2].
- ↑ See http://web.utk.edu/~rcompton/constants
- ↑ H. B. Gray, "Chemical Bonds: an introduction to atomic and molecular structure", University Science Books, 1994, 2nd edition, 115
Part 2: Main Group Halides
The aim of this section was to analyse the conformers and vibrations of a particular main group halide, Al2Cl4Br2.
Optimisation of Four isomers of Al2Cl4Br2
Four isomers of Al2Cl4Br2 were optimised on Gaussview 5.0 using the 6-31G(d,p) basis set on the aluminium and chlorine atoms but a pseudo-potential (LANL2DZ) on the heavier bromine atoms. The results can be seen below, in Table 1 and the following Item tables show that each calculation was successful.
Isomer 1 optimisation
Item               Value     Threshold  Converged?
 Maximum Force            0.000023     0.000450     YES
 RMS     Force            0.000012     0.000300     YES
 Maximum Displacement     0.000641     0.001800     YES
 RMS     Displacement     0.000320     0.001200     YES
 Predicted change in Energy=-2.571159D-08
 Optimization completed.
    -- Stationary point found.
Please find the corresponding .log file here
Isomer 2 optimisation
Item               Value     Threshold  Converged?
 Maximum Force            0.000105     0.000450     YES
 RMS     Force            0.000026     0.000300     YES
 Maximum Displacement     0.001366     0.001800     YES
 RMS     Displacement     0.000597     0.001200     YES
 Predicted change in Energy=-1.133618D-07
 Optimization completed.
    -- Stationary point found.
Please find the corresponding .log file here
Isomer 3 optimisation
Item               Value     Threshold  Converged?
 Maximum Force            0.000003     0.000450     YES
 RMS     Force            0.000001     0.000300     YES
 Maximum Displacement     0.000040     0.001800     YES
 RMS     Displacement     0.000015     0.001200     YES
 Predicted change in Energy=-2.937156D-10
 Optimization completed.
    -- Stationary point found.
Please find the corresponding .log file here
Isomer 4 optimisation
Item               Value     Threshold  Converged?
 Maximum Force            0.000005     0.000450     YES
 RMS     Force            0.000003     0.000300     YES
 Maximum Displacement     0.000054     0.001800     YES
 RMS     Displacement     0.000024     0.001200     YES
 Predicted change in Energy=-6.158890D-10
 Optimization completed.
    -- Stationary point found.
Please find the corresponding .log file here
| Isomer 1 | Isomer 2 | Isomer 3 | Isomer 4 | |
|---|---|---|---|---|
 |
 |
 |

| |
| File type | .log | .log | .log | .log |
| Calculation type | FOPT | FOPT | FOPT | FOPT |
| Calculation method | RB3LYP | RB3LYP | RB3LYP | RB3LYP |
| Basis set | 6-31G(d,p) | 6-31G(d,p) | 6-31G(d,p) | 6-31G(d,p) |
| Final energy (a.u.) | -2352.41626573 | -2352.41109930 | -2352.40630798 | -2352.41629861 |
| Gradient (a.u.) | 0.00001266 | 0.00003313 | 0.00000187 | 0.00000404 |
| Dipole moment (D) | 0.19 | 0.14 | 0.00 | 0.00 |
| Point group | C1 | C1 | C1 | C1 |
| Expected point group | C2v | C1 | D2h | C2h |
| Calculation time (s) | 187 | 298 | 179 | 186 |
Table 2 shows the overall energies of each isomer in atomic units and were converted into kJmol-1 using the same conversion factor as in Part 1. Unfortunately, due to the limits of accuracy provided by the program, energies recorded in kJmol-1 can only be commented on to the closest 10 kJmol-1. Therefore, it can be conclusively said that Isomers 2 and 3 are higher in energy compared to Isomers 1 and 4 but one cannot know which Isomer has the absolute lowest energy. However, upon examining the isomers it is probable that Isomer 4 is the lowest energy conformer. This is most likely due to the location of the bromine atoms, since they are the atoms in the molecule with the largest atomic radii, therefore in a trans conformation, as in Isomer 4, there is the least amount of steric hindrance and will lead to the lowest energy conformer. This is in agreement with the energies calculated in a.u.. Also, the dipole moment is minimised on Isomer 4 compared to Isomer 1.
The highest energy isomer has both bromine atoms in a bridging position and using the same argument above this is to be expected due to the large atomic radii of the bromine atoms. Additionally, the Al-Cl bonds will be stronger compared to the Al-Br bonds, due to better overlap since aluminium and chlorine are in the same period. This will be important since this molecule was imagined to be made upon dimerisation of AlCl2Br and if two chlorines are in the bridging positions then there will be a stronger interaction between the monomers.
| Isomer | 1 | 2 | 3 | 4 |
|---|---|---|---|---|
| Energy (a.u.) | -2352.41626573 | -2352.41109930 | -2352.40630798 | -2352.41629861 |
| Energy (kJmol-1) | -6176268.906 | -6176255.341 | -6176242.762 | -6176268.992 |
| Relative energy compared to Isomer 4 (kJmol-1) | 0.08632644 | 13.65078841 | 26.23039907 | 0.00000000 |
Al2Cl4Br2 dissociation energies
As previously mentioned it was envisaged that Al2Cl4Br2 was made from two molecules of AlCl2Br. An optimisation calculation of the monomer was conducted along with a frequency analysis to confirm that a minimum was reached. The same basis sets and key words were used as for Al2Cl4Br2, in order to make useful comparisons. The results can be seen below:
Optimisation of AlCl4Br:
Item               Value     Threshold  Converged?
 Maximum Force            0.000136     0.000450     YES
 RMS     Force            0.000073     0.000300     YES
 Maximum Displacement     0.000760     0.001800     YES
 RMS     Displacement     0.000497     0.001200     YES
 Predicted change in Energy=-7.984437D-08
 Optimization completed.
    -- Stationary point found.
| File type | .log |
| Calculation type | FOPT |
| Calculation method | RB3LYP |
| Basis set | Gen |
| Final energy (a.u.) | -1176.19013679 |
| Gradient (a.u.) | 0.00004196 |
| Dipole moment (D) | 0.11 |
| Point group | C2v |
| Calculation time (s) | 16.0 |
Please find the corresponding .log file here
Frequency of AlCl4Br:
Item               Value     Threshold  Converged?
 Maximum Force            0.000081     0.000450     YES
 RMS     Force            0.000042     0.000300     YES
 Maximum Displacement     0.001588     0.001800     YES
 RMS     Displacement     0.000974     0.001200     YES
 Predicted change in Energy=-1.810813D-07
 Optimization completed.
    -- Stationary point found.
Low frequencies ---   -0.0015    0.0022    0.0027    1.3569    3.6367    4.2604
 Low frequencies ---  120.5042  133.9178  185.8950
| File type | .log |
| Calculation type | FREQ |
| Calculation method | RB3LYP |
| Basis set | Gen |
| Final energy (a.u.) | -1176.19013679 |
| Gradient (a.u.) | 0.00004194 |
| Dipole moment (D) | 0.11 |
| Point group | C2v |
| Calculation time (s) | 9.0 |
Please find the corresponding .log file here
The overall energies of the lowest energy dimer (Isomer 4) and two monomers were then used to find . This was found to equal -94.58 kJmol-1 or -90 kJmol-1 to the nearest 10 kJmol-1. In other words the dissociation of energy of Isomer 4 into its monomers is +90 kJmol-1 and therefore the product of Al2Cl4Br2 is more stable than the isolated monomers, AlCl2Br. This is expected when considering that AlCl2Br is electron deficient in a similar way that AlCl3 is and can gain electron density through forming dative bonds with another molecule of itself to form the more stable dimer.
Frequency analysis of four isomers of Al2Cl4Br2
The optimised structures of the four isomers of Al2Cl4Br2 underwent a frequency analysis using the same basis set and pseudo-potentials as used in the optimisation calculations. However, the key words "opt(maxcycle=50) were removed since the molecules had already been optimised. The results of the frequency calculations can be seen below. As in Part 1 the calculation can be deemed successful if the zero-frequencies are within +/- 15 cm-1.
Isomer 1:
Low frequencies ---   -4.2536   -2.3935   -0.0023    0.0018    0.0022    1.2830
 Low frequencies ---   17.1620   50.9093   78.5490
| File type | .log |
| Calculation type | FREQ |
| Calculation method | RB3LYP |
| Basis set | Gen |
| Final energy (a.u.) | -2352.41626680 |
| Gradient (a.u.) | 0.00000697 |
| Dipole moment (D) | 0.17 |
| Point group | C1 |
| Calculation time (s) | 50.0 |
Please find the corresponding .log file here
Isomer 2:
Low frequencies ---   -2.9939   -1.4805    0.0006    0.0017    0.0026    3.0872
 Low frequencies ---   17.0191   55.9578   80.0486
| File type | .log |
| Calculation type | FREQ |
| Calculation method | RB3LYP |
| Basis set | Gen |
| Final energy (a.u.) | -2352.41109930 |
| Gradient (a.u.) | 0.00003312 |
| Dipole moment (D) | 0.14 |
| Point group | C1 |
| Calculation time (s) | 55.0 |
Please find the corresponding .log file here
Isomer 3:
Low frequencies ---   -5.1748   -5.0356   -3.1468    0.0012    0.0016    0.0028
 Low frequencies ---   14.8260   63.2702   86.0770
| File type | .log |
| Calculation type | FREQ |
| Calculation method | RB3LYP |
| Basis set | Gen |
| Final energy (a.u.) | -2352.40630798 |
| Gradient (a.u.) | 0.00000187 |
| Dipole moment (D) | 0.00 |
| Point group | C1 |
| Calculation time (s) | 54.0 |
Please find the corresponding .log file here
Isomer 4:
Low frequencies ---   -5.1490    0.0033    0.0038    0.0039    1.4146    2.0504
 Low frequencies ---   18.1472   49.1065   73.0086
| File type | .log |
| Calculation type | FREQ |
| Calculation method | RB3LYP |
| Basis set | Gen |
| Final energy (a.u.) | -2352.41629861 |
| Gradient (a.u.) | 0.00000408 |
| Dipole moment (D) | 0.00 |
| Point group | C1 |
| Calculation time (s) | 57.0 |
Please find the corresponding .log file here
The corresponding IR spectra can be seen below and can be clicked to enlarge each image or look to Table 9 for a summary of all important frequencies, where frequencies were recorded to the nearest cm-1 and the numbers in brackets refer to the intensity of the peaks.
-
 Isomer 1
 -
 Isomer 2
 -
 Isomer 3
 -
 Isomer 4


| Molecule | Isomer 1 | Isomer 2 | Isomer 3 | Isomer 4 |
|---|---|---|---|---|
| 103 (3) | 92 (1) | 108 (5) | 117 (9) | |
| 121 (13) | 110 (5) | 126 (8) | 120 (13) | |
| 123 (6) | 121 (8) | 138 (7) | 160 (6) | |
| 158 (5) | 149 (5) | 241 (100) | 280 (29) | |
| 194 (2) | 154 (6) | 341 (161) | 413 (149) | |
| 279 (25) | 186 (1) | 467 (347) | 421 (439) | |
| 309 (2) | 211 (21) | 616 (332) | 579 (316) | |
| 413 (149) | 257 (10) | |||
| 420 (411) | 289 (48) | |||
| 461 (35) | 384 (154) | |||
| 582 (278) | 424 (274) | |||
| 493 (106) | ||||
| 574 (122) | ||||
| 615 (197) |
Only peaks with an intensity value over 1 were recorded in Table 9 in order to compare the number of peaks in each of the IR spectra. It can be seen that Isomers 3 and 4 produced spectra with fewer bands, which suggests a higher level of symmetry in these isomers. This is expected to be the case since these particular isomers have high symmetry point groups, D2h and C2h respectively. Symmetrical stretching vibrations are not visible in IR spectra and are often called IR-inactive. More symmetrical molecules would be expected to produce more symmetrical stretching vibrations. In agreement with this argument, Isomer 2 produced the most number of peaks in its IR spectrum and has the lowest symmetry point group. On comparing the actual shapes of the IR spectra it was found that Isomers 1 and 4 produced very similar spectra. This is also expected from the previous analysis since both bromines are in terminal positions and they have related symmetry point groups, differing only in the direction of the reflection plane present.
Each molecule should give 18 vibrational modes, given by the equation . This was found to be true when viewing the vibrations summary in Gaussview rather than the spectrum only. Many of these vibrational modes are not present in the spectra since they are symmetrical stretches. An advantage of computational techniques is that vibrational modes not found experimentally can be defined. For example, many peaks in the spectrum of Isomer 3 are not visible since all terminal atoms are the same and therefore many of the vibrational modes caused by rocking, twisting or wagging of the terminal chlorines (vibrational modes one to three, five to six and eight) are IR inactive. When comparing some of these vibrational modes with the other isomers it was found that, for example, vibrational mode 4 of Isomer 3 is in fact vibrational mode 3 in the other three isomers. This particular vibrational mode refers to the terminal atoms scissoring in unison with respect to the bridging chlorines and aluminium atoms. This means that even though each isomer has the same number of vibrational modes, they do not always correspond to the same motion for each isomer, which can be rationalised as a reordering of vibrational frequencies. This means a particular vibrational mode has changed frequency due to a change in atom position. For the example described above, the same motion in Isomer 3 is nearly double the frequencies compared to the other isomers. This may be due to stronger bonds being formed between aluminium and chlorine compared to aluminium and bromine and the fact Isomer 3 has all chlorines in terminal positions.
Al-Br vibrational frequencies
It was interesting to analyse specific Al-Br stretches considering the varying positions of the bromine atoms in the isomers, as in terminal versus bridging positions and cis versus trans conformations. To begin with the relevant vibrational modes for each isomer was identified in order to make applicable comparisons between the isomers.
| Isomer 2 | Isomer 3 | ||||||
|---|---|---|---|---|---|---|---|
| Vibrational Mode Number | Image | Frequency (cm-1) | Intensity | Vibrational Mode Number | Image | Frequency (cm-1) | Intensity |
| 11 |  |
211 | 21 | 11 |  |
197 | 0 |
| 12 |  |
257 | 10 | 12 |  |
441 | 98 |
| 13 |  |
289 | 48 | 13 |  |
247 | 0 |
| 14 |  |
384 | 154 | 14 |  |
341 | 161 |
Table 10 shows the interesting vibrational modes when bromine was in a bridging position. Some of the vibrational modes are the same in both Isomers 2 and 3, for example vibrational mode 11. For some of the vibrational modes there has been a reordering, as in the same vibrational mode is present for both isomers but has a different vibrational mode number. For example, vibrational mode 12 for Isomer 2 is the same motion as vibrational mode 13 for Isomer 3. However, for Isomer 3 this mode is IR-inactive and can not be seen in the spectrum above. This shows that computational methods can be used to calculate the frequencies of the same vibrational motions in two different isomers, even when one would not be visible experimentally. In fact, this particular motion has a very similar frequency value for both isomers although reordering has occurred.
| Isomer 1 | Isomer 2 | Isomer 4 | |||||||||
|---|---|---|---|---|---|---|---|---|---|---|---|
| Vibrational Mode Number | Image | Frequency (cm-1) | Intensity | Vibrational Mode Number | Image | Frequency (cm-1) | Intensity | Vibrational Mode Number | Image | Frequency (cm-1) | Intensity |
| 15 |  |
419 | 411 | 15 |  |
424 | 274 | 15 |  |
421 | 439 |
| 16 |  |
461 | 35 | 16 |  |
493 | 106 | 16 |  |
459 | 0 |
| 17 |  |
570 | 32 | 17 |  |
574 | 122 | 17 |  |
574 | 0 |
| 18 |  |
582 | 278 | 18 |  |
615 | 197 | 18 |  |
579 | 316 |
Table 11 shows the interesting vibrations when bromine was in a terminal position. It was found that Isomers 1 and 4 had the same vibrational modes for each vibrational mode 14-18. Although the motions were the same, due to the cis versus trans positions of the terminal bromine atoms, the symmetry of the resulting stretches varied. For example, for vibrational mode 17 causes anti-symmetrical stretching of Al-Br bonds in Isomer 1 but symmetrical stretching for Isomer 4. No peak can be seen for Isomer 4 for this particular vibrational mode since it is symmetrical across the whole molecule and is therefore IR-inactive. The largest Al-Br stretch was definitely seen in vibrational mode 17 in Isomer 2, due to the aluminium atoms having very different vectors.
MO analysis of Isomer 4
The lowest energy isomer, Isomer 4, underwent a population analysis, with "pop=full" additional keywords, so that all of the occupied non-core molecular orbitals could be visualised. There was a large energy gap between the core and non-core orbitals present in this molecule and it was only considered interesting to visualise a handful of occupied non-core molecular orbitals with varying degrees of bonding. The chosen orbitals were numbers 31, 37, 39, 47 and 54 and the results can be seen below. One molecular orbital of Isomer 1 was also visualised in order to compare the effects of having the bromine atoms in trans versus cis positions. For each of the chosen molecular orbitals the interactions were described and evaluated.
Item               Value     Threshold  Converged?
 Maximum Force            0.000005     0.000450     YES
 RMS     Force            0.000003     0.000300     YES
 Maximum Displacement     0.000054     0.001800     YES
 RMS     Displacement     0.000024     0.001200     YES
 Predicted change in Energy=-6.158890D-10
 Optimization completed.
    -- Stationary point found.
| File type | .log |
| Calculation type | FOPT |
| Calculation method | RB3LYP |
| Basis set | Gen |
| Final energy (a.u.) | -2352.41629861 |
| Gradient (a.u.) | 0.00000404 |
| Dipole moment (D) | 0.0 |
| Point group | C1 |
| Calculation time (s) | 246 |
Please find the corresponding .log file here
For Isomer 1 comparison
Item               Value     Threshold  Converged?
 Maximum Force            0.000011     0.000450     YES
 RMS     Force            0.000006     0.000300     YES
 Maximum Displacement     0.001031     0.001800     YES
 RMS     Displacement     0.000407     0.001200     YES
 Predicted change in Energy=-5.099013D-09
 Optimization completed.
    -- Stationary point found.
| File type | .log |
| Calculation type | FOPT |
| Calculation method | RB3LYP |
| Basis set | Gen |
| Final energy (a.u.) | -2352.41626680 |
| Gradient (a.u.) | 0.00000697 |
| Dipole moment (D) | 0.17 |
| Point group | C1 |
| Calculation time (s) | 32.0 |
Please find the corresponding .log file here


