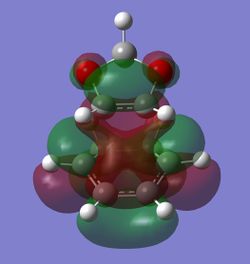
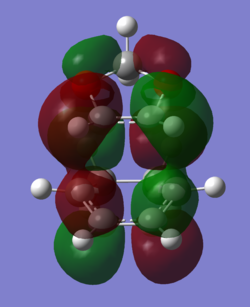
Rep:TS:mn915
Introduction
The aim of this computational chemistry experiment is to spot the transition state of a reaction and optimise it using different recommended methods discussed later. The transition state of a reaction in a 2D reaction coordinate is the maxima, whereas in more than two dimensional graphs, locating the TS is a bit more challenging. In this experiment, the potential energy surface (PES) has been studied and the relevant calculations have been done to find the minima and the TS of a series of pericyclic reactions. In theory, PES diagram of a reaction has 3N-6 dimensions corresponding to the degrees of freedom, and therefore the minima are where the first derivative is zero and the second derivative is positive. The minima correspond to either the products or the reactants as they are indicative of lowest possible energies on PES. Locating the TS, however, needs more efforts since it sits on the saddle point of a graph. The first derivative a saddle point is zero, but the second derivative of it has two signs depending on the travelling direction. The decreasing direction has a negative sign, and travelling in any other directions leads to an increase in PES. The second derivative is also an indicative of energy which then can be used to calculate the force constants and the relevant vibrations of a particular point. Therefore, as we are studying the reaction pathway (not anything else), the decreasing direction of PES from the TS (saddle point) is in focus related to a negative force constant and negative vibration. Also, for each TS, there is only one possible negative vibration due to the uniqueness of the decreasing path to the reactants/ productsom
Nf710 (talk) 21:39, 10 January 2018 (UTC) This is abit unclear. you could have summarized it saying the minimum have postive force constants in all degrees of freedom, but the TS is a first order saddle point with all degrees of freedom positive apart from one which is the reaction coordinate. A diagram would have been better to explain thhis as there is lots of text.
In general, there are three methods used to spot the transition state. The first method starts with the optimisation of a guess TS and is very case dependent and unreliable. The second method also works with a guessed structure of the TS, but as the bonds at reacting termini are kept frozen, it allows the rest of the structure to be optimised. The forming bonds are then activated and the finalised optimised TS can be obtained. The last and the most precise method uses the optimised structure of either products or reactants to start with and alters the bond lengths to reach the TS structure followed by the similar steps taken in the second method. This method is expensive to use and might not be responsive if the TS is far away from the starting structures.
In this experiment, PM6 and B3LYP optimisation methods were used. PM6 method uses a simplified Hartree Fock with the calculated exchange integrals and requests a semi-empirical calculation using its relevant Hamiltonian. B3LYP method, however, uses a more precise calculation set. In B3LYP method, 3 parameters are mixed in the HF exchange correlation and the rest of the calculations are done using DFT method. DFT calculates the dynamic electron correlation, so the HF method is used as a complement to cover the quantum mechanical estimations. For more precise studies, more parametised methods can be used as they contain less approximations and pre-calculated integrals.
Nf710 (talk) 21:39, 10 January 2018 (UTC) PM6 is a paramterised Hamiltonian (replacing the integrals with constants depending on the atoms present). Good understanding of B3LYP this is basically correct as a summary. Some equations showing what hamiltonians would have been nice.
Exercise 1: Reaction of Butadiene with Ethylene
(Fv611 (talk) Excellent work throughout the whole exercise. Well done!)
MO Analysis
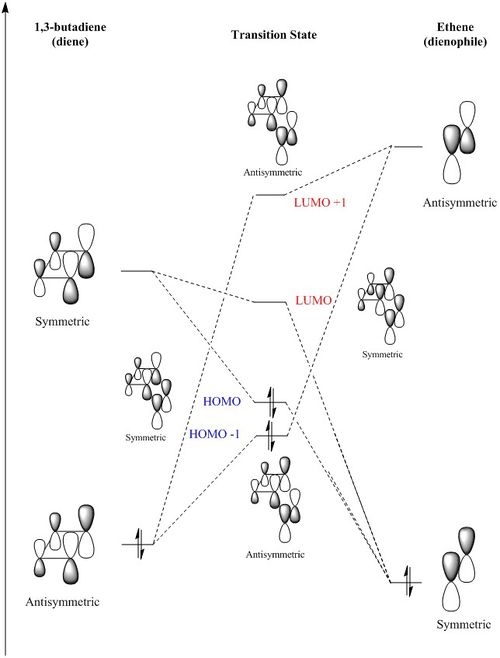
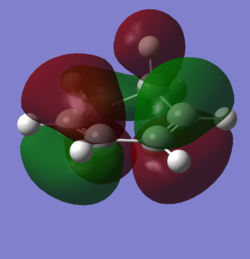
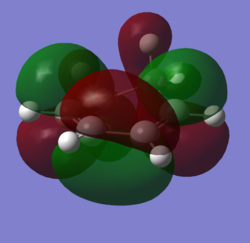
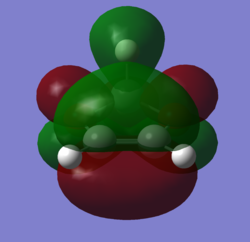
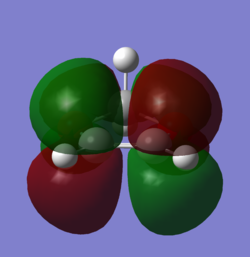
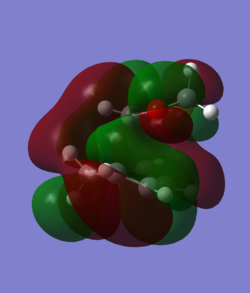
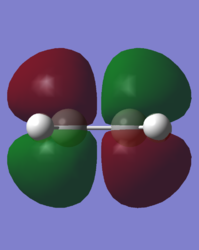
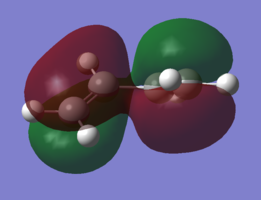
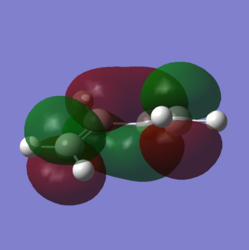
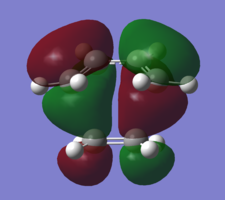
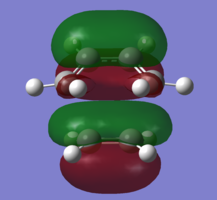
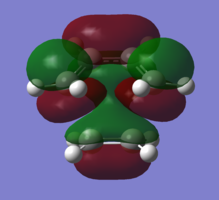
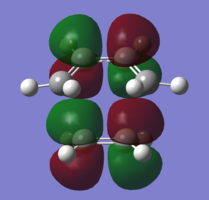
In order to understand the molecular orbitals of the transition state, the MO diagram of the TS should be constructed so the relevant MO interactions can be more easily studied. In the MO diagram of the transition state, shown on the right, the HOMO and LUMO of both ethene (dienophile) and butadiene (diene) are involved. From the Table 1 below, it can be concluded that the HOMO of butadiene interacts with the LUMO of ethene to yield the HOMO -1 of the TS, and the HOMO of the TS is obtained through the interaction of ethene's HOMO and butadiene's LUMO. Also, the same pairs of MOs have an out of phase interactions to give LUMO and LUMO +1 of the TS.
Looking at the MO diagram and the MO images of the TS and the reactants shows that the interaction between the HOMO of butadiene and the LUMO of ethene leads to antisymmetric molecular orbitals, whereas the interaction between the LUMO of butadiene with the HOMO of ethene gives symmetric orbitals relative to the plane of symmetry. Moreover, in the MOs of the TS, no interaction between the mentioned opposite pairs of reactants' MOs was observed. Therefore, it can be deduced that the interaction only occurs when the MOs have the same symmetry or in other words, the interaction between the MOs of the same symmetry is allowed, and the interaction between the orbitals of opposite symmetry is not allowed. With the same reasoning, we can say that if the spatial overlap of two orbitals is effective, they can interacts and yield a pair of MOs, so the overlap integral of the mixing of two same symmetry orbitals (or MOs) is one and of two opposite symmetry orbitals is zero. It is also crucial to note that the same symmetry orbitals interacts to form a pair of MOs with a similar symmetry, Table 1.
In the MO diagram of the TS, the HOMO -1 is largely made out of the HOMO of butadiene and the LUMO of the TS has a larger contribution from the LUMO of butadiene. However, the relative energies observed in this MO diagram is a bit different from what we usually expect in terms of the stabilisation energies. The reason for this difference is the energy of the transition state being higher than the energies of the reactants, thus the resulting MOs are not stablised in opposite to the resulting MOs of the products.
The relative energies of the MOs, show in the diagram, have been taken from the Gaussian.
 |
 |
 |
 |
 |
 |
 |
 |
C-C bond lengths
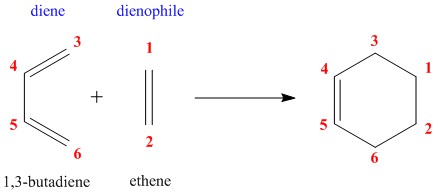
Generally, cycloaddition reactions contain the breakage and formation of the bonds. In this [4+2] cycloaddition, three bonds are formed and three bonds are broken, and comparing the C-C distances allows us to inspect the mechanism more precisely. As the reaction progresses, the ethene C=C is weakened and two single bond between C1-C3 and C2-C6 begin to form. Also, the bond order between C4 and C5 is increased during the course of the reaction resulting in shortening the C-C distance as it can be concluded from the values listed below. In the C-C distances of the transition state, two values are larger than others corresponding to the mentioned C1-C3 and C2-C6 single bond being formed. These two values, which are identical due to the symmetry of the TS, lie between the doubled Van der Waals radius of carbon atom (1.7 Å)[1] and the C-C single bond length of 1.54 Å[2]. However, once the bonds are formed, their lengths changes to the exact C-C single bond lengths. Moreover, the C=C length of ethene resembles to the length of the newly formed double bond between between C4 and C5 but with a small variation due to the neighbouring effects of the alkyl groups. The single bonds adjacent to the double bond of the cyclohexene are also observed to be shorter than normal single bonds because of the presence of an electron rich π cloud.
| Species | C1-C2 | C1-C3 | C3-C4 | C4-C5 | C5-C6 | C6-C2 |
|---|---|---|---|---|---|---|
| Ethene | 1.327 | -- | -- | -- | -- | -- |
| Butadiene | -- | -- | 1.335 | 1.468 | 1.335 | -- |
| Transition State | 1.382 | 2.115 | 1.380 | 1.411 | 1.380 | 2.115 |
| Cyclohexene | 1.541 | 1.540 | 1.501 | 1.338 | 1.501 | 1.540 |
Vibration of Transition State
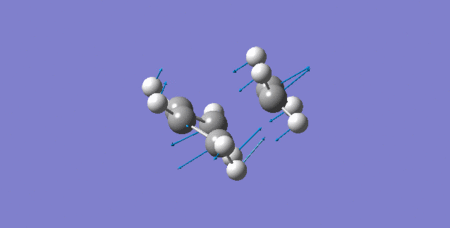
As it can be seen below in the animated vibration of the TS corresponding to its negative frequency, the formation of two bonds between terminal carbons are synchronous (at the same time).
Files
log file of PM6 optimised product
Exercise 2: Reaction of Cyclohexadiene and 1,3-Dioxole

MO Analysis
(Fv611 (talk) Again, a very elegant MO analysis. Great job on including the comparison between endo and exo forms.)
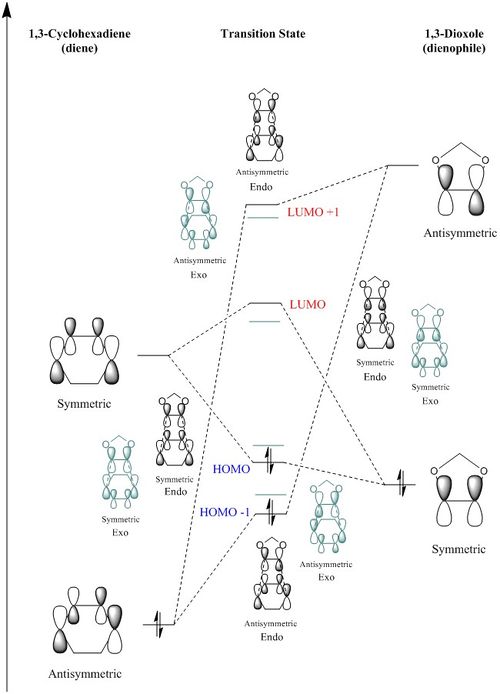
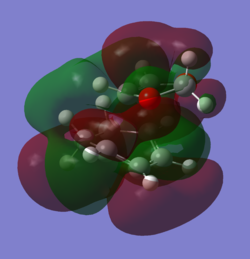
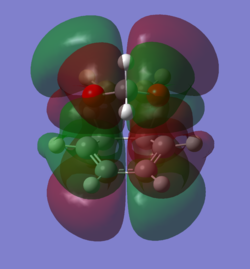
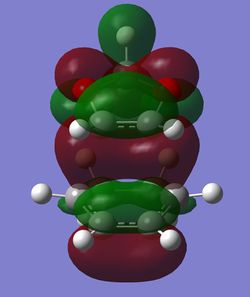
The reactants, TS, and the products of this reaction were optimised using B3LYP method, and the MOs of the reactants and two possible products, endo and exo, were analysed, Table 3. Also, the relative energies of the MOs were obtained from Gaussian, and therefore the MO diagram of the endo TS was constructed. The MO diagram of the exo TS is also included, in pale green, and the energy differences are qualitatively shown in the diagram.
In this Diels-Alder reaction, the dienophile is 1,3-dioxole; hence, the two oxygen groups adjacent to the double bond of the dienophile donate electron density to the π cloud causing a richer double bond and resulting in the destabilisation of both HOMO and LUMO. Therefore, as it can be seen in the MO diagram, the HOMO of the dienophile has been brought closer to the LUMO of the diene raising the effectiveness of their interaction compared to the interaction between the HOMO of diene and the LUMO of the dienophile. This is called an inverse electron demand Diels-Alder reaction.
As it can be seen in the diagram, the energy gap between the HOMO of 1,3-cyclohexadiene and the LUMO of 1,3-dioxole is fairly large, so their interaction is too weak and the resulting HOMO -1 lies below the destabilised HOMO of the dienophile.
The comparison between the relative energies of the endo and the exo transition states has revealed that the endo HOMO -1 and HOMO are more energetically stabilised than the exo ones. The reason for this observation has been studied in depth in the next section.
Energy Analysis
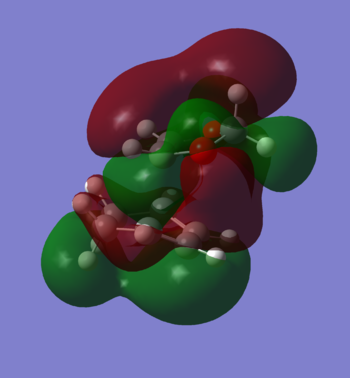
The reaction barrier and the total reaction energy of the formation of both exo and endo products were calculated and listed in Table 4. As it can be observed, the endo product is the more kinetically and thermodynamically favoured product. The reason for this observation can be due to two main factors: (1) the endo product as well as the endo TS benefit from the secondary orbital effect, depicted in Figure 5, where the unhybridised p orbital of the oxygen effectively interacts with the π system of the diene leading to more stable TS and product; (2) the protons of the CH2 fragment between the two oxygen atoms of 1,3-dioxole bears a steric clash with the bridgehead protons of the exo TS and product, while the endo path does not experience such hindrance.
| Product Type | Reaction Barrier
/KJ.mol-1 |
Reaction Energy
/KJ.mol-1 |
|---|---|---|
| Endo | 159.97 | -64.78 |
| Exo | 167.68 | -61.26 |
Nf710 (talk) 21:46, 10 January 2018 (UTC) Your energies are slightly out here. your barriers are correct however and you have come to the correct conclusion. You coudl have explained the sterics or SSO with some diagrams. Good understanding of the electron demand of the reaction, but you could have calculated this quantitatively to prove it.
Files
log file of B3LYP optimised 1,3-cyclohexadiene
log file of B3LYP optimised 1,3-dioxole
log file of B3LYP optimised endo product
log file of B3LYP optimised exo product
log file of PM6 optimised endo IRC
log file of PM6 optimised exo IRC
Exercise 3: Reaction between o-xylylene and SO2

IRC Analysis
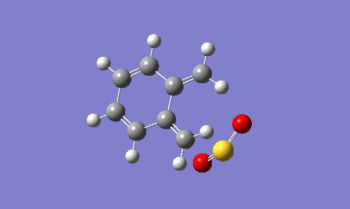
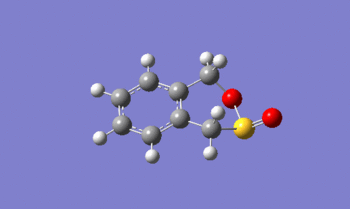
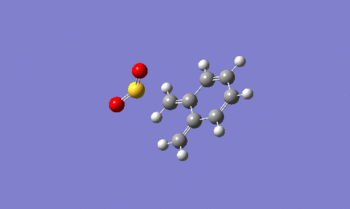
As it has been depicted in Figure 6, sulphur dioxide and o-Xylylene can react in multiple ways. The endo DA, exo DA, and Cheletropic pathways have been suggested in this case. To visualise the bond formation during each of the aforementioned reactions, an IRC calculation was done, and the resulting animated pathways are shown below. According to these calculations, we can determine that the bonds formation in Cheletropic reaction is synchronous, whereas in the case of the Diels-Alder reactions, the formation of the bonds is asynchronous.
| Endo | Exo | Cheletropic |
|---|---|---|
|
|
|
Energy Analysis

Like as the previous exercise, the reaction barrier and energy were calculated. The data show that the endo DA pathway is kinetically more favoured than others since it needs less energy to overcome the barrier. In terms of the reaction barriers, the Cheletropic TS has the highest value due to the formation of the strained and energetically unfavourable 5-membered ring. However, the Cheletropic product is thermodynamically more favoured than the rest two. This stabilisation can be due to the formation of two strong S-C single bonds where the S=O bonds are preserved. In DA reactions, one of the S=O is broken, so their products lie above the Cheletropic product in the energy diagram.
We can say that these three suggested reactions are thermodynamically favoured as benzene is formed in all of them. Moreover, if we look at the IRC animated paths, we can see that the highly stabilised benzene ring is formed before the formation of any other bonds between two reactants. This is an indicative of the favourability of the aromatisation during a reaction.
| Product Type | Reaction Barrier
/KJ.mol-1 |
Reaction Energy
/KJ.mol-1 |
|---|---|---|
| Endo | 80.46 | -100.34 |
| Exo | 84.45 | -100.98 |
| Cheletropic | 102.79 | -157.29 |
Alternative Diels-Alder Pathway
Like as the previous exercise, the reaction barrier and energy were calculated. The data show that the endo DA pathway is kinetically more favoured than others since it needs less energy to overcome the barrier. In terms of the reaction barriers, the Cheletropic TS has the highest value due to the formation of the strained and energetically unfavourable 5-membered ring. However, the Cheletropic product is thermodynamically more favoured than the rest two. This stabilisation can be due to the formation of two strong S-C single bonds where the S=O bonds are preserved. In DA reactions, one of the S=O is broken, so their products lie above the Cheletropic product in the energy diagram.
We can say that these three suggested reactions are thermodynamically favoured as benzene is formed in all of them. Moreover, if we look at the IRC animated paths, we can see that the highly stabilised benzene ring is formed before the formation of any other bonds between two reactants. This is an indicative of the favourability of the aromatisation during a reaction.
| Product Type | Reaction Barrier
/KJ.mol-1 |
Reaction Energy
/KJ.mol-1 |
|---|---|---|
| Endo | 110.68 | 14.96 |
| Exo | 118.52 | 19.41 |
Files
log file of PM6 optimised sulphur dioxide
log file of PM6 optimised 0-xylylene
log file of PM6 optimised endo TS
log file of PM6 optimised exo TS
log file of PM6 optimised cheletropic TS
log file of PM6 optimised endo product
log file of PM6 optimised exo product
log file of PM6 optimised cheletropic product
log file of PM6 endo IRC log file of PM6 exo IRC
log file of PM6 Cheletropic IRC
log file of PM6 optimised endo TS of alternative path
log file of PM6 optimised exo TS of alternative path
log file of PM6 optimised endo product of alternative path
log file of PM6 optimised exo product of alternative path
Conclusion
Like as the previous exercise, the reaction barrier and energy were calculated. The data show that the endo DA pathway is kinetically more favoured than others since it needs less energy to overcome the barrier. In terms of the reaction barriers, the Cheletropic TS has the highest value due to the formation of the strained and energetically unfavourable 5-membered ring. However, the Cheletropic product is thermodynamically more favoured than the rest two. This stabilisation can be due to the formation of two strong S-C single bonds where the S=O bonds are preserved. In DA reactions, one of the S=O is broken, so their products lie above the Cheletropic product in the energy diagram.
We can say that these three suggested reactions are thermodynamically favoured as benzene is formed in all of them. Moreover, if we look at the IRC animated paths, we can see that the highly stabilised benzene ring is formed before the formation of any other bonds between two reactants. This is an indicative of the favourability of the aromatisation during a reaction.
References
- ↑ S. S. Batsanov. "Van der Waals Radii of Elements." Inorganic Materials, Vol. 37, No. 9, 2001, pp. 871–885.
- ↑ LINUS PAULIN, L. 0. BROCKW. "Carbon-Carbon Bond Distances. The Electron Diffraction Investigation of Ethane, Propane, Isobutane, Neopentane, Cyclopropane, Cyclopentane, Cyclohexane, Allene, Ethylene, Isobutene, Tetramethylethylene, Mesitylene, and Hexamethylbenzene. Revised Values of Covalent Radii." Journal of the American Chemical Society, 07/1937, Vol.59(7), pp.1223-1236.

