Rep:TS:ap6715 TS lab
Introduction
Potential Energy Surface
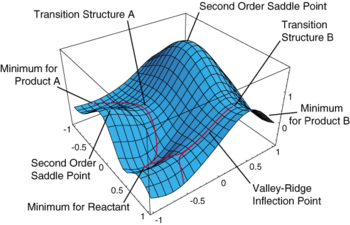
A potential energy surface is a plot of the potential energy of a molecule as a function of a changing degree of freedom within the molecule. Outside of the computational methods typically only one or two degrees of freedom are considered in order to maintain simplicity. Such as in the case of a trimolecular reaction A + BC -> AB + C, the degrees of freedom typically illustrated are limited to just the distances between ‘A and B’ and ‘B and C’. [2] However in order to attain a minimum optimisation or transition state optimisation within computational methods many more degrees of freedom must be considered.
In all molecules there are 3Natoms cartesian coordinates. Internal motions of a molecule result in a change in the potential energy, whereas external motions do not (the global transitions and rotations). For non-linear molecules global transitions and global rotations along each of the cartesian axes displace the molecule in space but result in no change in the potential energy. Therefore, 3Natoms-6 degrees of freedom are required in order to map the potential energy surface of a non-linear molecules internal motions. For linear molecules there are global transitions along each of the cartesian axes which displace the molecule in space but result in no change in the potential energy, however only the global rotations that do not occur on along the bond axis result in both a displacement of the molecule in space and result in no change in the potential energy of the molecule. Therefore, 3Natoms-5 degrees of freedom are required in order to map the potential energy surface of a linear molecules internal motions. [3]
A PES contains containing 3Natoms-6 degrees of freedom can be very complex, containing many different minima, maxima and points of inflection. In computational methods we aim to find the minima (whereby any movement in any degree of freedom results in an increase in the potential energy of a system) for minimum optimisation calculations of each of the products and the reactants. When searching for the correct transition state, we aim to find a 1st order saddle point (movement along only one degree of freedom, the minimum energy pathway, will result in a fall in the potential energy and all other movements will result in an increase in the potential energy) that represents the maximum potential energy on the minimum energy pathway between the reactants and products. [3]
As both the minimum and the 1° saddle point on a PES are stationary points, they are found at the points on the PES where the first differential with respect to all the degrees of freedom is equal to 0. These points can be further distinguished by calculating the second derivative with respect to all the degrees of freedom. The second derivative with respect to all the degrees of freedom is the curvature at the point and, when calculated with respect to the bond distance, it represents the force constant of the bond (k). For a minimum point, the second derivative will be positive for all degrees of freedom. For the desired transition state (1st order saddle point), all the second derivatives with respect to all degrees of freedom should be positive except one negative second derivative. When searching for the transition state a stationary point with multiple negative second derivatives can be found. This is because Nth order saddle points yield N negative second derivatives. [3]
Nf710 (talk) 21:23, 8 February 2018 (UTC) Correct, good understanding. You typically find the force constants by diagonalisation of the hessian matrix.
When carrying out the calculations in GaussView the structures can be confirmed as a minimum or a 1° saddle point by carrying out a frequency analysis. Due to the curvature always being positive for a minimum point, all the force constants will be constant and due to Equation 1 all the vibrational frequencies should be positive. In order to confirm the transition state is a 1st order saddle point there will be a single negative force constant, therefore there should be one imaginary vibrational frequency. This is because in equation 1 the square root of a negative value must be calculated. The animation of this imaginary vibrational frequency should appear as though the transition state is following the reaction pathway to the products, if it is the correct 1st order saddle point.
Equation 1 [2]
Comparison of calculation methods used in this study

Within the labs two different methods have been used to run the calculations, Semi-empirical PM6 and Density Functional Theory (DFT) B3LYP.
The Semi-empirical PM6 method is the faster of the two, calculating the Hamiltonian integrals contained within the hessian matrix using empirically fitted parameters found from experimental data. This makes this method less accurate as many approximations are made in order to use the experimental data. [3]
Nf710 (talk) 21:26, 8 February 2018 (UTC) *contained within the Hamiltonian matrix.
The B3LYP method is the slower more accurate of the two methods as it is essentially two calculations in one. The DFT is used to calculate all the terms in the hamiltonian integrals within the hessian matrix, except the exchange correlation term. The exchange correlation term is calculated using a Hartree Fock calculation. Hartree Fock methods involve analytically solving the Hamiltonian, thus making the B3LYP method the more expensive, but more accurate of the two. [3]
Nf710 (talk) 21:26, 8 February 2018 (UTC) There are GGAs and LDAs also in the xc term for B3lYP
Using the Semi-empirical PM6 method first to attain a structure that is close to the fully optimised structure, before optimising further using the more extensive method, is a good proxy to attain the optimised structure faster than just running the DFT B3LYP method straight away.
The basis set for the wavefunctions used in the hamiltonian integrals within the hessian matrix can be varied between calculations. Examples include 6-31G (d) and 6-31G (d,p). The greater the basis set used the more accurate the calculation however the longer the time required to run the calculation as the hamiltonian integrals are more complex to calculate.
Methods utilised in this study to find the transition state
Method 1
Outline - Optimising a guessed transition state. This is typically the most erroneous method as an understanding of the expected transition state is imperative for the calculation to work correctly.
Procedure - A predicted transition state structure must be drawn in GaussView. The distances between any atoms involved in bond formation or degradation must be set to an intermediate distance, between the combined Van der Waals radii of the two atoms and the typical bonding distance between the two atoms. A PM6 transition state (berny) calculation is then made to yield the transition state. This transition state can be further optimised using a more complex calculation such as B3LYP/6-31G(d).
Method 2
Outline - Optimising from a less optimised guess transition state. This method is typically more reliable than Method 1 as a less exact guess of the transition state can be optimised correctly. A basic understanding of the transition state is still required.
Procedure – A predicted transition state must be drawn in GaussView. As in Method 1 the distances between the atoms involved in bond formation or degradation must be set to an intermediate value. The atoms set to the intermediate values are then frozen using the redundant coordinate editor. A PM6 minimum calculation is then made. This minimises the entire system, apart from the distance between the frozen atoms, therefore yielding a transition state guess that is as close to the actual transition state. A PM6 transition state (berny) calculation, with the bonds now unfrozen, will yield the transition state. This transition state can be further optimised using a more complex calculation such as B3LYP/6-31G(d).
Method 3
Outline – Formulating a transition state from either the reactants or the products. This method is the most reliable and requires the least prior knowledge of the transition state structure.
Procedure – The products/reactants (whichever contains the fewest molecules) is drawn in GaussView. A PM6 minimum calculation is then made. The bonds that are made or broken throughout the reaction pathway are set to an intermediate distance and frozen, such as in the previous methods. In some circumstances atoms not directly involved in bond breaking or formation, but are adjacent to atoms involved, may have to be distorted to reflect changes observed upon movement along the reaction pathway (i.e. a change in hybridisation of an adjacent atom). A PM6 minimum optimisation is conducted to yield the accurate transition state guess, before a subsequent PM6 transition state (berny) calculation produces the transition state. This transition state can be further optimised using a more complex calculation such as B3LYP/6-31G(d).
Methods chosen for each exercise
Exercise 1 and 2ː Method 2
Exercise 3 and extensionː Method 3
This was due to having a better understanding in the expected transition states for exercise 1 and 2, but not for exercise 3 and the extension.
Nf710 (talk) 21:27, 8 February 2018 (UTC) Nice intro you have clearly gone beyond the script here. Well done.
Reaction of Butadiene with Ethylene (Exercise 1)
(Fv611 (talk) Good section overall, but the Butadiene structure was not optimised to it's true (non-planar) minimum, so the energies of its MOs are a bit off. The LUMO of the TS should be lower in energy than the LUMO of the butadiene.)
Reaction scheme

Molecular orbital discussion

| Molecular Orbitals | Butadiene | Ethylene | Transition state | ||||||
|---|---|---|---|---|---|---|---|---|---|
| LUMO + 1 | Not Applicable | Not Applicable | |||||||
| LUMO | |||||||||
| HOMO | |||||||||
| HOMO - 1 | Not Applicable | Not Applicable |
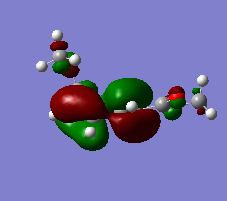
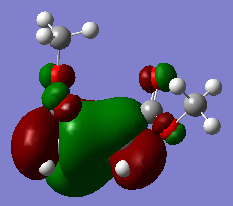
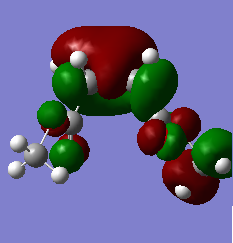
The molecular orbitals within the HOMO/LUMO region of the reactants that interact to form the transition state was assessed by analysing the molecular orbitals observed in the HOMO/LUMO region of the transition state.
By observing Table 1 the HOMO of butadiene is antisymmetric and combines constructively with the the antisymmetric LUMO of ethylene to form the antisymmetric bonding HOMO - 1 of the transition state. The antisymmetric butadiene HOMO also combines with the antisymmetric LUMO of ethylene destructively to form the antibonding antisymmetric LUMO + 1 of the transition state.
Due to the HOMO of butadiene being in closer proximity to the HOMO - 1 of the transition state than the LUMO of ethylene, the HOMO - 1 consists of a greater contribution from the butadiene HOMO. The opposite case is observed for the LUMO + 1 of the transition state, whereby the LUMO of ethylene is the closer of the two contributing orbitals and, therefore the LUMO + 1 consists of greater ethylene LUMO character.
In Table 1 it can be seen that the HOMO of ethylene is symmetric and combines constructively with the symmetric LUMO of butadiene to form the symmetric bonding HOMO of the transition state. The symmetric HOMO of ethylene combines destructively with the symmetric LUMO of butadiene to form the symmetric antibonding LUMO of the transition state.
Due to the HOMO of the ethylene being closer to the HOMO of the transition state there is a greater contribution from the HOMO of the ethylene. The opposite is observed for the formation of the symmetric LUMO of the transition state whereby the closer LUMO of butadiene exhibits a greater contribution to the transition state LUMO.
This is evidence for the fact that only orbitals that share the same symmetry can interact. A symmetric-antisymmetric interaction will result in an orbital overlap of 0, however overlaps of either symmetric-symmetric interaction and antisymmetric-antisymmetric interactions result in a non-zero orbital overlap. If there are no orbitals that share the same symmetry then a reaction will not proceed.
Bond length discussion
| C-C bond | Butadiene | Ethylene | Transition state | Cyclohexene |
|---|---|---|---|---|
| C1-C2 | 1.3353 | - | 1.3798 | 1.5003 |
| C2-C3 | 1.4684 | - | 1.4112 | 1.3377 |
| C3-C4 | 1.3353 | - | 1.3798 | 1.5125 |
| C4-C5 | - | - | 2.1144 | 1.5400 |
| C5-C6 | - | 1.3273 | 1.3818 | 1.5408 |
| C6-C1 | - | - | 2.1150 | 1.5400 |
In this reaction C1, C4, C5 and C6 change hybridisation from sp2 to sp3. C2 and C3 maintain an sp2 hybridisation. The changes in bond lengths observed can be seen in Table 2.The C1-C2 bond length lengthens from 1.3353 Å to 1.5003 Å in the product. This is due to the reduction in the bond order from C=C to C-C. The C2-C3 bond length shortens from 1.4684 Å to 1.3377 Å in the product. This is due to the increase in the bond order from C-C to C=C. The C3-C4 bond length increases from 1.3353 Å to 1.5125 Å in the product. This is due to the reduction in the bond order from C=C to C-C. The C4-C5 bond length decreases to 1.5400 Å. This is due to the formation of a new C-C bond.The C5-C6 bond length increases from 1.3273 Å to 1.5408 Å. This is due to the decrease in bond order from C=C to C-C. The C6-C1 bond length decreases to 1.5400 Å. This is due to the formation of a new C-C bond.
The Van der Waals radius of a C atom is 1.7 Å. [5] While the typical sp2 C=C bond length and sp3 C-C bond length is 1.54 and 1.33 Å respectively. [6] These literature values are close and consistent with the observed changes in bond lengths above.
The partly formed C-C bonds in the transition state are measured to be between 2.114 and 2.115 Å. This is an intermediate value between the single C-C bond length and twice the Van der Waals radius of a C atom.
Negative vibration observed for the Transition State
Figure 5 Negative vibration of the Transition State
Above the vibration corresponding to the reaction path at the transition state has been displayed. The formation of the two bonds is synchronous as the termini of each reactant move towards eachother at the same time. Another method of observing whether synchronous bond formation occurs is by observing the IRC.
LOG Files
Butadieneː
Log file PM6 Minimum Optimisation
Log file of Energy Calculation
Ethyleneː
Log file PM6 Minimum Optimisation
Log file of Energy Calculation
Transition Stateː
Log file PM6 Minimum Optimisation
Log file of Energy Calculation
Cyclohexeneː
Log file PM6 Minimum Optimisation
Log file of Energy Calculation
Reaction of Cyclohexadiene with 1,3-Dioxole (Exercise 2)
Reaction Scheme

Molecular orbital discussion


(Fv611 (talk) Very nice MO diagrams, and discussion on the electron demand. Could have added some discussion on endo vs exo reaction in terms of the relative energy levels of the MOs.)
| Molecular Orbitals | Exo Transition State | Endo Transition State | ||||
|---|---|---|---|---|---|---|
| LUMO + 1 | ||||||
| LUMO | ||||||
| HOMO | ||||||
| HOMO - 1 |
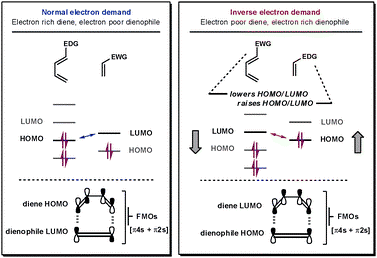
The MO diagrams (both Figure 7 and Figure 8) show that the reaction is an inverse electron demand Diels-Alder reaction. This is because the HOMO of the dienophile and LUMO of the diene are closer together in energy than the HOMO of the diene and the LUMO of the dienophile. The closer the orbitals are together the stronger the interaction, therefore the interaction of the HOMO of the dienophile with the LUMO of the diene is the greater interaction of the two. [7]
Nf710 (talk) 21:31, 8 February 2018 (UTC) How does it sow it? you havent backed up your claim. There is a way in the script that explain how to do this quantitatively.
A typical normal electron demand Diels-Alder reaction involves an electron rich diene and an electron poor dienophile. This results in the HOMO of the diene and the LUMO of the dienophile are closer together than the HOMO of the dienophile and the LUMO of the diene. Therefore the HOMO of the diene with the LUMO of the dienophile is the greater interaction of the two pairs. In this reaction the oxygen atoms of the 1,3-dioxole donates electron density into the dienophile. This raises the energy of the dienophile and results in the switch to the inverse electron demand scenario. This can be clearly seen in Figure 9. [7]
Thermochemistry
| Product | Activation Energy Barrier KJmol-1 | Gibbs Energy KJmol-1 |
|---|---|---|
| Exo | 167.67 | -63.79 |
| Endo | 159.83 | -67.38 |
Figure 10 Secondary orbital overlap of endo Transition State |
The activation energy is the energy required for the reactants to reach the transition state and pass through the reaction pathway down to the products. The lower the activation energy the more kinetically favourable.
The gibbs energy is the energy difference between the reactants and the products. The more negative the gibbs energy is, the more stable the product is in relation to the reactants. Therefore in thermodynamic equilibrating conditions the reaction pathway that has the more negative gibbs energy is favoured.
Table 4 highlights that the activation energy for the endo reaction pathway is less than the activation energy for the exo pathway. Table 4 also highlights that the gibbs energy is more negative for the endo pathway than the gibbs energy for the exo pathway.
From this thermochemical data it can therefore be concluded that the endo product is the kinetic product of the reaction and also the thermodynamic product of the reaction.
The reason as to why the endo reaction pathway is the kinetic pathway is due to the favourable secondary orbital overlap associated between the oxygen p orbitals of the 1,3-dioxole with the pi system of the cyclohexadiene. This can be clearly visualised in Figure 10.
The reason as to why the endo product is the thermodynamic product is understood through observing steric hindrance. In the exo product there is steric clash between the dioxole and the bridgehead hydrogen atoms. In the endo product there is no steric clash between the dioxole and the bridgehead hydrogen atoms. This therefore renders the endo product the lower energy, thermodynamic, product of the two.
LOG Files
1,3- Dioxoleː
Log file B3LYP Minimum Optimisation
Cyclohexadieneː
Log file B3LYP Minimum Optimisation
Exo Transition Stateː
Log file B3LYP TS Berny Optimisation
Endo Transition Stateː
Log file B3LYP TS Berny Optimisation
Endo Productː
Log file B3LYP Minimum Optimisation
Exo Productː
Log file B3LYP Minimum Optimisation
Nf710 (talk) 21:33, 8 February 2018 (UTC) Your energies are correct and you have come to the correct conculsion.
Competition of Cheletropic and Diels-Alder pathway for the cycloaddition between o-Xylylene and SO2 (Exercise 3)
Reaction Scheme

IRC's
 |
 |
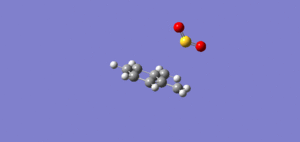 |
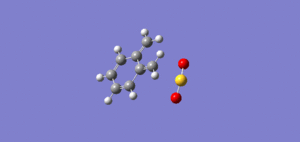
Figures 12-14 illustrate the IRC's of the three reaction pathways which can be used to determine whether the bonds formed between the two reactants form at the same time (synchronous) or at a different times (asynchronous). The IRC's show that the bond formation in the exo and endo Diels-Alder reaction pathway is asynchronous, as in both cases the C-S and C-O bond do not form at the same time. The IRC for the cheletropic reaction pathway involves synchronous bond formation, as both C-S bonds are formed at the same time.
Xylylene is very reactive due to it's desire to form the stable aromatic benzene ring. This desire is clearly indicated in the IRC as the formation of the delocalised aromatic benzene ring occurs faster than the formation of the new C-O and C-S bonds.
Thermochemistry
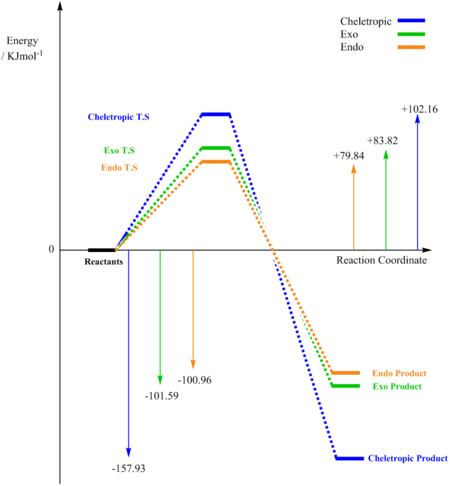
| Product | Activation Energy Barrier KJmol-1 | Gibbs Energy KJmol-1 |
|---|---|---|
| Exo | 83.82 | -101.59 |
| Endo | 79.84 | -100.96 |
| Cheletropic | 102.16 | -157.93 |
(Your xylyene energy is a little high, but it appears to be converged properly so it's fine Tam10 (talk) 14:23, 31 January 2018 (UTC))
Figure 15 and Table 5 illustrate that the lowest activation energy is for the endo reaction pathway and the most negative gibbs energy is for the Cheletropic reaction pathway. Therefore, the kinetic product is the endo product and the thermodynamic product is the Cheletropic product.
The relative activation energies can be rationalised by understanding what is occuring in the transition state. The Cheletropic has the greatest activation energy as the transition state involves the formation of a strained 5-membered ring (a less strained 6-membered ring is formed in the endo and exo reaction pathways). In the same argument explored in exercise 2, the endo reaction pathway results in a secondary orbital overlap. This secondary orbital overlap (in this case from the O atom of SO2 not involved in bond formation) stabilises the transition state. This stabilisation of the transition state results in the observed reduced activation energy for the endo reaction pathway with respect to the exo reaction pathway.
(You should show the secondary orbital overlap if you mention it Tam10 (talk) 14:23, 31 January 2018 (UTC))
In order to understand the relative gibbs energy the bond energies and steric hindrance in the products must be considered. The endo product results in the S=O bond in a position resembling a pseudo axial position on the ring, whereas in the exo product the S=O bond appears to sit in a pseudo equatorial position. The axial position is more hindered on the ring due to unfavourable diaxial interactions. This can therefore rationalise why the exo product is the more thermodynamically favourable product between the two Diels-Alder reaction pathways. The Cheletropic product involves the formation of two C-S bonds (and the maintenance of both S=O bonds), whereas the Diels-Alder products involve the formation of both a C-O and a C-S bond (reducing the bond order of one of the S=O bonds to S-O). As the bond energies of the two C-S bonds and a S=O bond exceed the bond energies of the C-O, C-S, S-O bonds, the thermodynamic product is therefore the Cheletropic product. [8]
(Again, it's best to demonstrate sterics. In order to have diaxial interactions, you need to have at least two atoms in the axial position Tam10 (talk) 14:23, 31 January 2018 (UTC))
LOG Files
o-Xylyleneː
Log file PM6 Minimum Optimisation
SO2ː
Log file PM6 Minimum Optimisation
Exo Transition Stateː
Log file PM6 TS Berny Optimisation
Endo Transition Stateː
Log file PM6 TS Berny Optimisation
Cheletropic Transition Stateː
Log file PM6 TS Berny Optimisation
Exo Productː
Log file PM6 Minimum Optimisation
Endo Productː
Log file PM6 Minimum Optimisation
Cheletropic Productː
Log file PM6 Minimum Optimisation
Diels-Alder at the alternate Diene site of o-Xylylene with SO2
| Product | Activation Energy Barrier KJmol-1 | Gibbs Energy KJmol-1 |
|---|---|---|
| Exo | 117.90 | 18.78 |
| Endo | 110.06 | 14.34 |
 |
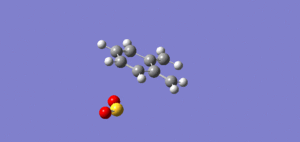 |
In o-Xylylene there is an alternative diene that can undergo the Diels-Alder reaction pathway. This is the cyclohexadiene ring. The activation energies highlight that the endo and exo reaction pathways for each this alternative site are much greater than the endo and exo pathways previously discussed within this section. This indicates that at interaction at the alternative site is kinetically unfavourable with respect to the previously discussed site. An observation of the gibbs energy of each of the reaction pathways in Table 6 also highlight that the products are thermodynamically unfavourable as it is an endothermic pathway (positive gibbs energy). One reason for this is that, in the exo and endo products for the alternative Diels-Alder reaction, the conjugation of within the o-Xylylene is lost and, unlike in the previously discussed Diels-Alder reaction, there is no thermodynamic driving force in the formation of the aromatic benzene ring.
LOG Files
Alternate Exo Transition Stateː
Log file PM6 TS Berny Optimisation
Alternate Endo Transition Stateː
Log file PM6 TS Berny Optimisation
Alternate Exo Productː
Log file PM6 Minimum Optimisation
Alternate Endo Productː
Log file PM6 Minimum Optimisation
Stereochemical explanation for the observed product of a Butadiene derivative electrocyclisation reaction (Extension)
Electrocyclisation classes
 |
There are two classes of electrocyclisations, conrotatory and disrotatory. According to the Woodward-Hoffman rules, in a thermal pericyclic reactions, the number of (4q+2)s + (4r)a components must be odd for the reaction to be allowed. [9]
Therefore, as shown in Figure 18 a pi 4 component in an electrocyclic reaction must interact antarafacially and a pi 6 component in an electrocyclic reaction must interact suprafacially. [9]
Reaction Scheme
 |
Butadiene derivative electrocyclisation explained
In this butadiene derivative example there is a pi 4 component. Therefore according to the Woodward-Hoffman rules, in thermal reactions, the terminal orbitals of the component must interact antarafacially. If the terminal orbitals are to interact antarafacially they must rotate the same way. This is therefore conrotatory. The result of this conrotation is that the two ester side groups end up on the same face. [9]
This is confirmed by observing the MO's in Figure 21-23 whereby the HOMO of the pi 4 component rotates from the reactant to the transition state in order to interact antarafacially. In the product the antarafacial interaction is observed in the formation of the new sigma orbital. The resulting product indicates that both ester side chains are on the same face, confirming the electrocyclisation is a pi4a conrotatory electrocylisation for the butadiene derivative by thermal activation.
(Good section. This is 1/4 of the Woodward-Hoffmann scenarios though. It could be nice to explore a thermal disrotation for example Tam10 (talk) 14:24, 31 January 2018 (UTC)) (+6%)
LOG Files
Butadiene derivativeː
Log file PM6 Minimum Optimisation
Transition Stateː
Log file PM6 TS Berny Optimisation
IRCː
Cyclobuteneː
Log file PM6 Minimum Optimisation
Conclusion
In conclusion, this study has highlighted the use of computational methods to simulate reactions and probe the energetics in order to understand the chemistry surrounding a variety of cycloaddition and, in the case of the extension, electrocyclisation reactions.
The Semi-empirical PM6 calculations proved effective at providing reasonable estimates of structures without the time expensive associated with the DFT B3LYP calculation. DFT B3LYP was able to calculate very accurate optimisation calculations, enabling access to structures comparable to experimental results (shown in exercise 1).
Exercise 1 and 2 showed that the calculations were effective methods to acquire an understanding of how the orbitals on each of the reactants interact to form the Transition State. This enabled formulation of MO diagrams. The energies attained from these computational structures provided a useful tool in qualifying whether the cycloadditions were inverse or normal electron demand.
In exercises 2 and 3, the thermochemical data attained from the calculations enabled qualification of pathways as thermodynamic or kinetic pathways. The computational structures gave an insight into why a particular reaction pathway is favoured, by enabling visualisation of secondary orbital overlaps and also indicated steric hindrances that may occur. This helped to rationalise the thermochemical data.
In the extension the molecular orbitals computed enabled a clear visualisation of how the conrotatory reaction pathway of an electrocyclisation occurs in accordance to the Woodward-Hoffman rules.
References
- ↑ Chemistry LibreTexts 2017. Potential Energy Surface [Online]. [Accessed: 27 January 2018] Available at: https://chem.libretexts.org/Core/Physical_and_Theoretical_Chemistry/Quantum_Mechanics/11%3A_Molecules/Potential_Energy_Surface
- ↑ 2.0 2.1 Atkins, P.W. & De Paula, Julio, 2009. Atkins' physical chemistry 9th ed., Oxford: Oxford University Press.
- ↑ 3.0 3.1 3.2 3.3 3.4 McDouall, J.J.W., 2013. Computational quantum chemistry : molecular structure and properties in silico,
- ↑ Ytau, B 2012, Bohr Model is more useful than Density Functional Theory [Online]. [Accessed: 27 January 2018] Available at: http://www7b.biglobe.ne.jp/~kcy05t/dft.html
- ↑ Bondi, A., 1964. van der Waals volumes and radii. The Journal of physical chemistry, 68(3), pp.441-451.
- ↑ Allen, F.H., Kennard, O., Watson, D.G., Brammer, L., Orpen, A.G. and Taylor, R., 1987. Tables of bond lengths determined by X-ray and neutron diffraction. Part 1. Bond lengths in organic compounds. Journal of the Chemical Society, Perkin Transactions 2, (12), pp.S1-S19.
- ↑ 7.0 7.1 7.2 Foster, R.A. and Willis, M.C., 2013. Tandem inverse-electron-demand hetero-/retro-Diels–Alder reactions for aromatic nitrogen heterocycle synthesis. Chemical Society Reviews, 42(1), pp.63-76.
- ↑ Luo, Y.R., 2007. Comprehensive handbook of chemical bond energies. CRC press.
- ↑ 9.0 9.1 9.2 Clayden, J., Greeves, N., Warren, S. and Wothers, P., „Organic Chemistry “, 2001.


