Rep:Sunkiss pl1208 3
MODULE 3 COMPUTATIONAL CHEMISTRY REPORT BY PRATHAP LATCHMANAN 00561753 (Hope you enjoy reading it as much as i did doing it :) )
Introduction to Module 3
The previous modules (both 1 and 2) often involved the energy minimisation of isomeric products. The minimisation was carried out for the reactants as well as products to determine which would be the more stable product in equilibrium; determining the thermodynamic product of the reaction. However, there was a limitation to the analysis (diels-alder reaction via module 1) (Molybdenum complex via module 2) whereby the predominance of an isomer under kinetic control could not be determined. This was because the transition state energies were not determined and could not be used to determine which isomer had a smaller activation energy barrier towards product formation under kinetic control. Module 3 is expected to give insight into transition state energy determination relative to that of the reactants to determine the reaction profile under kinetic control.
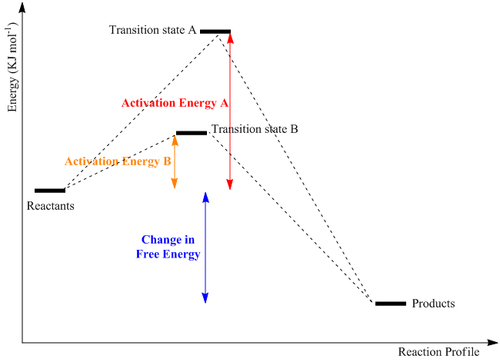
The energy of the transition state can determine the specific kinetics of the reaction profile. Route B imposes a lower barrier and under kinetic conditions yields the more favoured transition state(Diagram 1). Computational efforts are expected to allow an accurate prediction of the actual geometry and energy of the transition state. This allows predictions to be made about the specific product and which would be formed under kinetic control.
Aims of Module
- The Cope rearrangement reaction will be analysed to determine the preferred reaction mechanism by which the [3,3] sigmatropic shift rearrangement occurs. The reaction mechanism will be drawing attention to the specific type of transition state that will be reaction to allow the rearrangement reaction to occur (chair transition state Vs. boat transition state)
- By modelling the 1,5 hexadiene molecule, shortfalls of molecular mechanics and the harmonic oscillator are expected to be highlighted.
The second part of the module looks into the reaction mechanism of two different diels-alder reactions. The first reaction is one that is in-between the dienophile cis-Butadiene and the diene ethylene.
- The computational modelling exercise is expected to shed some light into how the concerted cycloaddition reaction occurs and to determine if it corresponds well to the predicted orbital theory.
- The second diels alder reaction looks into the reaction of maleic anhydride and 1,3-Cyclohexadiene where there is the possibility of both the endo and the exo transition states. This would allow the comparisons to be made against experimentally attained results and draw conclusions.
Cope Rearrangement with specific reference to the 1,5-Hexadiene
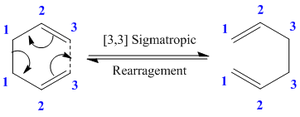
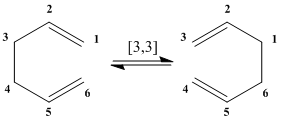
The Cope Rearrangement is defined as a [3,3]-Sigmatropic rearrangement if the 1,5-dienes.[1] The Cope rearrangement reactions was developed by Arthur Cope in the 1930-40s where it has been shown to be a purely intramolecular process for the hexadiene. [2] However, there has been much controversy about the specific mechanism via which the rearrangement occurs where a sigma bond is broken at the [1,1] position and reformed at the [3,3] position. The reaction has been proposed to be a concerted reaction. The computationally modelled system will be used to prove and rationalise it being a concerted reaction.
Introduction
The breaking and reforming of the σ bond is proposed to be possible due to the conjugated π system. Thus, the reaction mechanism (Diagram 2) can be further elaborated as seen in diagram 3 which shows that there is the possibility for two possible transition states. There are two energetically inequivalent conformations for the transition state. This is because due to the conjugated system, there is no intact C=C bonds in the transition state; making it non-rigid to allow both the chair and boat conformations.
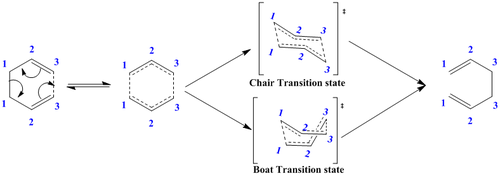
For the calculation of the individual reactants and products, the Molecular Mechanics(MM2 or MM3) as learnt from module 1 will not be used as it is an empirical method that is specific towards determining the total energy of the molecule. In determining the total energy, it would average the electron density of the molecule instead of calculating the specific electron density about each atom within the molecule. Thus although it would give a realistic final energy value, it would not explicitly point out the bond breaking or bond making which we are mechanistically interested in. The schrodiner equation should be solved to allow the specific changes in electron density to be observed. This would help in explaining the orbitals at the transition state and the product. Thus the quantum methods of calculation will be considered for the following optimisations such as Density Functional Theories (DFT).
Optimisation of the Reactants and Products
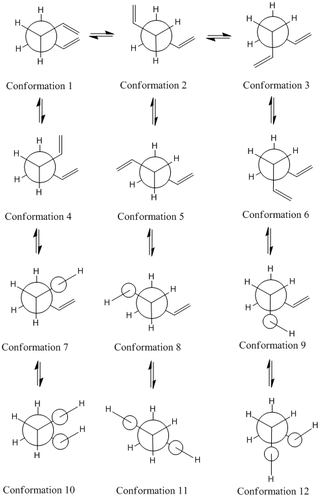
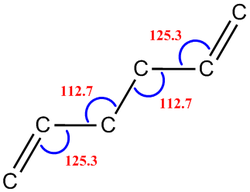
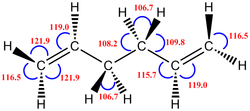
The diagram above shows the Newman projections for the various conformers of 1,5-hexadiene. [3] The molecule is expected to be only slightly rigid as it has three free rotating C-C bonds between the two extreme C=C bonds. Based on literature, there are 27 conformations for the reactant but the relatively high symmetry, of the molecule would rule out 17 of the conformers to give only 10 energetically distinct conformers. Rotation about the C-C central bond would show that conformers 4 and 6 make up an enantiomeric pair. The first 3 conformers are rotamers of each other about the C-C central bond with the vinyl groups fixed to be antiparallel to each other. The next three (4,5 and 6) are similar rotamers of each other but instead have the vinyl groups parallel to each other.
The next 3 conformations, (7 to 9) have one of their Csp2-Csp3 bonds to be in S-cis conformation which results in the C-C bond to eclipses the C=C bond. For the last three conformers both the Csp2-Csp3 bonds eclipse the two C=C bonds. However, from literature it is known that the last 6 conformers are of a very high energy level and would have a low population of states during the reaction as the population of states is expected to comply to a boltzmann distribution. Only the first 6 conformations will be considered as they are the more energetically populated isomers of the reactant.
Process towards Optimisation
1. The 1,5 hexadiene was first drawn in gaussview as a linear chain possessing the anti linkage about the centre 4 carbon atoms. The structure was then cleaned to prepare the molecule for optimisation calculations. For the first set of optimisations, the antiperiplanar conformations were analysed so the dihedral angle between the central 4 atoms was fixed at 180.0 degrees.
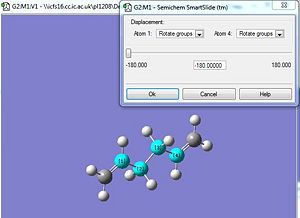
2. As per instructions, the optimisation was carried out via the Hartree Fock(HF) method under the 3-21G basis set. However, the initial settings under the 'Link 0' tab of %mem=250MW resulted in the last link of the calculation via Gaussian 3 to be aborted. This was rectified and changed to %mem=250MB which fixed the error. This could be due to the lack of memory or the wrong units needed for the run.
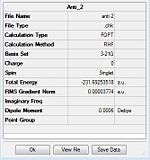
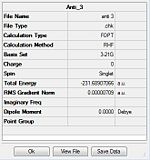
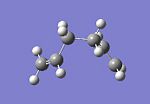
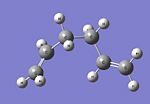
3. This optimisation was carried out for all 6 conformations and the respective summary of the optimisations were taken note. This was done by opening the .fchk files from each of the optimisations.
4. For some of the summary files, there was no point group dictated. Thus, the edit tab was opened and 'Symmetrise' was selected to determine the point group of the conformer. The results were tabulated in table 1 below.
This was the standard procedure adopted in optimisation efforts for all 6 conformers. For the antiperiplanar conformers, the dihedral angle was initially set to 180 deg. The terminal vinyl groups were rotated in different orientations while keeping the central 4 carbons in the same 180 degree dihedral angle. The results were recorded as per table 1.
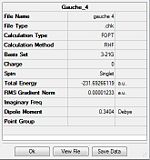
A similar set of procedures were adopted for the Gauche conformers where the Gauche linkage between the central 4 carbon atoms was established by setting the dihedral angle as 60 deg. The results were recorded in table 2

The different variations were made, optimised and compared against the structures in Appendix 1. To arrange the atoms to the different conformations, the bonds were first removed to allow the different spatial arrangements of the atoms. Once the varying orientations were made, the bonds were re-formed and then optimised via Gaussian 3.
Results and Analysis

The large steric clash expected in the gauche conformer is expected to result in the most stable conformation to be one of the antiperiplanar conformers (Diagram 7). This is because the largest groups being the vinyl groups relative to the hydrogens are furthest apart in the anti conformation. This makes them sterically in a more favourable orientation as compared to the Gauche conformers which have a more positive energy than the most stable antiperiplanar conformer due to greater destabilisation effects brought about by increased steric repulsion and greater torsional strain due to the vinyl groups being much closer to each other.
| Conformer | Structure | Point Group | Literature Point Group | Energy/Hartrees HF/3-21G |
Literature Energy/Hartrees HF/3-21G |
Summary of Optimisation |
| Antiperiplanar 1 | C2 | C2 | -231.69260 | -231.69260 | ||
| Antiperiplanar 2 | Ci | Ci | -231.69254 | -231.69254 |
| |
| Antiperiplanar 3 | C2h | C2h | -231.68907 | -231.68907 |
| Conformer | Structure | Point Group | Literature Point Group | Energy/Hartrees HF/3-21G |
Literature Energy/Hartrees HF/3-21G |
Summary of Optimisation |
| Gauche 1 | C2/C1 | C2 | -231.69167 | -231.69167 | ||
| Gauche 2 | C2/C1 | C2 | -231.69153 | -231.69153 | ||
| Gauche 3 | C1 | C1 | -231.69266 | -231.69266 |
Comparisons made from both tables (1 and 2) show that the Gauche-3 conformer is the most stable conformer. This contradicts with the initially rationalised steric argument. Thus, it can be concluded that steric interactions is not the only determining factor on which is the most stable conformation. Graph 1 shows that Gauche 3 (plot 6) is the lowest and is followed by the C2 anti conformer (plot 1).
(Error in graph-legend labelling : the second lowest is Anti-conformer 1 not anti-conformer 2)

Analysis of the HOMO and LUMO of the two conformers indicates that the Gauche 3 conformer has additional stabilisation from the effective overlap of orbitals as they are in the correct orientation, correct phase and most importantly close proximity.[6]However, there is a significant amount of steric repulsion as initially anticipated but the stabilising effects of the orbital overlap between the C=C π orbital and the C-H σ* orbital is much more stabilising than the destabilising effects of the steric repulsions in the Gauche 3. Thus, the gausche conformation being in the ideal orientation and proximity is more stable than the antiperiplanar conformation which does not have the availability for such an orbital overlap due to greater proximity between the C=C and C-H orbitals. This explains the deviation from the initially expected trend specifically for the Gauche 3 conformer.
From the table, it is noted that it is only Gauche 3 that is of a more stable energy level than the antiperiplanar conformations due to the favourable orbital interactions. The others Gauche conformations do not have this stabilising interaction and the initial steric rationale shows that usually the anti conformers are more stable conformer (usually).
The most stable conformer has the largest activation energy barrier to 'reach' the transition state (Diagram 1). Thus, it can be expected that the Gauche-3 conformer would be the most abundant in the reaction mixture as it would have the highest activation energy barrier and least readily 'activated'. Thus, the Cope rearrangement is expected tp occur via the Anti-conformer 2 due to the correct orbital orientation of the vinyl groups and as it is of a slightly higher energy level (lower energy barrier) making it the most reactive species relative to Gauche 3.
This makes perfect sense from a boltzmann distribution argument where by the Cope rearrangement is in equilibrium and the anti-2 conformer not being the most stable is not the most populated. But being the most reactive, it would be readily driven towards product formation and would have the implication of an equilibrium shift to occur to maintain the equilibrium population of states. This would drive the reaction foreward towards product formation making anti-2 the ideal conformer as the reacting species.
Comparison of HF optimisation against DFT optimisation
It has been determined that the anti-2 conformer is the reactant towards product formation. However, the HF method of optimisation is expected to only result in a approximation of the optimised energy level. To gain further accuracy, the anti-2(Ci) is further optimised with Density Functional Theories (DFT) via the B3LYP/6-31G(d) basis set. This is expected to provided a better representation of the optimised geometry of the conformer as it is via a more accurate basis set and method.
| Conformer | Structure | Point Group | Energy/Hartrees HF/3-21G |
Energy/DFT 6-31G (d) |
Summary of Optimisation |
| Antiperiplanar Conformation Ci | C2 | -231.693 | -234.612 |
The energy of the conformer attained via the DFT optimisation method is significantly lower than the HF/6-31G method of optimisation. However the use of different methods of calculation and different basis sets makes the energies not a reliable parameter for comparison. However, as it is a different method, the energies of the molecule are distinctly different as anticipated. Other properties of the molecules will be looked into to compare and rationalise the differences.
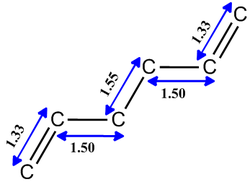
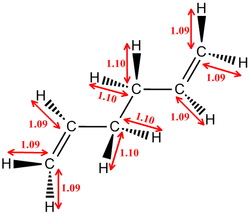
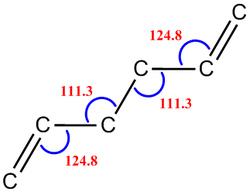
There is no change in the point group symmetry via both methods of optimisations. However, the corresponding bond lengths show slight changes upon the DFT optimisation. This shows that although the HF method of optimisation is not the most accurate representation some credit can be given to that method of optimisation as there is minimal differences between the bond lengths as seen in table 4.
Comparisons of the C=C bond lengths; they are very similar to their counterparts. But on average, the C=C bond lengths in the DFT optimised structure is larger than the HF optimised structure. As for the C-H bond lengths, a similar trend is seen where by the DFT optimised structure has a larger bond length as compared to the corresponding bond lengths in the HF optimised conformer. Analysis of the bond angles and the dihedral angles would show that they remain relatively constant across both optimisations which further rationalises the reason for both conformations to have the same point group symmetry.
It would also show the importance of carrying out a rough optimisation before carrying out the more accurate optimisation since the rough optimisation brings the molecule to the lowest energy conformation. This allows the accurate optimisation to only further improve on it; by which reducing the computational time and resources.
Vibrational Frequency Analysis of the Reactants and Products
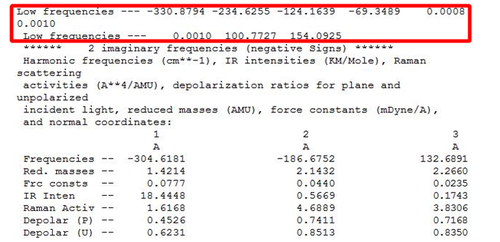
The vibrational frequency analysis carried out is useful as it determines if the optimisation has been successful in attaining the lowest energy configuration of the conformer. This can be determined via two ways that have been annotated as follows.
- The largest low frequency should always be almost 1 order of magnitude larger than the lowest normal vibration given. This can be attained from the .log file; thus indicating that the ground state has been attained instead of the transition state.
- The other way is to check for a negative frequencies in the output where by if there is one negative frequency it is indicative that there is a maximum turning point instead of a minimum and is that of the transition state instead of the group state. It there is more than one negative value then the optimisation has failed to reach completion. If all are positive then the minimum point has been achieved :)
Using the two methods as a basis of comparison, both methods of optimisation (HF and DFT) will be compared to determine if the optimisation had reached completion. This will help determine which one will be more reliable for further vibrational analysis.
 |
| [|Failed Freq Analysis HF/3-21G] |
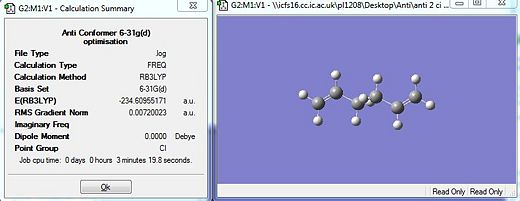
Diagram 7 shows the extract from the .log file of anti-2 conformer via the HF/3-21G optimisation + Freq method. The presence of the negative frequencies (highlighted) is indicative that the minimum point was not reached. Optimisation did not reach a completion under the HF method.
 |
| [|Freq Analysis DFT/6-31G(d) ] |
From the .log file attained via the DFT optimsation, it is observed that there are no negative frequencies. This is indicative that the optimisation had resulted in the ground state configuration to be achieved for the anti-2 conformation (Ci). Thus, the optimisation under the DFT method has been successful and further analysis can be extracted from that frequency file. Since the HF method led to an incomplete optimisation the analysis of that log file will be left out.
Thermochemistry Analysis via DFT/6-31G (d)
Analysis of the Log file under the DFT method was carried out where by under the vibrational temperatures section there was a list of energies. There were 4 distinct rows which are denoted as follows with their significance.
- the sum of electronic and zero-point energies - the potential energy at 0 K including the zero-point vibrational energy (E = Eelec + ZPE)
- the sum of electronic and thermal energies - the energy at 298.15 K and 1 atm of pressure which includes contributions from the translational, rotational, and vibrational energy modes at this temperature (E = E + Evib + Erot + Etrans)
- the sum of electronic and thermal enthalpies - an additional correction for RT (H = E + RT) which is particularly important when looking at dissociation reactions
- the sum of electronic and thermal free energies - the entropic contribution to the free energy (G = H - TS)
Analysis of the .log file revealed that the initial calculations were carried out at 298.15 K (room temp). These calculations were taken into account and a further calculation was done by re-running the data at an temperature of 0 K. This was done by re-running the frequency optimisation with the same basis set and method as the previous run with the additional keywords ‘Freq=ReadIsotopes’. At the end of the input file, a manual addition of (blank line) 0.0 1.0 was added to indicate the 0 K and 1 atm pressure. The energies were tabulated as found below in table 5.
| Energies (a.u.) | 298.15 K/a.u. | 0 K/a.u. |
| Sum of Electronic and Zero-point Energies | -234.469154 (-234.4692) | -234.4499 |
| Sum of Electronic and Thermal Energies | -234.461788 (-234.4618) | -234.4499 |
| Sum of Electronic and Thermal Enthalpies | -234.460886 (-234.4609) | -234.4499 |
| Sum of Electronic and Thermal Free Energies | -234.500704 (-234.5007) | -234.4499 |
| Brackets refer to the rounding off to 4 decimal places |
Switching from the 298K to 0K operating temperature, allowed the determination of the zero point energy (purely electronic energy). Although this is less useful since all experiments are done at room temperature, it would allow the following observation to be made via comparisons. Also it would allow the zero point energy to be determined and the entropic contribution to be determined at above 0K temperatures.
The results show that as the temperature decreases, there is a decrease in the magnitude for all 4 specific energies. This signifies that the stability of the conformer also decreases as the temperature goes down. This can be rationalised as the reduction in the entropic contribution to the overall Gibbs free energy which results in less stable energetics. All the values at 0K are the same as they are indicative of the zero thermal contribution. Thus, the value at 0K is representative solely of the electronic and zero point energies of the system. This could rationalise why the energy level at 0K is higher (less stable) since more energy will be required to overcome the higher vibrational,rotational and translation energies due to the absence of entropic contributions. Also, it can be noted that the entropic term is expected to be temperature dependent where by with a higher temperature a higher entropic contribution is expected.
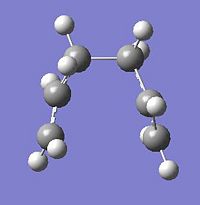
Optimizing the "Chair" Transition Structures
From the earlier sections, the anti-Conformer with the Ci symmetry was determined to be the reactive species and was then optimised and analysed. This section aims to determine the transition state for the earlier discussed cope rearrangement reaction for the 1,5 hexadiene molecule. In the introduction it was discussed that there are two possible transition states that could arise (chair and boat). Two different techniques will be applied towards determining the transition state and a cross analysis of the two will be carried out.
Method 1 : Attaining the Chair Transition state via the Force Constant Matrix (Hessian)
The force constant matrix works on the principal that if the starting geometry of the molecule fragment is close enough to that expected of the transition state, then the Hessian method of computation can be used as the first step. The matrix if successful will determine the direction of a negative curvation in the potential energy surface (PES). This would be the expected transition state that is to be determined.
Process Under taken towards Hessian Implementation
- The Allyl Fragments of CH2CHCH2 was drawn in Gaussview 5 and was optimised using the HF/3-21G method and basis set to give the lowest energy conformation. [|initial optimisation]
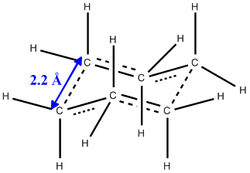
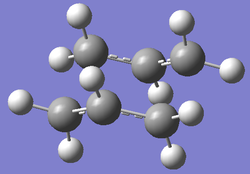
- The optimised structure was then copied twice into a new mol group where the two fragments were re-orientated such that they eclipsed each other and had an inter fragment distance (terminal-terminal) of 2.2 Å. This was shown in the below table.
 |
 |
- The next step was to click the Gaussian menu, under Calculate clicked the Job Type tab. The Opt+Freqwas selected and then change to Optimization' to a 'Minimum to Optimization to a TS (Berny)'. Subsequently, in the Additional keyword box at the bottom, Opt=NoEigen was typed . The keywords are implaced to stop the calculation from crashing if more than one imaginary frequency is detected during the optimization. This can often happen if the guess transition structure is not good enough. The Hessian implementation is successful only if the geometry of the 'guessed' state is close to the actual transition state.
Analysis of Results Via the Hessian Implementation
The successful optimisation to the transition state, was vibrationally confirmed via the presence of a negative vibration (-818 cm-1). This is indicative of the maximum turning point on a reaction profile which fits that of a transition state.
| Parameter | Optimised Through the Hessian Optimisation | |||
| Total Energy Summary |  | |||
| Total Energy (a.u.) | -231.6193 | |||
| Imaginary Frequency (cm-1) | -817.95 (-818) | |||
| Animation of Frequency |
| |||
| [|Hessian Optimisation Log file] | ||||
From table 7, it is evident that the transition state has been reached as the log file shows a single negative frequency. As we have initially suggested the [3,3] mechanism of the cope rearrangement (Diagram 2), the animation of the -818 cm-1 can be put into context.
The animation shows that one end of the terminal carbon bonds move closer to each other at the expense of the other-end of carbon atoms to be moving further away from each other. This complements the conclusion that the transition state has been achieved as the former shows the bond formation and the latter shows a representation of bond breaking which are anticipated in the transition state for the hexadiene.
Method 2 : Attaining the Chair Transition state via the Frozen coordinate Method
This method of finding the transition state via frozen coordinates is the other method previously discussed. The main difference between the two methods is that in the frozen coordinate method of bond making and bond breaking distances have been set to a constant of 2.2 Å. The implementation of the Redundant coordinate editor should result in the fully optimised transition state with respect to differences in the bond lengths. This method is ideal in the event the 'guessed' transition state geometry is very different from the actual transition state geometry which then results in the Hessian method to fail. This is because, the curvature of the surface is significantly different at points far removed from the transition structure.
Process Under taken towards Frozen coordinate Implementation
The distances between the two fragments were fixed to 2.2 Å via the Gaussview 5.0 Redundant Co-Ordinate Editor. Once this was set, the optimisation was again carried out via the HF/3-21G method and basis set.
After the initial optimisation, the terminal carbon fragment's distance were measured to ensure the distance was still 2.2 Å (it was !). This was indicative that the bonds were still frozen.
Following this the lengths between the two ally fragments of the transition state were 'unfrozen' and optimised via the Editor again. This time the Optimisation + Frequency optimisation was carried out. A change in the previously frozen C-C distance is expected to change.
Analysis of Results Via the frozen coordinate Implementation
Successful optimisation to the transition state was then carried out and the frequency analysis was carried out. The maximum turning point is vibrationally confirmed via the presence of a single negative vibration (-818 cm-1). This is indicative of the maximum turning point on a reaction profile which fits that of a transition state.
| Parameter | Optimised Through the Redundant editor Optimisation | |||
| Pre Opt+Freq Inter-frag distance | 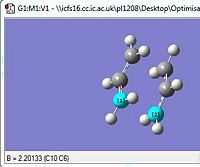 | |||
| Post Opt+Freq Inter-frag distance | 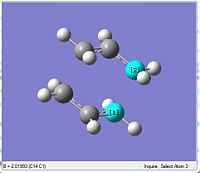 | |||
| Total Energy Summary |  | |||
| Total Energy (a.u.) | -231.6193 | |||
| Imaginary Frequency (cm-1) | -818.043 (-818) | |||
| Animation of Frequency |
| |||
| [|Frozen Method Optimisation Log file] | ||||
It is evident that the transition state has been reached as the log file shows a single negative frequency (Table 8). This is indicative of the successful optimisation towards the transition state. As we know the [3,3] mechanism of the cope rearrangement and drew the schematic earlier of that transition state, the animation of the -818 cm-1 can be put into context similar to how it was done via method 1.
The animation shows that one end of the terminal carbon bonds are moving closer to each other at the expense of the other end carbon atoms to be moving further away from each other. This complements the conclusion that the transition state has been achieved as the former shows the bond formation and the latter is a representation of bond breaking which are anticipated in the transition state for the hexadiene.
Comparing the initially set distances between the terminal allyl fragments would show that the fragments were brought closer together to each other from the initial distance of 2.20 Å to a much closer distance to 2.02 Å. Analysis of the gradient, shows a value of 0.00005 which is much smaller than 0.001. This was also indicative that the optimisation had reached a completion.
Comparison of Structures attained via Both Methods
| Parameter | Optimised Through a TS (Berny) | Optimised Through a Frozen Coordinate Method | ||||||
| Terminal C-C bond length (Å) | 2.02 | 2.02 | ||||||
| Energy/a.u. | -231.6193 | -231.6193 | ||||||
| Imaginary Frequency/cm-1 | -817.95 (-818) | -818.043 (-818) | ||||||
| Animation |
|
|
The detailed comparison shows that both the methods result in the same chair transition to be formed with the same inter-fragment bond distance upon the optimisation. As the difference in the total energy is more than 4 decimal differences, it has been assume to be of a negligible difference. As both the vibrational frequency result in a single negative wavenumber that are of highly similar magnitudes they are shown via the animal to also give the same type of vibrational stretch to be observed (Table 9).
Thus, it can be concluded that the 'guessed' conformation was significantly close to the geometry of the actual chair transition state which allowed the Force matrix method of optimisation to be successful as it has been compared against the 'Frozen' method of optimisation which is not as 'geometry-sensitive' as the force matrix method and both result in the same values.
Intrinsic Reaction Coordinate (IRC) Method For the Chair Transition State
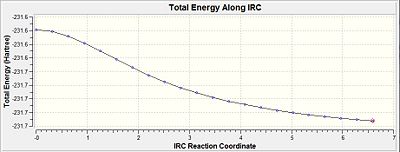
As it is almost impossible to predict which conformer the reaction pathways from the transition structures will result in, the IRC method serves as a medium to follow the reaction mechanism. This is defined as the monitoring of the minimum energy path taken from the transition state to the local minimum on the potential energy surface (towards product). This monitoring is done by generating a series of points that represent the small geometry changes in the direction where the gradient on the potential energy surface is the largest (steepest). The greater the number of points the more accurately small geometric changes will be accounted for.
When the calculation does not reach the minimum geometry (anticipated), three different routes towards geometry optimisation will be considered and subsequently compared with each other to compare and contrast the respective methods.
- The first method upon incomplete minimisation would result in taking the last point on the IRC and run a normal minimization via the HF/3-21G method and basis set to achieve the minimisation. This approach is advantageous since it is the fastest, but if you are not close enough to a local minimum, you may end up in the wrong minimum
- The second method would be to restart the IRC and specify a larger number of points until it reaches a minimum point geometry is achieved.is more reliable but if too many points are needed, could also veer off in the wrong direction after a while and end up at the wrong structure.
- The final method would be to redo the IRC specifying that you want to compute the force constants at every step. This is the most reliable but also the most expensive and is not always feasible for large systems
Process for IRC calculations
To allow a sound basis of comparison, all the optimisation efforts will be carried out by the use of the HF/3-21G method and basis set. As the transition is expected to subtend between the reactant and products, the movement from transition state to products is same as the movement from transition state to reactants. Thus, a symmetric reaction profile only needs the calculations to be done for the foreward reaction since the foreward calculations of geometries and energies will be equal to the backwards reaction in a symmetric reaction profile.
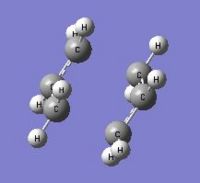
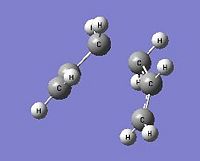
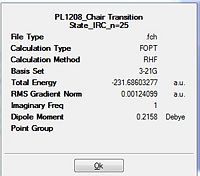
The .ckh file for the optimized transition chair structure (TS Berny) under the redundant coordinate method was opened via Gaussview 5. For the first step, the IRC job type was selected and the number of points along the IRC was set to 25. The job were then submitted to scan and analysed in the table below.
| Diagram for 1st point | Diagram for last point | Summary | IRC Pathway | IRC Gradient |
|---|---|---|---|---|
 |
 |
 |
 |
 |
| [|IRC n=25 log File] | [|IRC n=25 fchk File] | |||
The RMS gradient is 0.00124 which was well above the 0.001 (table 10). This was the first indication that the calculation had not reached a completion yet. Thus, the above energy was not a representation of the lowest energy of the transition state. Furthermore, when this was compared with the conformers in appendix 1, it is evident that the lowest energy conformation was not reached since the energy of the optimisation was -231.6860 a.u. but the conformers in the appendix have more negative energies (more stable). This is indicative of a even lower energy conformation being possible.
A similar IRC calculation was then carried out for same transition state but instead with n=50 points. This gave a total energy of -231.6880 and an gradient of 0.00192. This was very similar to the above table and was indicative that the minimisation was not complete even with twice the number of points. Thus the three different methods were then considered.
Method 1
| Summary | Diagram of Optimised Transition state | RMS Gradient and total energy | ||
|---|---|---|---|---|
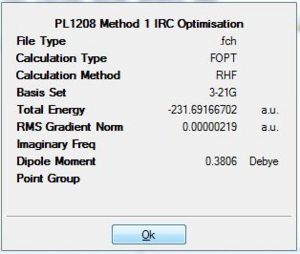 |
 | |||
| [|HF/3-21G Optimisation log File] | [|HF/3-21G Optimisation fchk File] |

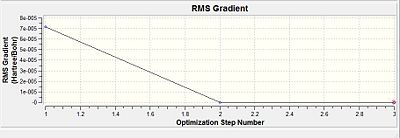
From table 10, it is observed that the RMS gradient has been reduced significantly to a value of 0.00000219 which is well below the threshold of 0.001 for the gradient. Thus, it can be seen from the gradient diagram that there is a horizontal line close to zero obtained. This is indicative that the optimisation to the lowest geometry for the transition state has been achieved. When the conformer was symmetrised under the Gaussview option, it resulted in a C2 symmetry point group. The minimised energy was given as -231.691667 a.u. and had an dihedral angel of -64.2 for the centre 4 Carbons. This suggested a gauche type conformation as seen earlier and was further confirmed by comparing with the Gauche 2 values (Diagram 9). This shows that the optimisation was successful in attaining the Gauche 2 conformation for the transition state.
Method 3
This being the most reliable method and having a small transition state system allowed it to be highly feasible to be carried out. This is because having every force constant calculated for a large molecule would take up a large amount of computational resource and time. But here the molecule being rather small would allow it to be readily carried out.
| Summary | Diagram of Optimised Transition state | First point | last point | ||
|---|---|---|---|---|---|
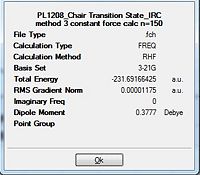 |
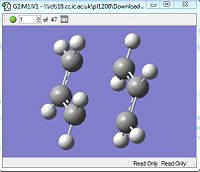 |
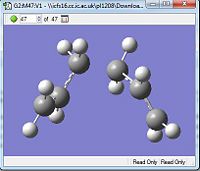
|
| RMS Gradient | Total energy |
|---|---|
 |
 |
| [|Constant Force IRC .log File] | [|Constant Force IRC .fchk File] |
From table 10, the total energy of the conformation is given as -231.691664 a.u. The gradient of the minimisation gave a value of 0.00001 which is smaller than 0.001 and is indicative of completion of the minimisation. The dihedral angle calculated across the 4 central carbons is given as -64.6 deg. When this total energy is compared against the appendix A, the value is very close to the energy of the Gauche conformer 2. Also, when this is compared with the single force constant calculation, the gradient yielded a better result and is more accurate to the minimal value of the gauche 2 conformer.
Comparing Method 3 (Constant Force Calculation against Single Force Calculation
From the comparisons made, it is seen that the method that utilised the single force constant calculation (Method 1) only needed 24 steps to 'fully converge' before the 50th point was reached. This was because there was a loop between the 24th and 25th point that resulted in the early termination.
Comparing the total energies (Diagram 10 and 11) would show that the energy of the system decreases from the first point towards the final point (n=50). The closer the RMS gradient value is to zero would be indicative that the energy of the system gets closer to the minimum value and would start to plateau. The more it reaches a plateau, the closer the gradient value gets to zero. This is distinctly seen when method 3 is compared against method 1 where by method 3 would show the 'plateau-ing' of the total energy as compared to method 1 which has yet to plateau.
Comparing the RMS gradients, the same effect is seen where by the Method 3 (Diagram 14) brings about a much more closer to zero value as compared to the single force calculation (Diagram 15) which is still significantly above the 0.001 a.u. value.
From this it is seen that the problem of determining the conformer that leads to transition state is no more. The IRC method of calculation allows the energy of the transition state to be determined as it would be shown to be that of the Gauche 2 conformer. This has been proven in both the sections that the final energy via Method 3 and Method 1 that the final energy corresponds well to -231.6917 a.u. (Diagram 9).
However, there is a slight amount of contradiction that has to be considered. The Gauche 2 has an energy level of -231.69167 a.u. which was deemed by IRC to be the lowest minimised conformation. But analysis of the Appendix A would show that the Gauche 3 due to the orbital stabilisations has the even lower energy configuration of -231.69266 a.u. . This would show that maybe more points are needed for the IRC caluclation and possibly the calculation of the force constants should be constant as well. Thus there has to be a balance between the number of points along the IRC as well as calculation of force constants. This has to be a balance as more accurate results would mean higher computational resources being needed.
Optimizing the "Boat" Transition Structures
Upon optimising the Chair like transition state and determining which conformer contributes towards the formation. The other transition will now be considered. This transition state will be utilising a different technique known as the QST2 calculation. For the optimisation of the boat transition state, both the reactant and products are defined. By explicitly defining the reactant and product structures, the Gaussian 03 is to be used to interpolate between the two states. This is utilised to determine the transition state between the two 'extremes'.
Process for the optimisation via QST2
The first part of the reaction involved the sequential numbering of the carbon fragment. This was to ensure that the reactants will be directly mapped onto the products upon the [3,3] rearrangement. Thus the molecule in the Anti-Ci conformation from a previous .chk file was opened. Upon opening, a second window was opened and a Copy the optimized reactant molecule was added into the new window. To allow the schematic carbon labelling to correspond with the Molgroups in Gaussview, and for the reactant numbering to correspond to that of the product's, the Edit tab was opened to alter the atom labelling (Diagram x).
The file will then be set up to be run a TS (QST2) file via the Optimisation + Frequency option using the HF/3-21G method and basis set. However, as anticipated in the script, the calculation had failed. It resulted in the formation of a chair-like transition state instead of the boat expected. As rationalised by the script, the calculation linearly interpolated between the two structures, translated the top allyl fragment and did not even consider the possibility of a rotation around the central bonds.
Instead the initial geometry file was opened and a further change to the angles was carried out to make it more 'like' a boat orientation. This was done by changing the dihedral of the centre 4 carbons to 0 deg and the inside C-C-C bond to 100 degrees (Diagram x)
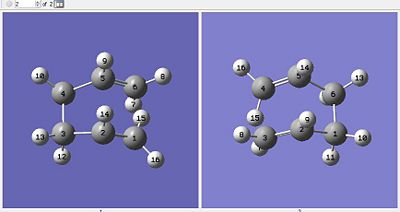
The new-geometry of the input was then resent for optimisation+Frequency via the QST2 mode and the HF/3-21G basis set.
Analysis of Results for Boat Optimisation via QST2 method
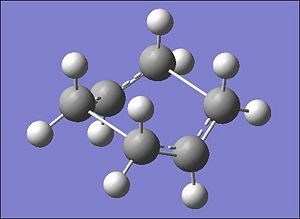
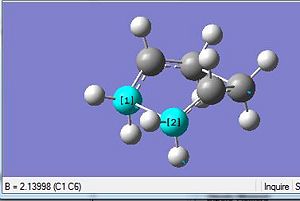
| Boat Optimised Using QST2 | Terminal C-C bond length/Å |
 |
 |
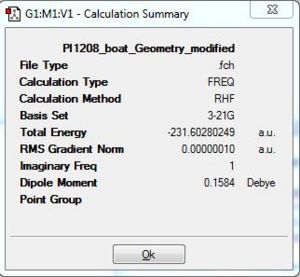
| Energy/a.u. | RMS Gradient and Total Energy |
 |
  |
| Imaginary Frequency/cm-1 | Animation for Imaginary Frequency | |||
 |
| |||
| Source File | [|D-space Link to Optimisation] |
It can be seen that the slight change in the dihedral angle and inner c-c-c bond angles allowed the gaussian software to successfully optimise the geometry towards that of the boat transition state. Analysis of the Summary table above shows that the total energy was slight less stable than that attained via the Chair transition state optimisation. This can be rationalised due to the two CH2 groups being on the same side of the plane would result in a greater extent of steric influence that brings about a slightly greater destabilisation effect relative to the chair transition state which has an optimised energy via HF/3-21G of -231.69 a.u. Thus, being more less negative would make the boat conformation (-231.60 a.u.) the less stable transition state. This would further explain why the C-C bond has a much longer bond length of 2.14Å as compared to the chair transition state which has 2.02Å. The shorter the bond length, the stronger and more stable the bond thus the more negative total energy for the chair relative to the boat.
The Optimisation efforts were deeemed to have reached completion as seen from the RMS gradient to be very much smaller than 0.001 a.u. Thus the convergence was evident. This was further reconfirmed from the Vibrational frequency log file which was indicative of a single negative frequency that was indicative of a maximum turning point. This was indicative that the optimisation have progressed successfully towards the transition state.
The imaginary frequency attained via the chair transition state optimisation was -818 cm-1. But from the table above it is seen that the imaginary frequency is of a slightly higher magnitude of -840 cm-1. The type of vibrations seen is very similar to that of the chair stretching vibrations. Here, it is showing the C-C bond formation at one end and at the other terminal end it is the C-C bond breaking. These are represented by the shortening and lengthening of the bonds respectively.
Thus it can be seen that bond the Ts(BERNY) method and the Ts(QST2) method are able to bring about relatively accurate optimisation to the transition state. This comparison can be made since both had used the same method (HF) and the same basis set (3-21G). But as seen the Ts(BERNY) method was a much less tedious method as compared to the QST2 method. This is because alot of 'pre-calculations' had to be done for the latter such as the atom re-numbering to ensure the reactants map onto the products if not the extrapolation would fail via the QST2. For this hexadiene the re-numbering was done relatively readily but if a much larger reactant was to be done the re-numbering of the atoms will prove to be a challenge which would make the Ts (berny) a much more prefered method of calculating.
Determining the Activation Energies for the [3,3] Cope rearrangement reaction for 1,5-Hexadiene
From previous modules (1,2), and the initial sections it is very evident that the HF method and the 3-21G basis set are not the most accurate way of determining the energy level of a conformer. Thus to be able to accurately determine the transition stay energy level and hence the activation energy (Transition state energy - reactants energy level) would be more accurately determined. Thus a better approximation to the energy level is expected to be attained via the use of the Density Functional Theory method instead (DFT) with the Larger more accurate 6-31G(d) basis set instead. As it is a different method and basis set, significant changes in both the chair and boat transition states are anticipated.
DFT Optimisation for the Chair Transition State compared against the HF method
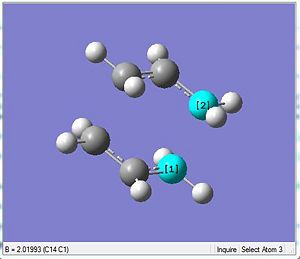
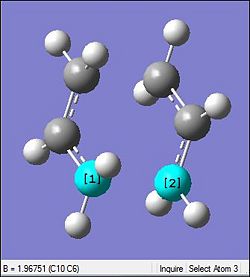
The table below shows the comparison between the HF method against the DFT where the latter uses the more accurate basis set for the optimisation process. Using the chair transition state initially optimised by the HF/3-21G, the DFT method was used to further optimised the chair transition state.
 |
 | |||||||
|
| |||||||
 |
 | |||||||
| Source File | [|D-Space link to DFT/6-31 G(d) chair optimisation ] |
As anticipated, there is a significant different in the total energy of the transition state. The more accurate basis set results in a more stable energy representation of -234.6 a.u. as compared to the HF method which gives the energy to be -231.6 a.u. Similarly with the DFT a smaller inter-allyl fragment distance is observed where there is a reduction by 0.05 Å. The shorter the distance the greater the bond strength which also usually adds up to a more stable (more negative) total energy. However, there is a slight increase in the C-C bond length within the fragements which could be due to the slightly smaller bond angle seen as well.
The most distinct difference is seen in the Imaginary vibrational wave number as seen in the table above. The larger the magnitude of the wavenumber is an indication of a higher energy. Thus the DFT method has a smaller magnitude for the wavenumber since it is the more stable optimisation (more negative). This could be rationalised based on the fragments being closer. This is because, when closer there will be more attraction which would bring better stabilisation and so the vibrations should be lesser which is indicative by a smaller magnitude of -556 relative to the -818 by the HF method.
DFT Optimisation for the Boat Transition State compared against the HF method
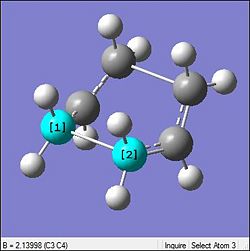
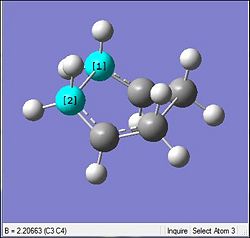
Again in the table below the optimisation for the boat geometry was carried out similar to that done previously
 |
 | |||||||
|
| |||||||
 |
 | |||||||
| Source File | [|D-Space link to DFT/6-31 G(d) boat optimisation ] |
From the table it can be seen that there is minimal changes in the geometry which is indicative that the HF optimisations were relatively accurate and the DFT was just a further accuracy enhancement. The same can be said by looking at the bond lengths which did not change by much (0.02Å). However, looking at the energies there is again a very large difference relative to each other but is mainly due to the different method being used to calcualte. Thus they are not really on the same basis to be compared. Thus the other parameters will be looked at. But it must be said that as expected the DFT did result in the total energy to be resulting in a slightly more negative one.
Similar to the chair, the biggest change is seen in the vibrational frequency of the imaginary mode. However the same rationalised used for interfragment distance against wavenumber completely fails here. Through the optimisation here the fragment distance increases by 0.07Å. Thus by the previous section's rationale with a larger distance there should be lesser interaction and the stretches would be of a much higher magnitude. But the opposite is seen where by the vibrational magnitude is similar to that seen in the chair. This concludes that the initially made rationalisation is wrong and a correct one is yet to be determined.
Calculating the Activation Energies
As the reoptimisation of the chair and boat structures using the B3LYP/6-31G (d) basis set was carried out, the frequency calculations were carried out for both the HF/3-21G and the B3LYP/6-31G(d) optimised structures.
| HF/3-21G | HF/3-21G | HF/3-21G | B3LYP/6-31G(d) | B3LYP/6-31G(d) | B3LYP/6-31G(d) | |
| Electronic energy (amu) | Sum of electronic and zero-point energies (amu) | Sum of electronic and thermal energies (amu) | Electronic energy (amu) | Sum of electronic and zero-point energies (amu) | Sum of electronic and thermal energies (amu) | |
| at 0 K | at 298.15 K | at 0 K | at 298.15 K | |||
| Chair TS | -231.6193 | -231.46640 | -231.46670 | -234.55700 | -234.42113 | -234.4090 |
| Boat TS | -231.60280 | -231.45093 | -231.44530 | -234.54309 | -234.40234 | -234.39601 |
| Reactant (anti-2) | -231.69254 | -231.53954 | -231.53241 | -234.61171 | -234.46897 | -234.46186 |
[|Link to D-Space for HF3-21G CHAIR TS @ 298.15k]
[|Link to D-Space for HF3-21G Boat TS @ 0k ]
[|Link to D-Space for HF3-21G Boat TS @ 298.15k ]
[|Link to D-Space for B3LYP/6-31G (d) CHAIR TS @ 0k ]
[|Link to D-Space for B3LYP/6-31G (d) CHAIR TS @ 298.15k]
[|Link to D-Space for B3LYP/6-31G (d) Boat TS @ 0k ]
[|Link to D-Space for B3LYP/6-31G (d) Boat TS @ 298.15k ]
The table above would be computing the specific energies from the two transition states with varying types of basis sets used as well as the different temperatures they are carried out at. When these values are compared with those provided it [| Appendix 2 ]. It can be seen that they are very much alike with slight deviations from the 4th decimal place onwards. This would be deemed to be of a negligible deviation. It can be seen that using the larger basis set (6-31G(d)) would result in the energies to be significantly different. This could be rationalised to be due to the different method being used to calculated and cant be compared directly against each other as they are based on different approximations.
From the table it can be seen that as the temperature is increased the energies of the reactant and the transition states are closer. However, the transition state of the boat would still be higher than the energy of the chair transition state. This is indicative that the chair transition state being more stable would impose a smaller potential energy barrier towards product formation as compared to that of the boat. This will be more distinctly show in the table below.
| Transition State | Activation Energy at 0 K (kcal-1) [HF/3-21G] | Activation Energy at 0 K (kcal-1) [DFT/6-31G(d)] | Activation Energy at 298.15 K (kcal-1)[HF/3-21G] | Activation Energy at 298.15 K (kcal-1)[DFT/6-31G(d)] | Experimental Activation Energy at 0 K (kcal-1) |
|---|---|---|---|---|---|
The values in the table are calculated by individually determining the activation energies (EA) for both the transition states at the different temperatures. For the calculations at 0 K this was done by taking the difference between the (sum of the electronic and zero-point energies) of reactant anti2 and the chair/boat transition state, multiplied by 627.509 kcal/mol. Similar for the calculations at 298.15 K was done by taking the difference between the (sum of the electronic and thermal energies) of reactant anti1 and the chair/boat transition state, multiplied by 627.509 kcal/mol.
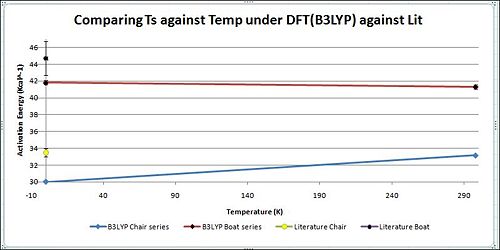
From the table and graph it can be seen that the activation energy as predicted for the Ts Boat is always higher than that for the Ts Chair. With increasing temperature, the difference still remains significantly large. This is because the chair conformation has the staggered structure which would have the minimum steric repulsion as the CH2 ends are on opposite sides of the plane. But for the boat both the CH2 ends are on the same side of the plane which results in increased steric repulsion due to the eclipsed conformation. This destabilises the transition state and thus would be of a much higher energy level than the Chair.
The values in the above table correspond well to the 'model' results provided in the Appendix 2. This shows that the calculations were successful. However when the results were compared with literature, it can be seen there is about a 35% deviation at 0K. This would be indicative that the computationally generated values were not optimised to most ideal transition state conformations. Thus were not of the most minimum energy level. Thus further methods and different, more accurate basis sets could be considered to get the calculated values to be as close to that of experimental. When that is achieved, it would be indicative of an even more effective optimisation. However, for that degree of accuracy alot more computer resources can be anticipated and will not be considered for now.
Diels Alder Cycloaddition Reactions
In the previous section, the [3,3] Cope rearrangement reaction was analysed and the activation energies was determined through analysis of the transition states. The same concepts will now be translated onto the pericyclic type reactions. These are defined as Diels-Alder reactions which involves the 4π diene system to have a concerted reaction with the 2π dienophile.
For this report, two types of cycloaddition reactions will be looked at, the first will be a Prototypical Reaction between Cis-Butene and ethylene where there are no secondary orbital effects to consider (Diagram 17). The second reaction is a more complex diels alder reaction which has the involvement of the substituents that bring about secondary orbital effects (Diagram 18).
 |
 |
Pericyclic reactions are expected to have the [4+2] type cycloaddition which is a concerted rearrangement reaction. This has the simultaneous π-bond breaking and σ-bond formation. Through this analysis, the bond breaking and bond formation is expected to be better understood via analysis of the frontier molecular orbitals.[10]
The reactions occuring in the concerted stereospecific fashion can be an allowed or forbidden reactant; depending on the number of π electrons involved. The reaction will be allowed if the HOMO of one species can interact favourably with the LUMO on the other. [11] For this to occur there has to be a favourable molecular orbital overlap between the two MOs
Cycloaddition reaction for the Prototypical Reaction (Cis-Butene and ethylene)
The diene is a conjugated π-system consisting of 4 π-electrons while the ethene acts as the dienophile consisting of a 2 π-electron system. The reaction between 1,3-butadiene and ethene to give cyclohexene is described as a [4+2] cycloaddition reaction. This type of cycloaddition is also called a Diels-Alder reaction.
In a Diels-Alder reaction the 4 π-electron system is referred to as "the diene" and the 2 π-electron system as the "dieneophile". These terms are used in related [4+2] reaction systems even when the functional groups are not actually dienes or alkenes.[12]
HOMO-LUMO Analysis
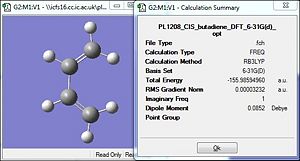
The diene and the dienophile were optimised via the 'first round' of optimisation using the HF/3-21G method [|link to 3-21G optimisation for Butadiene]. A more accurate optimisation was then carried out by the DFT/B3LYP method to ensure the minimal geometry was achieved [|link to B3LYP opt for Butadiene] [|link to B3LYP opt for Ethylene]. Both the optimisations resulted in the final outcome structure to be planar and having the C2V point group symmetry. The same process of optimisation was then carried out for the ethylene as well. The table below would be summarising the total energy upon the optimisation. The RMS gradient for both reactants is well below the value of 0.001 (a.u.); indicative of the convergence to the present threshold (Table 16). Thus, it could be concluded that the optimisation was successful for both reactants.
| 1,3 Butadiene | Ethylene |
|---|---|
 |
 |
Using the DFT optimised file, a further molecular orbital calculation was carried out via the Semi-Empirical method defined as AM1. The molecular orbitals were then displayed with specific attention towards the HOMO and LUMO for each reactant and their symmetry of orbital lobes. The results are summarised in the two tables below.
| Parameter | 1,3-Butadiene | |
| HOMO | LUMO | |
| Molecular Orbital | 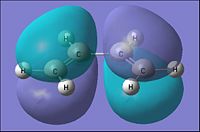 |
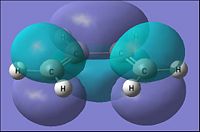
|
| Energy of MO (a.u.) | -0.343 | 0.017 |
| Symmetry | Antisymmetric | Symmetric |
| [|D-space link to Butadiene MO analysis] | ||
From the table above it can be seen that the cis-Butadiene has the HOMO to be of an Anti-symmetric orbital distribution with respect to the reflection plane(σv). For the Lumo with respect to the same plane, it has a symmetric distribution.
| Parameter | Ethylene | |
| HOMO | LUMO | |
| Molecular Orbital | 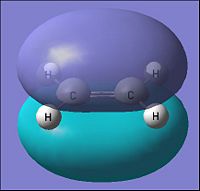 |
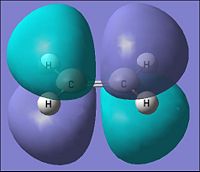
|
| Energy of MO (a.u.) | -0.387 | 0.052 |
| Symmetry | Symmetric | Antisymmetric |
| [|D-space link to Ethylene MO analysis] | ||
From the table above it can be seen that the ethylene would have the HOMO to be of a symmetric orbital distribution with respect to the reflection plane(σv). For the Lumo with respect to the same plane it has a asymmetric distribution.
The HOMO of the cis-butadiene and LUMO of the Ethylene are both anti symmetric which allows them to have a favourable orbital overlap. Thus orbital interactions between this pair can be anticipated. The HOMO-LUMO gap here would be 0.395 (a.u.)
Similarly comparing the LUMO of the cis-butadiene and HOMO of the Ethylene are both symmetric which allows them to have a favourable orbital overlap. Thus orbital interactions between this pair can be anticipated. The HOMO-LUMO gap would be 0.404 (a.u.)
Where by the smaller HOMO-LUMO gap is expected to be more favoured as it would allow a greater splitting which brings about a greater extent of stabilisation.
Further Analysis and MO analysis
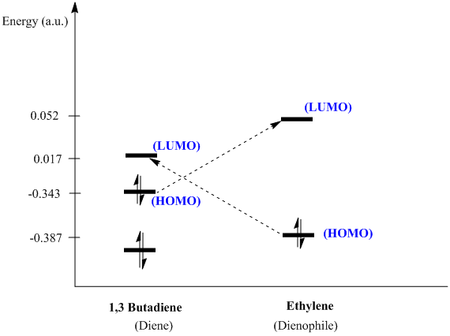
The diagram above would facilitate the rationalisation on why the reaction is allowed. The reaction happening with 2N+2 electrons where n=2 would be indicative of a thermodynamically occurring reaction. There will be a suprafacial type addition of the two fragments to form the cyclic compound. From the above diagram it is seen that the orbitals would be able to overlap as they are of the similar symmetry and the energy gap is not very big allowing effective orbital overlap to form the molecular orbitals of the cyclic ring. The HOMO-LUMO gap where butadiene is acting as the HOMO is of a smaller magnitude making that overlap more favoured as compared to the other HOMO-LUMO combination. Thus this fits with theory where the butadiene functions as the diene and the ethylene functions as the dienophile.
Transition state Analysis
To deviate from normality, my approach to the optimisation of the transition state, would be via the QST2 method which proved reliable but tedious in the earlier sections will be used and also by the Frozen Coordinate method. Similar to processes followed before, the reactants and the products were drawn as follows.
The terminal carbon carbon bond length (not connected for the reactants but connected for the products) were set at 2.10 Å. The transition state is expected to have the diene approaching from above or below the plane in an envelope type fashion. This is becuase, theoretically, it would allow a maximisation of the orbital overlap between the ethylene π orbitals (π/π*) and the π system of 1,3-butadiene. Thus the ethylene is drawn slightly above the plane of the butadiene.
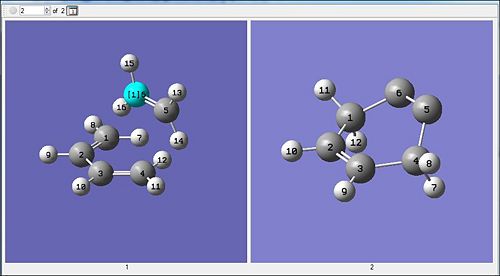
Method 1 : QST2 via HF/3-21G and DFT/B3LYP/6-31G(d)
| Method | QST2 via HF/3-21G | QST2 via B3LYP/6-31G(d) | ||||||
|---|---|---|---|---|---|---|---|---|
| Optimized Structure |  |
| ||||||
| Energy/a.u. | 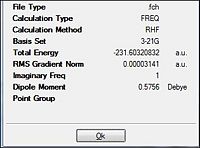 |
 | ||||||
| Imaginary Frequency/cm-1 | -818 | -524 | ||||||
| Animation of Imaginary Frequency |
|
| ||||||
| D-Space Links | [|HF/3-21G] |
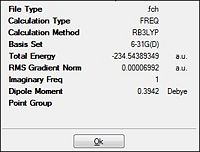
There is a single imaginary frequency which is indicative of the transition state (Table 19). This is because, being a single negative frequency it is indicative of a maximum turning point in the reaction profile and so the optimisation has been successful towards the transition state instead of the ground state. From the table, it has been observed that that inter-fragment distance is different via the two methods. This will be analysed in the section to come. But comparing the total energy of the two methods, it can be seen that the more accurate b3lyp method results in a more negative value. However, as they are different methods of calculation they cant be compared quantitatively.
Looking at the RMS gradient, both the optimisations can be concluded to have reached a convergence. This is because both have a gradient significantly lesser than 0.001 a.u. of 0.00003 a.u. and 0.00007 a.u. respectively. Thus the results would be deemed to be accurate and would be expected to have successfully optimised towards the transition.
The biggest difference in values between the two methods is seen in the imaginary wavenumber. The difference is almost twice in-magnitude but this difference could be attributed to the different type of method and basis set used. This is because analysis of the animation below would show that they are of the same type of vibrational stretches.
Anlysis of the animation shows that the ethylene is approaching the terminal end of the butadiene, and when this happens there is the back-bending of the hydrogens. This could be due to the loss of bond order (2 to 1) which results in sp2 towards sp3 carbon centre so the bond angles increase. The ethylene approaching in the synchronous fashion is indicative of the reaction being a concerted mechanism (As expected for a cycloaddition !). The elongation of the double bonds on the butadiene are indicative of a lower bond order; bond breaking occurs. Similarly the c-c (2 and 3) are seen to get shorter as the ethylene approaches which is indicative of higher bond strength and hence a higher bond order (double bond). From this it can be seen that the QST2 has successfully optimised towards the envelope-shaped transition state of the cycloaddition.
Method 2 : Ts (Berny) via HF/3-21G and DFT/B3LYP/6-31G(d)
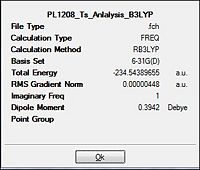
The transition having known to be an envelop type structure, would be carried out in two steps where the first step would be the frozen coordinate type condition. This was implemented to 'lock' the distance between the terminal carbons at 2.10 Å which the result of the transition state bonds relax. The molecule was arrange to be locked at such a distance with the ethylene to be orientated above the butadiene so that it significantly mimicks the expected transition state orientation. Upon the frozen optimisation, the Ts(Berny) mode was selected to allow the reactants to get closer towards formation of the transition as rationalised in the earlier sections. Both the less accurate HF/3-21G method and the DFT/B3LYP/6-31G(d) method were implemented. The table below summarises the results and findings.
| Method | Ts (Berny) via HF/3-21G | Ts (Berny) via B3LYP/6-31G(d) | ||||||
|---|---|---|---|---|---|---|---|---|
| Optimized Structure | 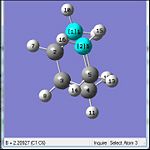
|

| ||||||
| Energy/a.u. | 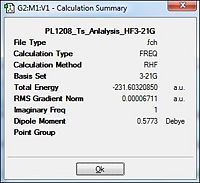 |
 | ||||||
| Imaginary Frequency/cm-1 | -820 | -524 | ||||||
| Animation of Imaginary Frequency |
|
| ||||||
| D-Space Links | [|HF/3-21G] |
The table above would have a very similar representation of values to that of method 1. It can be concluded that this method of the Ts (BERNY) was similarly accurate in deriving with the almost same results as those in method 1. Thus, it could be concluded that the optimisation efforts towards the transition state was successful. This was further confirmed from the animation of the imaginary vibrations which were also synchronous of the ethylene approaching the butadiene and were the same as that of method 1, indicative of the concerted cycloaddition transition state.
Reconfirming the attainment of the transition state
IRC Analysis
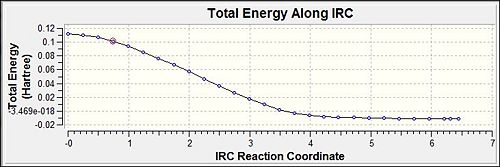
[|IRC analysis of Transition state n=30]
 |
 |
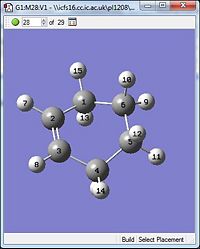 |
The IRC optimisation was carried out to complement the earlier made conclusions that the optimisation was successful towards the transition. It is seen that the total energy plateau off to indicate the convergence. Furthermore, analysis of the first and the final steps in the optimisation would show that the final step has the conformation to be exactly that of the expected transition state. Thus it can be concluded that the optimisation was successful in both methods above as they lead to the same energy level.
Bond Length Analysis
| Diagram with labelling | 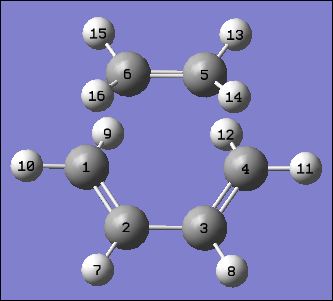
| ||
| Type of Method | B3LYP/6-31 G(d) | HF/3-12G | Literature HF/3-12G[13] |
| Bond lengths C1-C6/ C4-C5 (Å) | 2.27230 (2.27) | 2.20927 (2.21) | 2.2-2.3 |
| Bond length C1-C2/ C3-C4 (Å) | 1.38305 (1.38) | 1.37007 (1.37) | 1.37 |
| Bond lengths C5-C6 (Å) | 1.38597 (1.39) | 1.37603 (1.38) | 1.39 |
| Bond length C2-C3 (Å) | 1.40721 (1.41) | 1.39407 (1.39) | 1.40 |
| Typical C-C bond length[14] (Å) | 1.54 | ||
| Typical C=C bond length[15] (Å) | 1.35 | ||
| Typical sp2-sp3 C-C bond length[16] (Å) | 1.50 | ||
The DFT method of optimisation results in the bond lengths to be slightly longer than those of the HF method of optimisation. But comparing the literature HF values against those from the computationally attained value, it is almost a perfect match ! This is indicative that the calculations towards optimisation especially via the HF/3-21G method were highly successful.
Comparing between the different C-C bond lengths show that the forming C-C sigma bonds (1-6 and 4-5) are of slightly greater than the typical C-C bond length of 1.54Å. This is because, the bond lengths calculated are that of the transition state where the bond has not been completely formed. It is definitely lesser than 1 which shows it is not fully formed yet. Similarly, the C=C bonds (1-2 and 3-4) are slightly longer than the typical bond length of a double bond. This lengthening is indicative of the loss in bond order; loss in bond strength. This would be explained by the cycloaddition process which breaks the pi-bonds to form the 2 new sigma bonds. In this case, the pi-bonds are partially broken and hence longer than expected. But as the C=C bond lengths are closer to the typical C=C instead of the typical C-C bond length. It would mean the transition state more closely resembles the reactants than the products. Thus it would be an early activation energy barrier expected.
Molecular Orbital Analysis : HOMO and LUMO of the Transition State
| Parameter | HOMO of Transition State | LUMO of Transition State |
|---|---|---|
| Diagram of MOs |  |
 |
| Energy of MO (a.u) | -0.323 | 0.023 |
| Symmetry | Asymmetric | Symmetric |
Comparing the Above molecular orbitals with the individual HOMO and LUMO of butadiene and ethylene. The specific reactant HOMO and LUMO contributions can be determined.
- For the Asymmetric HOMO of the transition state, it can be seen to be an overlap between the LUMO of Ethylene and the HOMO of the 1,3-Butadiene.
- For the Symmetric LUMO of the transition state, it is an overlap between the HOMO of ethylene and the LUMO of 1,3-Butadiene.
The above observations would allow the conclusion to be made that the two reactants do form the product via a concerted cycloaddition. The LUMO are made up of the π* orbital of C=C bonds on both alkene functionalities while the HOMO are π orbitals on both alkene functionalities as well. This justfies the expected reaction where the electron rich 1,3-butadiene (HOMO) would have the favourable π-orbital overlap with the empty π* orbital of ethylene (LUMO). Another point that justifies this is that this combination of HOMO-LUMO has a smaller orbital energy difference and thus would allow a greater overlap and hence larger splitting which is more favourable as it brings greater MO (bonding) stabilisation.
Cycloaddition reaction between 1,3-Cyclohexadiene and Maleic Anhydride
Experimentally it has been shown that there are two possible products that result from the [4+2] Diels-Alder pericyclic reaction of 1,3-cyclohexadiene (diene) with the Maleic Anhydride (dienophile). This [4+2] cycloaddition would be highly similar to the prototypical reaction carried out. However, the main differences expected to be seen are those due to the influence the substituted reactants bring about.
A similar approach would be taken to first optimise the structures of both the reactants and transition states. This would then allow the total energy of the molecules involved to be determined as well as to carry out a Molecular Orbital analysis to rationalise the HOMO-LUMO interaction. The overall aim would be to computationally generate results to justify and rationalise why there is a regioselectivity for the endo product instead of the exo product.
Optimisation and MO analysis of Reactants
| Diene = Cyclohexa-1,3-diene | Dienophile = Maleic Anhydride | |||
| Semi-Empirical method (AM1) | DFT/B3LYP/6-31G(d) | Semi-Empirical method (AM1) | DFT/B3LYP/6-31G(d) | |
| Summary Table | 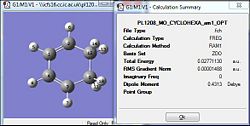 |
 |
 |
|
| RMS (a.u.) | 0.00001 | 0.00000006 | 0.00002 | 0.0000007 |
| Source | [|D-Space] | [|D-Space] | [|D-Space] | [|D-Space] |
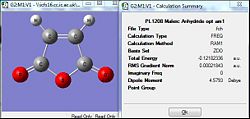
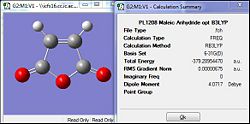
The optimisation of the two reactants were first carried out via the semi-empirical AM1 method and was subsequently further optimised by the DFT/B3LYP method that was expected to give a more accurate optimisation to the lowest energy configuration. As they are totally different methods and working on different assumptions, the total energy cant be compared against each other. However the RMS gradient can be compared where by when the value is lesser than 0.001 a.u. it is taken to have converged and would have been successfully optimised. Comparing the AM1 method against the B3LYP, both method appear to have successful optimisation as their gradients are significantly lower than the present threshold. But for the B3LYP method, the gradient is much more closer to zero which is indicative of an even 'more' horizontal plot. This could be attributed to the more accurate basis set which allowed a more accurate optimisation.
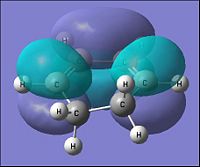
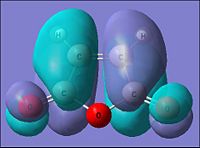
Using the DFT optimised file, a molecular orbital calculation was carried out via the Semi-Empirical method defined as AM1. The molecular orbitals were then displayed with specific attention towards the HOMO and LUMO for each reactant and their symmetry of orbital lobes. The results are summarised in the two tables below.
| Parameter | Cyclohexa-1,3-diene | |
| HOMO | LUMO | |
| Molecular Orbital | 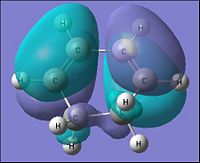 |
|
| Energy of MO (a.u.) | -0.321 | 0.016 |
| Symmetry | Antisymmetric | Symmetric |
| [|D-space link to Cyclohexa-1,3-diene MO analysis] | ||
| Parameter | maleic anhydride | |
| HOMO | LUMO | |
| Molecular Orbital | 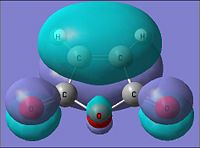 |
|
| Energy of MO (a.u.) | -0.441 | -0.059 |
| Symmetry | Symmetric | Asymmetric |
| [|D-space link to maleic anhydride MO analysis] | ||
As the HOMO of the Cyclohexa-1,3-diene and and LUMO of the maleic anhydride are both Asymmetric, this would mean they would have a favourable orbital overlap and thus would be able to have the interactions between the orbitals. The HOMO-LUMO energy gap in this possible overlap would be 0.262 (a.u.)
Similarly comparing the LUMO of the Cyclohexa-1,3-diene and and HOMO of the maleic anhydride are both symmetric, this would mean they would have a favourable orbital overlap and thus would be able to have the interactions between the orbital. The HOMO-LUMO energy gap in this possible overlap would be 0.457 (a.u.)
This would show that the first combination where the Cyclohexa-1,3-diene acting as the HOMO would have a smaller energy gap which would allow a more effective orbital overlap and thus would result in greater orbital splittings. This is more favoured as it would bring about a greater degree of stabilisation. Thus it can be concluded that the system would prefer to have the HOMO via the Cyclohexa-1,3-diene as anticipated by theory where Cyclohexa-1,3-diene is the electron rich diene.
Transition State Analysis
Vibrational Analysis
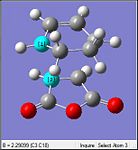
From the MO analysis carried out, it is seen that the HOMO of the Cyclohexa-1,3-diene will have an effective orbital overlap with the LUMO of maleic anhydride as it would have the smaller orbital energy gap. To go with a tried and tested theory, the same method of optimisation for the Diels-Alder reaction between ethylene and butadiene was used. A guessed structure of the transition state was drawn for both the endo and the exo transition states. The C-C bond that was expected to be formed via the cycloaddition was 'frozen' at 2.10 (Å).
Following this step the Redundant option was selected and an optimisation via the Ts(Berny) mode via the HF/3-21G method and basis set was carried out. The same process was then carried out with a further optimisation with the DFT/B3LYP/6-32G(d)method and basis set.
| Method | Ts (Berny) via HF/3-21G | Ts (Berny) via B3LYP/6-31G(d) | |||
|---|---|---|---|---|---|
| Optimized Structure | 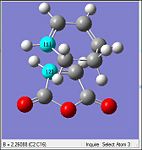
|
| |||
| Energy/a.u. | 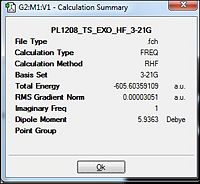 |
 | |||
| Imaginary Frequency/cm-1 | -647 | -449 | |||
| Animation of Imaginary Frequency |
|
 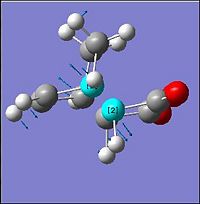 | |||
| D-Space Links | [|HF/3-21G] |
| Method | Ts (Berny) via HF/3-21G | Ts (Berny) via B3LYP/6-31G(d) | |||
|---|---|---|---|---|---|
| Optimized Structure | 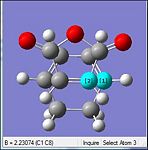
|

| |||
| Energy/a.u. | 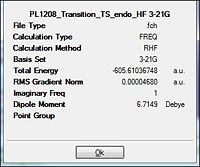 |
 | |||
| Imaginary Frequency/cm-1 | -643 | -446 | |||
| Animation of Imaginary Frequency |
|
  | |||
| D-Space Links | [|HF/3-21G] |
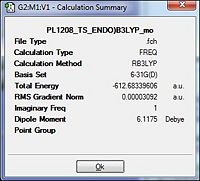
From the table it is observed that the RMS gradient is well below the present threshold and so convergence is observed and there being only a single negative frequency (imaginary) would be indicative of successful optimisation to the endo transition state (table 25). As different method and basis sets are used there is some difference in the total energies to be expected. The successful formation of the optimisation to the transition state is further observed by the animation of the vibrations.
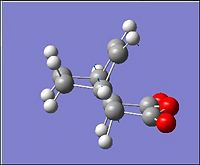
It would show the synchronous movement of the 'middle' two carbons closer to the end of the anhydride. This is indicative of bond formation via a concerted reaction. And when this happens the apex C-C bond in the cyclohexadiene becomes smaller which is indicative of the double bond formation due to the [4+2] cycloaddition. Similary the lengthening of the C=C bonds in the diene are indicative of the π bond being broken. Although different magnitudes of the imaginary frequencies are observed, both the vibrational motions are equivalent. (As the log file for the 6-31G frequency is very large, only screen shots were uploaded)
Suprisingly the exo optimisation would also result in relatively similar energy values and the vibrations both point towards effective optimisation towards the formation of the transition state. As there is no change seen in the rounded up total energy, more quantitative analysis is to be carried out to determine which is the more stable state (Table 26).
Geometric Analysis
| Type of Method - B3lyp/6-31G(d) | Endo Ts | Exo Ts |
| Diagram with labelling | 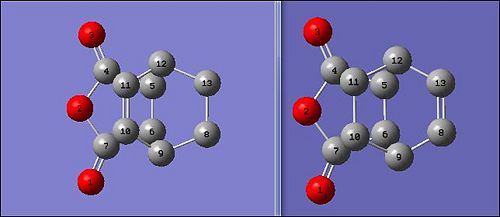 | |
| Interfragment Distance C-C (9-6 and 12-5) (Å) | 2.26933 (2.27) | 2.29012 (2.29) |
| Sigma Bond C-C (7-6 and 4-5) (Å) | 1.47943 (1.48) | 1.47952 (1.48) |
| Sigma Bond C-C (C5-C6)/ Former Double bond (Å) | 1.39379 (1.39) | 1.39793 (1.40) |
| C=C Bond Product (8-C13 and 10-11)/ Former Single bond (Å) | 1.40320 (1.40) | 1.40344 (1.40) |
| Sigma Bond C-C (9-C8 and 12-13) (9-C10 and 12-C11)/ Former Double bond (Å) | 1.39105 (1.39) | 1.39145 (1.39) |
| Dihedral Angle btw C=C in Cyclohexa and anhydirde plane (deg) | -64.811 C11-10-9-6 | 67.738 C13-8-9-6 |
| Through Space Distance (C=C)-(C-C) (Å) | 2.87336 (2.87) | 2.97342 (2.97) |
| Typical C-C bond length[17] (Å) | 1.54 | |
| Typical C=C bond length[18] (Å) | 1.35 | |
| Typical sp2-sp3 C-C bond length[19] (Å) | 1.50 | |
For the exo transition state, the 'spear-end' O=C-O-C=O of the Maleic anhydride is significantly further from the C=C bond than in the endo transition state. This would explain why the C-C forming sigma bonds (Interfragment) are longer in the exo transition state than in the endo. The C=C bonds which were former single bonds are much longer than the typical C=C bond which is due to the calculations being made in a transition state. In the transition state the pi bond are not fully broken or formed and thus there is the deviation from the typical bond lengths.
The Length of the C=C bonds being formed and being broken are between 1.40 and 1.39 Å while is as expected since it would be indicative of the concerted formation and breaking of bonds. When comparing the space distance of the C=C bond group from the dienophile, the endo Ts is seen to have a smaller distance of 2.87 Å as compared to the exo while had a further, sterically more favourable distance of 2.97 Å. However, due to the secondary orbital stabilisations the increased steric repulsions are overcomed by the favourable orbital overlaps to make the endo more stable.
Energetic Analysis of Transition States
This section aims to energetically determine which is the major product of the cycloaddition reaction. From the previous sections, it has been shown that the Endo product is the energetically favourable one due to the additional secondary orbital interactions it has. Thus it is anticipated that the Endo transition would be of a lower energy level so it is more readily attained and also the endo product should be energetically lower in energy.
There are three different groups that have to be analysed and the energies attained from them. To set a common ground of comparison, all the different molecules and transition states will be optimised by the B3LYP/6-31G(d) method and basis set.
i) Specific Energies for the Reactants
ii) Specific Energies for the two different Transition states
iii) Specific energies for the two types of products.
| Specific Energy (a.u.) | cyclohexa-1,3-diene | maleic anhydride | Total sum of Reactants |
|---|---|---|---|
| Electronic Energy | -233.41891079 | -379.28954470 | -612.7084554 |
| Sum of electronic and zero-point Energies at 0 K | -233.296099 | -379.233657 | -612.6525677 |
| Sum of electronic and thermal energies 298.15 K | -233.290921 | -379.228473 | -612.519394 |
| Source | [|Log File] | [|Log File] | - |
| Specific Energy (a.u.) | Exo Transition State | Endo Transition State |
|---|---|---|
| Electronic Energy | -612.67931093 | -612.8339606 |
| Sum of electronic and zero-point Energies at 0 K | -612.498014 | -612.502133 |
| Sum of electronic and thermal energies 298.15 K | -612.487663 | -612.491779 |
| Source | [|Log File] | [|Log File] |
There are three sets of Activation Energies for the Transition states for each of the transition states Which is attained by taking the transition state specific energy and determine the difference relative to the total energies of the reactants. The results are summarised in the two tables below.
| Specific Activation Energy | (a.u) | Kcal mol -1 |
|---|---|---|
| Activation Energy (Electronic Energy) | 0.0291445 | 18.28843 (18.3) |
| Activation Energy (Sum of electronic and zero-point Energies at 0 K) | 0.1545537 | 96.9838377 (97.0) |
| Activation Energy (Sum of electronic and thermal energies 298.15 K) | 0.031731 | 19.91148808 (19.9) |
| Specific Activation Energy | (a.u) | Kcal mol -1 |
|---|---|---|
| Activation Energy (Electronic Energy) | 0.0255052 | 16.00474255 (16.0) |
| Activation Energy (Sum of electronic and zero-point Energies at 0 K) | 0.1504347 | 94.39912816 (94.4) |
| Activation Energy (Sum of electronic and thermal energies 298.15 K) | 0.027615 | 17.32866104 (17.3) |
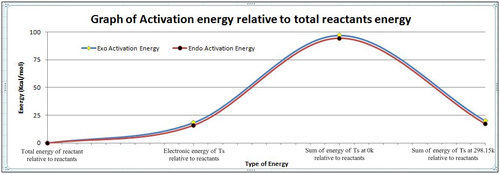
From the above graph it can be seen that comparing all the different activation energies would show that the endo-transition state would have the lower activation energy barrier. This would mean it is more energetically accessible as compared to the exo transition despite the endo having a greater steric hindrance as compared to the exo. This can be rationalised as being due to the secondary orbital interactions present in the endo and not the exo that allows the steric hindrance experiences to be overpowered by the stabilisation brought about by the overlapping secondary orbitals. The difference in the energy between the two transition states is significant (electronic = 2.3 Kcal/mol). This difference would explain why under kinetic control there is the possibility of attaining only the endo isomer.
To conclude the energy analysis, the energies of the two different products will also be analysed to determine if the endo is indeed the more thermodynamically favoured product.
| Specific Energy (a.u.) | Exo Product | Endo Product | Endo-Exo (Energy Difference)/ Polarity |
|---|---|---|---|
| Diagram of Products | 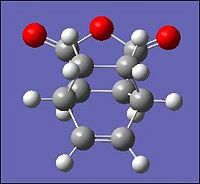 |
 |
- |
| Electronic Energy | -612.75578460 | -612.75829022 | -0.0025056 (Negative) |
| Sum of electronic and zero-point Energies at 0 K | -612.569372 | -612.572070 | -0.002698 (Negative) |
| Sum of electronic and thermal energies 298.15 K | -612.559972 | -612.562604 | -0.002632 (Negative) |
| Source | [|D-Space Exo] | [|D-Space Endo] |
Analysis of the energies of the two types of products show that the two products have a small difference in their total electronic energy. Although the endo product is of a smaller magnitude, it is not that big a difference to rule it as the thermodynamic product. This would explain why in the experimental reactions carried out under thermodynamic control, there is a mixture of the products being formed. But all the polarity of the differences in the specific energy being negative is indicative that the endo product is the more stable isomer of the two. As the energy difference is small there is a mixture, however being the more stable product it would be the major product of the mixture. This agrees with literature so the computationally attained results are accurate to that of literature and the 'Endo-Rule'.
Theoretical Explaination Compared Against Computational Results [20] [21]

The primary orbital interactions are defined as interactions that result in the formation of formal bonds such as sigma bonds and pi bonds which are the primary head-head and side-side orbital overlap respectively. In contrast, the secondary orbital overlaps make reference to the orbital interactions that do not form primary bonds but are able to bring additional stabilisation to the molecule. But for this type of stabilisation to occur, the orbitals have to be within a certain distance of each other and are to have the correct phase symmetry to allow the effective orbital overlap. From the Diagram above it can be seen that the endo product has the fragments arranged to be much more sterically unfavourable. However, it allows the other set of p orbitals to be close enough to have the secondary orbital interactions that has been seen present in the above analysis.
| Exo-Transition State | Endo Transition state | |||
| HOMO | LUMO | HOMO | LUMO | |
| Molecular Orbital |  |
 |
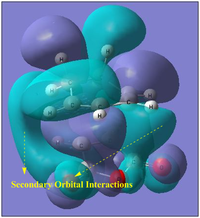 |

|
| Energy of MO (a.u.) | -0.323 | 0.058 | -0.324 | 0.073 |
| Symmetry | Antisymmetric | Antisymmetric | Antisymmetric | Antisymmetric |
| Source File | [D-Space] | [| D-Space] | ||
From the above molecular orbitals which has the isolobal value decreased to 0.004 to allow the secondary orbital interactions (if any) to be observed. Comparing the HOMO of the two transition states, it is seen that the Endo transition state is of a lower energy level (more negative) than the HOMO of the exo. This can be rationalised by looking at the cyclohexadiene fragment which shows the presence of the secondary orbital overlapping being present but absent in the exo transition state. Thus the secondary orbital interactions being present has been proven via MO analysis and explains why the endo although more sterically hindered it is more stable
Conclusion
All the calculations in the diels alder reactions agree well with that expected of literauture. The secondary orbital interactions were proven to be existant for the Endo product via MO analysis. Thus this module was a highly exciting one while explain my possible over-enthusiasm to provide as much detail as possible. Advanced apologies for that.
Fisty 23:12, 22 March 2011 (UTC)
References
- ↑ Williams, R. V., Chem. Rev. 2001, 101 (5), 1185-1204.
- ↑ Arthur C. Cope; et al.; J. Am. Chem. Soc. 1940, 62, 441.
- ↑ Hehre, W. J.; Radom, L.; Schleyer, P. v. P.; Pople, J. A. Ab initio Molecular Orbital Theory; Wiley: New York, 1986
- ↑ https://wiki.ch.ic.ac.uk/wiki/index.php?title=Mod:phys3#Appendix_1
- ↑ https://wiki.ch.ic.ac.uk/wiki/index.php?title=Mod:phys3#Appendix_1
- ↑ B. G. Rocque, J. M. Gonzales, H. F. Schaefer, Mol. Phys., 2002, 100, pp. 441-446
- ↑ https://wiki.ch.ic.ac.uk/wiki/index.php?title=Mod:phys3#Appendix_1
- ↑ M.J. Goldstein, M.S. Benzon, J. Am. Chem. Soc., 1972, 94, 7147. DOI:10.1021/ja00775a046
- ↑ M.J. Goldstein, M.S. Benzon, J. Am. Chem. Soc., 1972, 94, 7147. DOI:10.1021/ja00775a046
- ↑ http://pubs.acs.org/doi/abs/10.1021/ja01474a023
- ↑ http://www.meta-synthesis.com/webbook/49_pericyclic/pericyclic.html
- ↑ http://www.meta-synthesis.com/webbook/49_pericyclic/pericyclic.html
- ↑ C. Spino, M. Pesant and Y. Dory, Angew. Chem. Int. Ed. Engl., 37, 3262 (1998)
- ↑ G. Schultz, I. Hargitta, J. Mol. Struc., 1995, 346, pp. 63-69
- ↑ G. Schultz, I. Hargitta, J. Mol. Struc., 1995, 346, pp. 63-69
- ↑ G. Schultz, I. Hargitta, J. Mol. Struc., 1995, 346, pp. 63-69
- ↑ G. Schultz, I. Hargitta, J. Mol. Struc., 1995, 346, pp. 63-69
- ↑ G. Schultz, I. Hargitta, J. Mol. Struc., 1995, 346, pp. 63-69
- ↑ G. Schultz, I. Hargitta, J. Mol. Struc., 1995, 346, pp. 63-69
- ↑ Alder, K.; Stein, G. Justus Liebigs Ann Chem 1934, 514, 1;
- ↑ Garcı´a, J. I.; Mayoral, J. A.; Salvatella, L. Acc Chem Res 2000, 33, 658.


